Industrial Tube Market Overview and Analysis

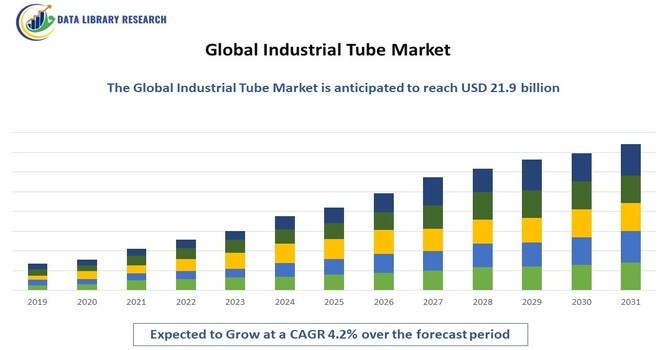
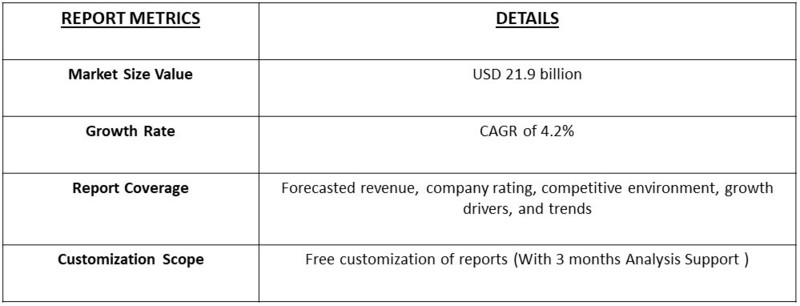
According to recent market research, the Global Industrial Tube Market is projected to reach a market value of USD 14.8 billion in 2023, growing at a compound annual growth rate (CAGR) of 4.2% from 2023 to 2031, reaching to USD 21.9 billion by 2031.

Industrial Tube Market

Get Complete Analysis Of The Report - Download Free Sample PDF

The Industrial Tube Market encompasses the production and distribution of tubular products used in various industrial applications, including manufacturing, construction, and automotive sectors. These tubes are typically made from materials such as steel, aluminum, plastic, and copper, and are utilized for conveying fluids, structural support, and mechanical components. The market is driven by the demand for lightweight, high-strength materials that enhance operational efficiency and reduce production costs. Technological advancements in manufacturing processes, such as precision tube forming and automated welding, are also contributing to market growth. Increasing infrastructure development and industrial activities globally further bolster the demand for industrial tubes.

Industrial Tube Market include the growing demand for infrastructure development, which requires robust and reliable tubular products for construction and manufacturing applications. The increasing emphasis on energy efficiency and lightweight materials across industries, particularly in automotive and aerospace sectors, is driving the adoption of high-strength, lightweight tubes. Additionally, advancements in manufacturing technologies are enhancing production capabilities and reducing costs, further stimulating market growth. The rise in industrial automation and the need for efficient fluid transport systems also contribute to the demand for industrial tubes. Finally, regulatory standards promoting safety and quality in construction and manufacturing processes are propelling the market forward.

Industrial Tube Market Trends

The Industrial Tube Market is witnessing a paradigm shift towards sustainable and eco-friendly solutions, driven by increasing environmental concerns and regulatory pressures. Key trends shaping the market include the adoption of advanced materials such as high-strength, high-temperature, and corrosion-resistant alloys, as well as the growing demand for precision-engineered tubes with complex geometries. Additionally, the market is seeing a trend towards digitalization, with the integration of Industry 4.0 technologies such as IoT, AI, and data analytics to optimize tube manufacturing and inspection processes. Furthermore, the market is also witnessing a shift towards regionalization, with manufacturers focusing on local production to reduce logistics costs and improve supply chain efficiency.

Market Segmentation

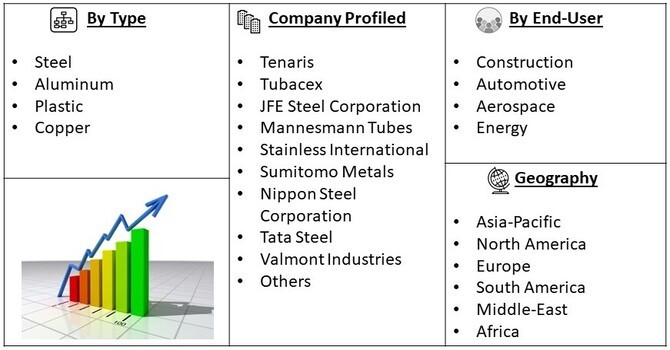
The Global Industrial Tube Market is segmented by Material Type (Steel, Aluminum, Plastic, Copper) End-use Industry (Construction, Automotive, Aerospace, Energy) and geography (Asia-Pacific, North America, Europe, South America, and Middle-East and Africa). The report offers the market size and forecasts for revenue (USD million) for all the above segments.

Industrial Tube Market Seg

For Detailed Market Segmentation - Get a Free Sample PDF

Market Drivers

  • Growing demand for oil and gas exploration

The Industrial Tube Market is being driven by the growing demand for oil and gas exploration and production. The increasing global energy demand and the need for sustainable energy sources are driving the growth of the oil and gas industry, leading to a surge in demand for industrial tubes used in drilling, extraction, and transportation of oil and gas. According to the International Energy Agency, global oil and gas production is expected to increase by 10% by 2025, driving the demand for industrial tubes. As a result, tube manufacturers are investing in research and development to develop high-strength, high-temperature, and corrosion-resistant alloys that can withstand the harsh conditions of oil and gas exploration. Advancements in material science and manufacturing technologies

  • Advancements in materials science and manufacturing technologies are also driving growth in the Industrial Tube Market.

The development of new materials such as advanced high-strength steel, titanium, and ceramic composites is enabling the production of tubes with improved strength, corrosion resistance, and durability. Additionally, advancements in manufacturing technologies such as 3D printing, laser cutting, and robotic welding are improving the efficiency and precision of tube manufacturing processes. According to a recent survey, 70% of tube manufacturers reported that advancements in materials science and manufacturing technologies were key drivers of growth in the market.

Market Restraints

One of the key restraints in the Industrial Tube Market is the fluctuating raw material prices, which can significantly impact the cost of production and profitability of tube manufacturers. The prices of raw materials such as steel, copper, and aluminum are subject to fluctuations in global demand and supply, which can lead to price volatility. According to a recent report, the prices of steel, for example, have increased by 15% in the past year, driven by increased demand from the construction and automotive industries. This price volatility can make it challenging for tube manufacturers to maintain stable production costs and pricing, which can impact their competitiveness in the market. As a result, tube manufacturers are focusing on developing strategies to mitigate the impact of raw material price fluctuations, such as diversifying their raw material suppliers and investing in cost-reduction initiatives.

COVID-19 Impact on Industrial Tube Market

 The COVID-19 pandemic significantly affected the Industrial Tube Market, initially causing disruptions in production and supply chains due to lockdowns and restrictions. Key sectors like construction, automotive, and energy faced project delays and reduced demand, leading to a slowdown in sales. However, as restrictions eased, a rebound in industrial activity emerged, driven by increased government investments in infrastructure and the recovery of the automotive sector. The pandemic also accelerated trends toward automation and digitalization, prompting manufacturers to enhance operational efficiency. Overall, while the market faced challenges during the peak of the pandemic, it showed resilience and adaptability, positioning itself for future growth.

Segmental Analysis

  • Steel Tubes Segment is Expected to Witness Significant Growth Over the Forecast Period

The steel tube sub-segment is a cornerstone of the Industrial Tube Market, known for its strength, durability, and versatility across various applications. Steel tubes are widely used in construction for structural supports, in automotive for frames and exhaust systems, and in oil and gas for pipelines. Recent developments include advancements in high-strength low-alloy (HSLA) steels, which provide improved performance while reducing weight. Additionally, the increasing focus on sustainability has driven the adoption of recycled steel in manufacturing processes, aligning with global environmental goals. The demand for steel tubes is primarily driven by the rapid growth in the construction sector, infrastructure projects, and automotive production, especially with the rise of electric vehicles, which require innovative lightweight solutions.

  • Aluminum Tubes Segment is Expected to Witness Significant Growth Over the Forecast Period

The aluminum tube sub-segment is experiencing significant growth due to aluminum's lightweight nature and corrosion resistance, making it ideal for applications in the automotive, aerospace, and construction industries. Recent innovations include the development of aluminum alloys that enhance strength while maintaining a low weight, crucial for improving fuel efficiency in vehicles. The shift towards electric vehicles (EVs) has further accelerated demand for aluminum tubes, as manufacturers seek to reduce the weight of battery enclosures and structural components. Driving factors include increasing regulatory pressures for emissions reductions, the need for sustainable materials, and the expansion of infrastructure projects across emerging markets. The aluminum tube segment is well-positioned to benefit from these trends, contributing to the overall growth of the Industrial Tube Market.

  • Asia Pacific Region is Expected to Witness Significant Growth Over the Forecast Period

The Asia-Pacific region is projected to witness significant growth in the Industrial Tube Market over the forecast period, driven by rapid urbanization, industrialization, and increasing infrastructure development. Countries like China, India, and Japan are leading this growth, supported by substantial investments in construction, energy, and automotive sectors. The ongoing expansion of the manufacturing base and a rising middle-class population are fueling demand for various industrial applications. Additionally, government initiatives aimed at enhancing infrastructure and promoting renewable energy sources are creating new opportunities for the industrial tube sector. The growing trend towards lightweight materials in industries such as automotive and aerospace further drives the demand for specialized tubes. With a robust economic outlook, the Asia-Pacific region is poised to become a key player in the global industrial tube market.

Industrial Tube Market Table

To Learn More About This Report - Request a Free Sample Copy

Industrial Tube Market Competitive Landscape

 The competitive landscape of the Industrial Tube Market is characterized by a mix of established players and emerging companies focused on innovation and meeting diverse customer needs. Key manufacturers are investing in advanced manufacturing technologies and sustainable practices to enhance product quality and operational efficiency. The market is driven by increasing demand across sectors such as construction, automotive, and energy, prompting companies to expand their production capacities and diversify their product offerings.

Major competitors in the market include

  • Tenaris
  • Tubacex
  • JFE Steel Corporation
  • Mannesmann Tubes
  • Stainless International
  • Sumitomo Metals
  • Nippon Steel Corporation
  • Tata Steel
  • Valmont Industries.

Recent Development

  • In 2023, Tenaris announced a significant investment to expand its production capacity for seamless steel tubes at its facility in the United States. This development aims to meet the increasing demand from the oil and gas industry, particularly for high-performance products used in drilling and completion applications. The expansion is expected to enhance Tenaris's ability to supply critical components to its customers while reinforcing its position as a leading provider in the Industrial Tube Market.
  • In early 2024, JFE Steel Corporation introduced a new line of high-strength steel tubes designed specifically for the construction and automotive sectors. These tubes are engineered to meet stringent industry standards for safety and durability while also reducing overall weight. This innovation reflects JFE's commitment to sustainability and efficiency, aligning with the industry's shift towards lightweight materials in structural applications. The launch is anticipated to significantly boost JFE's market share in the Industrial Tube Market as demand for advanced materials continues to rise.


Frequently Asked Questions (FAQ) :

Q1. What are the driving factors for the Global Industrial Tube Market?

The Global Industrial Tube Market is primarily driven by the increasing demand for tubes across various end-use industries, including automotive, construction, and manufacturing. The growth in infrastructure development and urbanization globally has led to a surge in demand for steel and plastic tubes for applications such as plumbing, HVAC systems, and structural support. Additionally, advancements in manufacturing technologies, including precision machining and enhanced material properties, are facilitating the production of high-quality tubes that meet industry standards. The rising focus on lightweight materials in the automotive sector, coupled with the growing emphasis on energy efficiency and sustainability, is also propelling market growth. Moreover, the expansion of the oil and gas industry necessitates durable and reliable tubing solutions, further driving demand.

Q2. What are the restraining factors for the Global Industrial Tube Market?

Despite its growth potential, the Global Industrial Tube Market faces several restraining factors. One major challenge is the volatility in raw material prices, particularly for metals like steel and aluminum, which can impact production costs and profit margins. Additionally, the market is sensitive to economic fluctuations, and any downturn in manufacturing or construction activities can lead to reduced demand for industrial tubes. Stringent environmental regulations regarding emissions and waste disposal can also increase operational costs for manufacturers. Moreover, competition from alternative materials, such as composites and polymers, may limit the growth of traditional metal tube applications. Lastly, the global supply chain disruptions, exacerbated by events like the COVID-19 pandemic, can affect availability and pricing of raw materials.

Q3. Which segment is projected to hold the largest share in the Market?

The steel tube segment is projected to hold the largest share in the Global Industrial Tube Market. Steel tubes are widely used across various industries due to their strength, durability, and resistance to corrosion, making them suitable for applications in construction, automotive, and oil and gas sectors. The versatility of steel tubes, combined with their ability to be customized for specific applications, enhances their demand in both structural and mechanical applications. As industries continue to focus on building robust and long-lasting infrastructure, the steel tube segment is expected to maintain its dominant position in the market.

Q4. Which region holds the largest share in the Global Industrial Tube Market?

North America currently holds the largest share in the Global Industrial Tube Market, driven by a well-established manufacturing sector and significant investments in infrastructure development. The region's strong automotive and aerospace industries contribute to the high demand for industrial tubes, particularly steel and aluminum variants. Additionally, ongoing projects in construction and energy sectors further bolster the market. While Europe and Asia-Pacific are also important regions for industrial tube demand, North America's advanced technological capabilities and focus on innovation position it as the leader in this market.

Q5. Which are the prominent players in the Global Industrial Tube Market?

Prominent players in the Global Industrial Tube Market include Tenaris, a leading manufacturer of steel tubes for the energy industry. Tube Supply specializes in providing a wide range of tubing products for various applications. U.S. Steel is known for its extensive portfolio of steel products, including industrial tubes. Tata Steel offers innovative steel solutions for diverse industries. Other significant players include Zekelman Industries, Nucor Corporation, and JFE Steel Corporation, which focus on high-quality tube manufacturing. Additionally, Alcoa Corporation plays a vital role in the aluminum tube segment. These companies are continually investing in technology and innovation to enhance their product offerings and meet the evolving needs of their customers.

1. EXECUTIVE SUMMARY

  • 1.1. Market Overview
  • 1.2. Key Findings
  • 1.3. Market Segmentation
  • 1.4. Competitive Landscape
  • 1.5. Challenges and Opportunities
  • 1.6. Future Outlook

2. MARKET INTRODUCTION

  • 2.1. Definition
  • 2.2. Scope of the study
    • 2.2.1. Research Objective
    • 2.2.2. Assumption
    • 2.2.3. Limitations

3. RESEARCH METHODOLOGY

  • 3.1. Overview
  • 3.2. Data Mining
  • 3.3. Secondary Research
  • 3.4. Primary Research
    • 3.4.1. Primary Interviews and Information Gathering Process
    • 3.4.2. Breakdown of Primary Respondents
  • 3.5. Forecasting Model
  • 3.6. Market Size Estimation
    • 3.6.1. Bottom-Up Approach
    • 3.6.2. Top-Down Approach
  • 3.7. Data Triangulation
  • 3.8. Validation

4. MARKET DYNAMICS

  • 4.1. Overview
  • 4.2. Drivers
  • 4.3. Restraints
  • 4.4. Opportunities

5. MARKET FACTOR ANALYSIS

  • 5.1. Value chain Analysis
  • 5.2. Porter's Five Forces Analysis
    • 5.2.1. Bargaining Power of Suppliers
    • 5.2.2. Bargaining Power of Buyers
    • 5.2.3. Threat of New Entrants
    • 5.2.4. Threat of Substitutes
    • 5.2.5. Intensity of Rivalry
  • 5.3. COVID-19 Impact Analysis
    • 5.3.1. Market Impact Analysis
    • 5.3.2. Regional Impact
    • 5.3.3. Opportunity and Threat Analysis

6. INDUSTRIAL TUBE MARKET, BY TUBE MATERIAL (USD BILLION)

  • 6.1. Steel
  • 6.2. Stainless Steel
  • 6.3. Copper
  • 6.4. Aluminum

7. INDUSTRIAL TUBE MARKET, BY TUBE DIAMETER (USD BILLION)

  • 7.1. Less than 1 inch
  • 7.2. 1-2 inches
  • 7.3. 2-4 inches
  • 7.4. 4-6 inches
  • 7.5. Over 6 inches

8. INDUSTRIAL TUBE MARKET, BY WALL THICKNESS (USD BILLION)

  • 8.1. Thin-walled (less than 0.065 inches)
  • 8.2. Standard-walled (0.065-0.188 inches)
  • 8.3. Heavy-walled (over 0.188 inches)

9. INDUSTRIAL TUBE MARKET, BY APPLICATION (USD BILLION)

  • 9.1. Process piping
  • 9.2. Structural support
  • 9.3. Conveying fluids
  • 9.4. Boilers and heat exchangers

10. INDUSTRIAL TUBE MARKET, BY END-USER INDUSTRY (USD BILLION)

  • 10.1. Automotive
  • 10.2. Construction
  • 10.3. Oil and gas
  • 10.4. Chemicals
  • 10.5. Power generation

11. INDUSTRIAL TUBE MARKET, BY REGIONAL (USD BILLION)

  • 11.1. North America
    • 11.1.1. US
    • 11.1.2. Canada
  • 11.2. Europe
    • 11.2.1. Germany
    • 11.2.2. UK
    • 11.2.3. France
    • 11.2.4. Russia
    • 11.2.5. Italy
    • 11.2.6. Spain
    • 11.2.7. Rest of Europe
  • 11.3. APAC
    • 11.3.1. China
    • 11.3.2. India
    • 11.3.3. Japan
    • 11.3.4. South Korea
    • 11.3.5. Malaysia
    • 11.3.6. Thailand
    • 11.3.7. Indonesia
    • 11.3.8. Rest of APAC
  • 11.4. South America
    • 11.4.1. Brazil
    • 11.4.2. Mexico
    • 11.4.3. Argentina
    • 11.4.4. Rest of South America
  • 11.5. MEA
    • 11.5.1. GCC Countries
    • 11.5.2. South Africa
    • 11.5.3. Rest of MEA

12. COMPETITIVE LANDSCAPE

  • 12.1. Overview
  • 12.2. Competitive Analysis
  • 12.3. Market share Analysis
  • 12.4. Major Growth Strategy in the Industrial Tube Market
  • 12.5. Competitive Benchmarking
  • 12.6. Leading Players in Terms of Number of Developments in the Industrial Tube Market
  • 12.7. Key developments and growth strategies
    • 12.7.1. New Product Launch/Service Deployment
    • 12.7.2. Merger & Acquisitions
    • 12.7.3. Joint Ventures
  • 12.8. Major Players Financial Matrix
    • 12.8.1. Sales and Operating Income
    • 12.8.2. Major Players R&D Expenditure. 2023

13. COMPANY PROFILES

  • 13.1. Nippon Steel Sumitomo Metal Corporation
    • 13.1.1. Financial Overview
    • 13.1.2. Products Offered
    • 13.1.3. Key Developments
    • 13.1.4. SWOT Analysis
    • 13.1.5. Key Strategies
  • 13.2. JFE Steel
    • 13.2.1. Financial Overview
    • 13.2.2. Products Offered
    • 13.2.3. Key Developments
    • 13.2.4. SWOT Analysis
    • 13.2.5. Key Strategies
  • 13.3. Sumitomo Metal Industries
    • 13.3.1. Financial Overview
    • 13.3.2. Products Offered
    • 13.3.3. Key Developments
    • 13.3.4. SWOT Analysis
    • 13.3.5. Key Strategies
  • 13.4. Severstal
    • 13.4.1. Financial Overview
    • 13.4.2. Products Offered
    • 13.4.3. Key Developments
    • 13.4.4. SWOT Analysis
    • 13.4.5. Key Strategies
  • 13.5. POSCO
    • 13.5.1. Financial Overview
    • 13.5.2. Products Offered
    • 13.5.3. Key Developments
    • 13.5.4. SWOT Analysis
    • 13.5.5. Key Strategies
  • 13.6. BaoSteel
    • 13.6.1. Financial Overview
    • 13.6.2. Products Offered
    • 13.6.3. Key Developments
    • 13.6.4. SWOT Analysis
    • 13.6.5. Key Strategies
  • 13.7. ArcelorMittal
    • 13.7.1. Financial Overview
    • 13.7.2. Products Offered
    • 13.7.3. Key Developments
    • 13.7.4. SWOT Analysis
    • 13.7.5. Key Strategies
  • 13.8. Hyundai Steel
    • 13.8.1. Financial Overview
    • 13.8.2. Products Offered
    • 13.8.3. Key Developments
    • 13.8.4. SWOT Analysis
    • 13.8.5. Key Strategies
  • 13.9. Vallourec
    • 13.9.1. Financial Overview
    • 13.9.2. Products Offered
    • 13.9.3. Key Developments
    • 13.9.4. SWOT Analysis
    • 13.9.5. Key Strategies
  • 13.10. NLMK
    • 13.10.1. Financial Overview
    • 13.10.2. Products Offered
    • 13.10.3. Key Developments
    • 13.10.4. SWOT Analysis
    • 13.10.5. Key Strategies
  • 13.11. Jindal Steel Power
    • 13.11.1. Financial Overview
    • 13.11.2. Products Offered
    • 13.11.3. Key Developments
    • 13.11.4. SWOT Analysis
    • 13.11.5. Key Strategies
  • 13.12. Tata Steel
    • 13.12.1. Financial Overview
    • 13.12.2. Products Offered
    • 13.12.3. Key Developments
    • 13.12.4. SWOT Analysis
    • 13.12.5. Key Strategies
  • 13.13. Salzgitter AG
    • 13.13.1. Financial Overview
    • 13.13.2. Products Offered
    • 13.13.3. Key Developments
    • 13.13.4. SWOT Analysis
    • 13.13.5. Key Strategies
  • 13.14. Tenaris
    • 13.14.1. Financial Overview
    • 13.14.2. Products Offered
    • 13.14.3. Key Developments
    • 13.14.4. SWOT Analysis
    • 13.14.5. Key Strategies

14. APPENDIX

  • 14.1. References
FIGURE 1. MARKET SYNOPSIS
FIGURE 2. NORTH AMERICA INDUSTRIAL TUBE MARKET ANALYSIS
FIGURE 3. US INDUSTRIAL TUBE MARKET ANALYSIS BY TUBE MATERIAL
FIGURE 4. US INDUSTRIAL TUBE MARKET ANALYSIS BY TUBE DIAMETER
FIGURE 5. US INDUSTRIAL TUBE MARKET ANALYSIS BY WALL THICKNESS
FIGURE 6. US INDUSTRIAL TUBE MARKET ANALYSIS BY APPLICATION
FIGURE 7. US INDUSTRIAL TUBE MARKET ANALYSIS BY END-USER INDUSTRY
FIGURE 8. US INDUSTRIAL TUBE MARKET ANALYSIS BY REGIONAL
FIGURE 9. CANADA INDUSTRIAL TUBE MARKET ANALYSIS BY TUBE MATERIAL
FIGURE 10. CANADA INDUSTRIAL TUBE MARKET ANALYSIS BY TUBE DIAMETER
FIGURE 11. CANADA INDUSTRIAL TUBE MARKET ANALYSIS BY WALL THICKNESS
FIGURE 12. CANADA INDUSTRIAL TUBE MARKET ANALYSIS BY APPLICATION
FIGURE 13. CANADA INDUSTRIAL TUBE MARKET ANALYSIS BY END-USER INDUSTRY
FIGURE 14. CANADA INDUSTRIAL TUBE MARKET ANALYSIS BY REGIONAL
FIGURE 15. EUROPE INDUSTRIAL TUBE MARKET ANALYSIS
FIGURE 16. GERMANY INDUSTRIAL TUBE MARKET ANALYSIS BY TUBE MATERIAL
FIGURE 17. GERMANY INDUSTRIAL TUBE MARKET ANALYSIS BY TUBE DIAMETER
FIGURE 18. GERMANY INDUSTRIAL TUBE MARKET ANALYSIS BY WALL THICKNESS
FIGURE 19. GERMANY INDUSTRIAL TUBE MARKET ANALYSIS BY APPLICATION
FIGURE 20. GERMANY INDUSTRIAL TUBE MARKET ANALYSIS BY END-USER INDUSTRY
FIGURE 21. GERMANY INDUSTRIAL TUBE MARKET ANALYSIS BY REGIONAL
FIGURE 22. UK INDUSTRIAL TUBE MARKET ANALYSIS BY TUBE MATERIAL
FIGURE 23. UK INDUSTRIAL TUBE MARKET ANALYSIS BY TUBE DIAMETER
FIGURE 24. UK INDUSTRIAL TUBE MARKET ANALYSIS BY WALL THICKNESS
FIGURE 25. UK INDUSTRIAL TUBE MARKET ANALYSIS BY APPLICATION
FIGURE 26. UK INDUSTRIAL TUBE MARKET ANALYSIS BY END-USER INDUSTRY
FIGURE 27. UK INDUSTRIAL TUBE MARKET ANALYSIS BY REGIONAL
FIGURE 28. FRANCE INDUSTRIAL TUBE MARKET ANALYSIS BY TUBE MATERIAL
FIGURE 29. FRANCE INDUSTRIAL TUBE MARKET ANALYSIS BY TUBE DIAMETER
FIGURE 30. FRANCE INDUSTRIAL TUBE MARKET ANALYSIS BY WALL THICKNESS
FIGURE 31. FRANCE INDUSTRIAL TUBE MARKET ANALYSIS BY APPLICATION
FIGURE 32. FRANCE INDUSTRIAL TUBE MARKET ANALYSIS BY END-USER INDUSTRY
FIGURE 33. FRANCE INDUSTRIAL TUBE MARKET ANALYSIS BY REGIONAL
FIGURE 34. RUSSIA INDUSTRIAL TUBE MARKET ANALYSIS BY TUBE MATERIAL
FIGURE 35. RUSSIA INDUSTRIAL TUBE MARKET ANALYSIS BY TUBE DIAMETER
FIGURE 36. RUSSIA INDUSTRIAL TUBE MARKET ANALYSIS BY WALL THICKNESS
FIGURE 37. RUSSIA INDUSTRIAL TUBE MARKET ANALYSIS BY APPLICATION
FIGURE 38. RUSSIA INDUSTRIAL TUBE MARKET ANALYSIS BY END-USER INDUSTRY
FIGURE 39. RUSSIA INDUSTRIAL TUBE MARKET ANALYSIS BY REGIONAL
FIGURE 40. ITALY INDUSTRIAL TUBE MARKET ANALYSIS BY TUBE MATERIAL
FIGURE 41. ITALY INDUSTRIAL TUBE MARKET ANALYSIS BY TUBE DIAMETER
FIGURE 42. ITALY INDUSTRIAL TUBE MARKET ANALYSIS BY WALL THICKNESS
FIGURE 43. ITALY INDUSTRIAL TUBE MARKET ANALYSIS BY APPLICATION
FIGURE 44. ITALY INDUSTRIAL TUBE MARKET ANALYSIS BY END-USER INDUSTRY
FIGURE 45. ITALY INDUSTRIAL TUBE MARKET ANALYSIS BY REGIONAL
FIGURE 46. SPAIN INDUSTRIAL TUBE MARKET ANALYSIS BY TUBE MATERIAL
FIGURE 47. SPAIN INDUSTRIAL TUBE MARKET ANALYSIS BY TUBE DIAMETER
FIGURE 48. SPAIN INDUSTRIAL TUBE MARKET ANALYSIS BY WALL THICKNESS
FIGURE 49. SPAIN INDUSTRIAL TUBE MARKET ANALYSIS BY APPLICATION
FIGURE 50. SPAIN INDUSTRIAL TUBE MARKET ANALYSIS BY END-USER INDUSTRY
FIGURE 51. SPAIN INDUSTRIAL TUBE MARKET ANALYSIS BY REGIONAL
FIGURE 52. REST OF EUROPE INDUSTRIAL TUBE MARKET ANALYSIS BY TUBE MATERIAL
FIGURE 53. REST OF EUROPE INDUSTRIAL TUBE MARKET ANALYSIS BY TUBE DIAMETER
FIGURE 54. REST OF EUROPE INDUSTRIAL TUBE MARKET ANALYSIS BY WALL THICKNESS
FIGURE 55. REST OF EUROPE INDUSTRIAL TUBE MARKET ANALYSIS BY APPLICATION
FIGURE 56. REST OF EUROPE INDUSTRIAL TUBE MARKET ANALYSIS BY END-USER INDUSTRY
FIGURE 57. REST OF EUROPE INDUSTRIAL TUBE MARKET ANALYSIS BY REGIONAL
FIGURE 58. APAC INDUSTRIAL TUBE MARKET ANALYSIS
FIGURE 59. CHINA INDUSTRIAL TUBE MARKET ANALYSIS BY TUBE MATERIAL
FIGURE 60. CHINA INDUSTRIAL TUBE MARKET ANALYSIS BY TUBE DIAMETER
FIGURE 61. CHINA INDUSTRIAL TUBE MARKET ANALYSIS BY WALL THICKNESS
FIGURE 62. CHINA INDUSTRIAL TUBE MARKET ANALYSIS BY APPLICATION
FIGURE 63. CHINA INDUSTRIAL TUBE MARKET ANALYSIS BY END-USER INDUSTRY
FIGURE 64. CHINA INDUSTRIAL TUBE MARKET ANALYSIS BY REGIONAL
FIGURE 65. INDIA INDUSTRIAL TUBE MARKET ANALYSIS BY TUBE MATERIAL
FIGURE 66. INDIA INDUSTRIAL TUBE MARKET ANALYSIS BY TUBE DIAMETER
FIGURE 67. INDIA INDUSTRIAL TUBE MARKET ANALYSIS BY WALL THICKNESS
FIGURE 68. INDIA INDUSTRIAL TUBE MARKET ANALYSIS BY APPLICATION
FIGURE 69. INDIA INDUSTRIAL TUBE MARKET ANALYSIS BY END-USER INDUSTRY
FIGURE 70. INDIA INDUSTRIAL TUBE MARKET ANALYSIS BY REGIONAL
FIGURE 71. JAPAN INDUSTRIAL TUBE MARKET ANALYSIS BY TUBE MATERIAL
FIGURE 72. JAPAN INDUSTRIAL TUBE MARKET ANALYSIS BY TUBE DIAMETER
FIGURE 73. JAPAN INDUSTRIAL TUBE MARKET ANALYSIS BY WALL THICKNESS
FIGURE 74. JAPAN INDUSTRIAL TUBE MARKET ANALYSIS BY APPLICATION
FIGURE 75. JAPAN INDUSTRIAL TUBE MARKET ANALYSIS BY END-USER INDUSTRY
FIGURE 76. JAPAN INDUSTRIAL TUBE MARKET ANALYSIS BY REGIONAL
FIGURE 77. SOUTH KOREA INDUSTRIAL TUBE MARKET ANALYSIS BY TUBE MATERIAL
FIGURE 78. SOUTH KOREA INDUSTRIAL TUBE MARKET ANALYSIS BY TUBE DIAMETER
FIGURE 79. SOUTH KOREA INDUSTRIAL TUBE MARKET ANALYSIS BY WALL THICKNESS
FIGURE 80. SOUTH KOREA INDUSTRIAL TUBE MARKET ANALYSIS BY APPLICATION
FIGURE 81. SOUTH KOREA INDUSTRIAL TUBE MARKET ANALYSIS BY END-USER INDUSTRY
FIGURE 82. SOUTH KOREA INDUSTRIAL TUBE MARKET ANALYSIS BY REGIONAL
FIGURE 83. MALAYSIA INDUSTRIAL TUBE MARKET ANALYSIS BY TUBE MATERIAL
FIGURE 84. MALAYSIA INDUSTRIAL TUBE MARKET ANALYSIS BY TUBE DIAMETER
FIGURE 85. MALAYSIA INDUSTRIAL TUBE MARKET ANALYSIS BY WALL THICKNESS
FIGURE 86. MALAYSIA INDUSTRIAL TUBE MARKET ANALYSIS BY APPLICATION
FIGURE 87. MALAYSIA INDUSTRIAL TUBE MARKET ANALYSIS BY END-USER INDUSTRY
FIGURE 88. MALAYSIA INDUSTRIAL TUBE MARKET ANALYSIS BY REGIONAL
FIGURE 89. THAILAND INDUSTRIAL TUBE MARKET ANALYSIS BY TUBE MATERIAL
FIGURE 90. THAILAND INDUSTRIAL TUBE MARKET ANALYSIS BY TUBE DIAMETER
FIGURE 91. THAILAND INDUSTRIAL TUBE MARKET ANALYSIS BY WALL THICKNESS
FIGURE 92. THAILAND INDUSTRIAL TUBE MARKET ANALYSIS BY APPLICATION
FIGURE 93. THAILAND INDUSTRIAL TUBE MARKET ANALYSIS BY END-USER INDUSTRY
FIGURE 94. THAILAND INDUSTRIAL TUBE MARKET ANALYSIS BY REGIONAL
FIGURE 95. INDONESIA INDUSTRIAL TUBE MARKET ANALYSIS BY TUBE MATERIAL
FIGURE 96. INDONESIA INDUSTRIAL TUBE MARKET ANALYSIS BY TUBE DIAMETER
FIGURE 97. INDONESIA INDUSTRIAL TUBE MARKET ANALYSIS BY WALL THICKNESS
FIGURE 98. INDONESIA INDUSTRIAL TUBE MARKET ANALYSIS BY APPLICATION
FIGURE 99. INDONESIA INDUSTRIAL TUBE MARKET ANALYSIS BY END-USER INDUSTRY
FIGURE 100. INDONESIA INDUSTRIAL TUBE MARKET ANALYSIS BY REGIONAL
FIGURE 101. REST OF APAC INDUSTRIAL TUBE MARKET ANALYSIS BY TUBE MATERIAL
FIGURE 102. REST OF APAC INDUSTRIAL TUBE MARKET ANALYSIS BY TUBE DIAMETER
FIGURE 103. REST OF APAC INDUSTRIAL TUBE MARKET ANALYSIS BY WALL THICKNESS
FIGURE 104. REST OF APAC INDUSTRIAL TUBE MARKET ANALYSIS BY APPLICATION
FIGURE 105. REST OF APAC INDUSTRIAL TUBE MARKET ANALYSIS BY END-USER INDUSTRY
FIGURE 106. REST OF APAC INDUSTRIAL TUBE MARKET ANALYSIS BY REGIONAL
FIGURE 107. SOUTH AMERICA INDUSTRIAL TUBE MARKET ANALYSIS
FIGURE 108. BRAZIL INDUSTRIAL TUBE MARKET ANALYSIS BY TUBE MATERIAL
FIGURE 109. BRAZIL INDUSTRIAL TUBE MARKET ANALYSIS BY TUBE DIAMETER
FIGURE 110. BRAZIL INDUSTRIAL TUBE MARKET ANALYSIS BY WALL THICKNESS
FIGURE 111. BRAZIL INDUSTRIAL TUBE MARKET ANALYSIS BY APPLICATION
FIGURE 112. BRAZIL INDUSTRIAL TUBE MARKET ANALYSIS BY END-USER INDUSTRY
FIGURE 113. BRAZIL INDUSTRIAL TUBE MARKET ANALYSIS BY REGIONAL
FIGURE 114. MEXICO INDUSTRIAL TUBE MARKET ANALYSIS BY TUBE MATERIAL
FIGURE 115. MEXICO INDUSTRIAL TUBE MARKET ANALYSIS BY TUBE DIAMETER
FIGURE 116. MEXICO INDUSTRIAL TUBE MARKET ANALYSIS BY WALL THICKNESS
FIGURE 117. MEXICO INDUSTRIAL TUBE MARKET ANALYSIS BY APPLICATION
FIGURE 118. MEXICO INDUSTRIAL TUBE MARKET ANALYSIS BY END-USER INDUSTRY
FIGURE 119. MEXICO INDUSTRIAL TUBE MARKET ANALYSIS BY REGIONAL
FIGURE 120. ARGENTINA INDUSTRIAL TUBE MARKET ANALYSIS BY TUBE MATERIAL
FIGURE 121. ARGENTINA INDUSTRIAL TUBE MARKET ANALYSIS BY TUBE DIAMETER
FIGURE 122. ARGENTINA INDUSTRIAL TUBE MARKET ANALYSIS BY WALL THICKNESS
FIGURE 123. ARGENTINA INDUSTRIAL TUBE MARKET ANALYSIS BY APPLICATION
FIGURE 124. ARGENTINA INDUSTRIAL TUBE MARKET ANALYSIS BY END-USER INDUSTRY
FIGURE 125. ARGENTINA INDUSTRIAL TUBE MARKET ANALYSIS BY REGIONAL
FIGURE 126. REST OF SOUTH AMERICA INDUSTRIAL TUBE MARKET ANALYSIS BY TUBE MATERIAL
FIGURE 127. REST OF SOUTH AMERICA INDUSTRIAL TUBE MARKET ANALYSIS BY TUBE DIAMETER
FIGURE 128. REST OF SOUTH AMERICA INDUSTRIAL TUBE MARKET ANALYSIS BY WALL THICKNESS
FIGURE 129. REST OF SOUTH AMERICA INDUSTRIAL TUBE MARKET ANALYSIS BY APPLICATION
FIGURE 130. REST OF SOUTH AMERICA INDUSTRIAL TUBE MARKET ANALYSIS BY END-USER INDUSTRY
FIGURE 131. REST OF SOUTH AMERICA INDUSTRIAL TUBE MARKET ANALYSIS BY REGIONAL
FIGURE 132. MEA INDUSTRIAL TUBE MARKET ANALYSIS
FIGURE 133. GCC COUNTRIES INDUSTRIAL TUBE MARKET ANALYSIS BY TUBE MATERIAL
FIGURE 134. GCC COUNTRIES INDUSTRIAL TUBE MARKET ANALYSIS BY TUBE DIAMETER
FIGURE 135. GCC COUNTRIES INDUSTRIAL TUBE MARKET ANALYSIS BY WALL THICKNESS
FIGURE 136. GCC COUNTRIES INDUSTRIAL TUBE MARKET ANALYSIS BY APPLICATION
FIGURE 137. GCC COUNTRIES INDUSTRIAL TUBE MARKET ANALYSIS BY END-USER INDUSTRY
FIGURE 138. GCC COUNTRIES INDUSTRIAL TUBE MARKET ANALYSIS BY REGIONAL
FIGURE 139. SOUTH AFRICA INDUSTRIAL TUBE MARKET ANALYSIS BY TUBE MATERIAL
FIGURE 140. SOUTH AFRICA INDUSTRIAL TUBE MARKET ANALYSIS BY TUBE DIAMETER
FIGURE 141. SOUTH AFRICA INDUSTRIAL TUBE MARKET ANALYSIS BY WALL THICKNESS
FIGURE 142. SOUTH AFRICA INDUSTRIAL TUBE MARKET ANALYSIS BY APPLICATION
FIGURE 143. SOUTH AFRICA INDUSTRIAL TUBE MARKET ANALYSIS BY END-USER INDUSTRY
FIGURE 144. SOUTH AFRICA INDUSTRIAL TUBE MARKET ANALYSIS BY REGIONAL
FIGURE 145. REST OF MEA INDUSTRIAL TUBE MARKET ANALYSIS BY TUBE MATERIAL
FIGURE 146. REST OF MEA INDUSTRIAL TUBE MARKET ANALYSIS BY TUBE DIAMETER
FIGURE 147. REST OF MEA INDUSTRIAL TUBE MARKET ANALYSIS BY WALL THICKNESS
FIGURE 148. REST OF MEA INDUSTRIAL TUBE MARKET ANALYSIS BY APPLICATION
FIGURE 149. REST OF MEA INDUSTRIAL TUBE MARKET ANALYSIS BY END-USER INDUSTRY
FIGURE 150. REST OF MEA INDUSTRIAL TUBE MARKET ANALYSIS BY REGIONAL
FIGURE 151. KEY BUYING CRITERIA OF INDUSTRIAL TUBE MARKET
FIGURE 152. RESEARCH PROCESS OF MRFR
FIGURE 153. DRO ANALYSIS OF INDUSTRIAL TUBE MARKET
FIGURE 154. DRIVERS IMPACT ANALYSIS: INDUSTRIAL TUBE MARKET
FIGURE 155. RESTRAINTS IMPACT ANALYSIS: INDUSTRIAL TUBE MARKET
FIGURE 156. SUPPLY / VALUE CHAIN: INDUSTRIAL TUBE MARKET
FIGURE 157. INDUSTRIAL TUBE MARKET, BY TUBE MATERIAL, 2024 (% SHARE)
FIGURE 158. INDUSTRIAL TUBE MARKET, BY TUBE MATERIAL, 2019 TO 2032 (USD Billions)
FIGURE 159. INDUSTRIAL TUBE MARKET, BY TUBE DIAMETER, 2024 (% SHARE)
FIGURE 160. INDUSTRIAL TUBE MARKET, BY TUBE DIAMETER, 2019 TO 2032 (USD Billions)
FIGURE 161. INDUSTRIAL TUBE MARKET, BY WALL THICKNESS, 2024 (% SHARE)
FIGURE 162. INDUSTRIAL TUBE MARKET, BY WALL THICKNESS, 2019 TO 2032 (USD Billions)
FIGURE 163. INDUSTRIAL TUBE MARKET, BY APPLICATION, 2024 (% SHARE)
FIGURE 164. INDUSTRIAL TUBE MARKET, BY APPLICATION, 2019 TO 2032 (USD Billions)
FIGURE 165. INDUSTRIAL TUBE MARKET, BY END-USER INDUSTRY, 2024 (% SHARE)
FIGURE 166. INDUSTRIAL TUBE MARKET, BY END-USER INDUSTRY, 2019 TO 2032 (USD Billions)
FIGURE 167. INDUSTRIAL TUBE MARKET, BY REGIONAL, 2024 (% SHARE)
FIGURE 168. INDUSTRIAL TUBE MARKET, BY REGIONAL, 2019 TO 2032 (USD Billions)
FIGURE 169. BENCHMARKING OF MAJOR COMPETITORS
Research Process

Data Library Research are conducted by industry experts who offer insight on industry structure, market segmentations technology assessment and competitive landscape (CL), and penetration, as well as on emerging trends. Their analysis is based on primary interviews (~ 80%) and secondary research (~ 20%) as well as years of professional expertise in their respective industries. Adding to this, by analysing historical trends and current market positions, our analysts predict where the market will be headed for the next five years. Furthermore, the varying trends of segment & categories geographically presented are also studied and the estimated based on the primary & secondary research.

In this particular report from the supply side Data Library Research has conducted primary surveys (interviews) with the key level executives (VP, CEO’s, Marketing Director, Business Development Manager and SOFT) of the companies that active & prominent as well as the midsized organization

FIGURE 1: DLR RESEARH PROCESS

research-methodology1

Primary Research

Extensive primary research was conducted to gain a deeper insight of the market and industry performance. The analysis is based on both primary and secondary research as well as years of professional expertise in the respective industries.

In addition to analysing current and historical trends, our analysts predict where the market is headed over the next five years.

It varies by segment for these categories geographically presented in the list of market tables. Speaking about this particular report we have conducted primary surveys (interviews) with the key level executives (VP, CEO’s, Marketing Director, Business Development Manager and many more) of the major players active in the market.

Secondary Research

Secondary research was mainly used to collect and identify information useful for the extensive, technical, market-oriented, and Friend’s study of the Global Extra Neutral Alcohol. It was also used to obtain key information about major players, market classification and segmentation according to the industry trends, geographical markets, and developments related to the market and technology perspectives. For this study, analysts have gathered information from various credible sources, such as annual reports, sec filings, journals, white papers, SOFT presentations, and company web sites.

Market Size Estimation

Both, top-down and bottom-up approaches were used to estimate and validate the size of the Global market and to estimate the size of various other dependent submarkets in the overall Extra Neutral Alcohol. The key players in the market were identified through secondary research and their market contributions in the respective geographies were determined through primary and secondary research.

Forecast Model

research-methodology2

Happy to Assist You

If you have a question?

[email protected]

IND : +91 955 279 0357

Browse Related Reports