Automotive Adaptive Lighting Market Overview
The global Automotive Adaptive Lighting Market is projected to rise at a significant rate in the coming years. Because of the growing desire for environmental concerns and greater safety, lighting has become a highly essential aspect of the automotive industry. With the advancement of technology in the automobile industry, the employment of gas discharge-based light sources has given way to light-emitting diodes. The most frequent form of light source employed in the adaptive lighting market is laser technology. The expansion of the vehicle adaptive lighting industry has been propelled by the drop in LED prices and the advancement of technology. The decrease in the price of LED has resulted in a rise in the use of adaptive lighting in high-end luxury vehicles.
The automobile industry is fully reliant on the market for automotive adaptable lighting. As a result, changes in the automobile industry's demand have a direct impact on the market. The sales of new vehicles have been steadily increasing over the last few years. As a result, there has been an increase in demand for automotive adaptive lighting. The growth in new vehicle sales is primarily due to the competitive and numerous financing alternatives available. The availability of financing has made vehicle purchases easier, increasing the use of automotive lighting. Another factor contributing to the rise in vehicle sales is global macroeconomic development and the rise of the global middle class.
On the other hand, the factor that is impeding the market is the higher cost of automotive adaptive lightings and underdeveloped aftermarket services for automotive adaptive lighting.
| Report Metric |
Details |
| Market size available for years |
2023–2030 |
| Base year considered |
2023 |
| Forecast period |
2024–2030 |
| Forecast unit |
Value (USD Million) |
| Segments covered |
Technology, Vehicle Type, End Market, and Region. |
| Regions covered |
North America (the U.S. and Canada), Europe (UK, Germany, France, Italy, Spain, Russia, Rest of Europe), Asia-Pacific (China, India, Japan, Australia, South East Asia, Rest of Asia Pacific), Latin America and the Middle East and Africa (Brazil, Saudi Arabia, UAE, Rest of LAMEA) |
| Companies covered |
HELLA KGaA Hueck & Co., Koito Manufacturing Co., Ltd, Magneti Marelli, Stanley Electric, North American Lighting, Varroc Lighting Systems, Zizala Lichtsysteme GmbH, OSRAM Licht AG, Valeo Group, SL Corporation. |
Covid-19 Impact on Automotive Adaptive Lighting Market
The outbreak of the covid-19 has a severe and swift impact on the automobile and transportation industry. This is majorly due to the shutdown of assembly plants in the US, interruptions across Europe in large-scale manufacturing, and disruption in the export of Chinese parts. In addition to this, the industry is dealing with reduced demand across the globe due to changes in customer behavior and shifts in a supply-demand chain. A recent study shows a 39% decline in sales of automotive all over the world. Moreover, the nationwide lockdowns have substantially affected the transportation sector. Restrictions on transportation accounted for a 45 to 55% decline in public as well as private transport sectors.
Automotive Adaptive Lighting Market Segment Overview
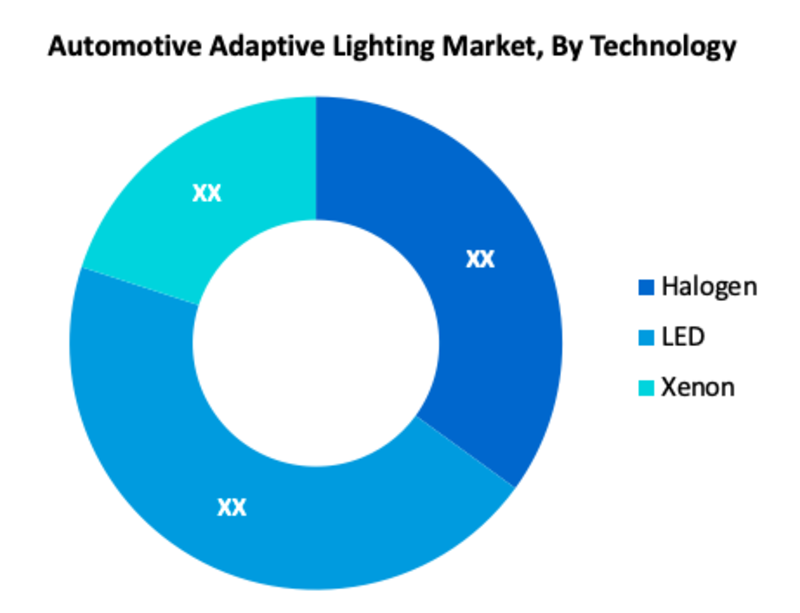
Based on Technology, the LED segment is anticipated to dominate the global adaptive lighting market owing to the decreasing cost, easy availability, and longer life. Moreover, Passenger vehicles accounted for the major market share for the global automotive adaptive lighting market. The growing demand for passenger car among a large pool of population, the development of global auto-manufacturers into new emerging markets acts as a key factor for the growth of this segment.
Automotive Adaptive Lighting Market, By Technology
· Halogen
· LED
· Xenon
Automotive Adaptive Lighting Market, By Vehicle Type
· Passenger vehicle
· Commercial vehicle
Automotive Adaptive Lighting Market, By End Market
· OEMs
· Aftermarket
Automotive Adaptive Lighting Regional Overview
In terms of geography, the global Automotive Adaptive Lighting market is classified into North America, South America, Europe, Asia Pacific, and Middle East & Africa. Europe, Asia-Pacific, and North America are the regions with the greatest markets for automotive adaptive lighting. Increased sales of new vehicles, increased attention on R&D for automotive lighting, faster urbanization leading to expansion of the automobile sector, and others are among the major reasons driving the automotive adaptive lighting market. The automotive adaptive lightings market is predicted to grow thanks to technical developments and rising passenger vehicle demand in these regions.
Automotive Adaptive Lighting Market, By Geography
· North America (US & Canada)
· Europe (UK, Germany, France, Italy, Spain, Russia & Rest of Europe)
· Asia-Pacific (Japan, China, India, Australia, & South Korea, & Rest of Asia-Pacific)
· LAMEA (Brazil, Saudi Arabia, UAE & Rest of LAMEA)
Automotive Adaptive Lighting Market, Key Players
· HELLA KGaA Hueck & Co.
· Koito Manufacturing Co., Ltd
· Magneti Marelli
· Stanley Electric
· North American Lighting
· Varroc Lighting Systems
· Zizala Lichtsysteme GmbH
· OSRAM Licht AG,
· Valeo Group
· SL Corporation
Frequently Asked Questions (FAQ) :
Q1. What are the driving factors for the global Automotive Adaptive Lighting market?
Because of the growing desire for environmental concerns and greater safety, lighting has become a highly essential aspect of the automotive industry. This key reason driving the growth of the Automotive Adaptive Lighting market.
Q2. What are the restraining factors for the global Automotive Adaptive Lighting market?
Factor that is impeding the market is the higher cost of automotive adaptive lightings and underdeveloped aftermarket services for automotive adaptive lighting.
Q3. Which segment is projected to hold the largest share in the global Automotive Adaptive Lighting market?
LED segment is projected to hold the largest share in the global Automotive Adaptive Lighting market.
Q4. Which region holds the largest share in the global Automotive Adaptive Lighting market?
North America holds the largest share in the global Automotive Adaptive Lighting market.
Q5. Which are the prominent players in the global Automotive Adaptive Lighting market?
HELLA KGaA Hueck & Co., Koito Manufacturing Co., Ltd, Magneti Marelli, Stanley Electric, North American Lighting, Varroc Lighting Systems, Zizala Lichtsysteme GmbH, OSRAM Licht AG, Valeo Group, SL Corporation. are some key players in the global Automotive Adaptive Lighting market.
List of Figures
Figure 1: Global Automotive Adaptive Lighting Market Revenue Breakdown (USD Billion, %) by Region, 2019 & 2027
Figure 2: Global Automotive Adaptive Lighting Market Value Share (%), By Segment 1, 2019 & 2027
Figure 3: Global Automotive Adaptive Lighting Market Forecast (USD Billion), by Sub-Segment 1, 2016-2027
Figure 4: Global Automotive Adaptive Lighting Market Forecast (USD Billion), by Sub-Segment 2, 2016-2027
Figure 5: Global Automotive Adaptive Lighting Market Value Share (%), By Segment 2, 2019 & 2027
Figure 6: Global Automotive Adaptive Lighting Market Forecast (USD Billion), by Sub-Segment 1, 2016-2027
Figure 7: Global Automotive Adaptive Lighting Market Forecast (USD Billion), by Sub-Segment 2, 2016-2027
Figure 8: Global Automotive Adaptive Lighting Market Forecast (USD Billion), by Sub-Segment 3, 2016-2027
Figure 9: Global Automotive Adaptive Lighting Market Forecast (USD Billion), by Others, 2016-2027
Figure 10: Global Automotive Adaptive Lighting Market Value Share (%), By Segment 3, 2019 & 2027
Figure 11: Global Automotive Adaptive Lighting Market Forecast (USD Billion), by Sub-Segment 1, 2016-2027
Figure 12: Global Automotive Adaptive Lighting Market Forecast (USD Billion), by Sub-Segment 2, 2016-2027
Figure 13: Global Automotive Adaptive Lighting Market Forecast (USD Billion), by Sub-Segment 3, 2016-2027
Figure 14: Global Automotive Adaptive Lighting Market Forecast (USD Billion), by Others, 2016-2027
Figure 15: Global Automotive Adaptive Lighting Market Value (USD Billion), by Region, 2019 & 2027
Figure 16: North America Automotive Adaptive Lighting Market Value Share (%), By Segment 1, 2019 & 2027
Figure 17: North America Automotive Adaptive Lighting Market Forecast (USD Billion), by Sub-Segment 1, 2016-2027
Figure 18: North America Automotive Adaptive Lighting Market Forecast (USD Billion), by Sub-Segment 2, 2016-2027
Figure 19: North America Automotive Adaptive Lighting Market Value Share (%), By Segment 2, 2019 & 2027
Figure 20: North America Automotive Adaptive Lighting Market Forecast (USD Billion), by Sub-Segment 1, 2016-2027
Figure 21: North America Automotive Adaptive Lighting Market Forecast (USD Billion), by Sub-Segment 2, 2016-2027
Figure 22: North America Automotive Adaptive Lighting Market Forecast (USD Billion), by Sub-Segment 3, 2016-2027
Figure 23: North America Automotive Adaptive Lighting Market Forecast (USD Billion), by Others, 2016-2027
Figure 24: North America Automotive Adaptive Lighting Market Value Share (%), By Segment 3, 2019 & 2027
Figure 25: North America Automotive Adaptive Lighting Market Forecast (USD Billion), by Sub-Segment 1, 2016-2027
Figure 26: North America Automotive Adaptive Lighting Market Forecast (USD Billion), by Sub-Segment 2, 2016-2027
Figure 27: North America Automotive Adaptive Lighting Market Forecast (USD Billion), by Sub-Segment 3, 2016-2027
Figure 28: North America Automotive Adaptive Lighting Market Forecast (USD Billion), by Others, 2016-2027
Figure 29: North America Automotive Adaptive Lighting Market Forecast (USD Billion), by U.S., 2016-2027
Figure 30: North America Automotive Adaptive Lighting Market Forecast (USD Billion), by Canada, 2016-2027
Figure 31: Latin America Automotive Adaptive Lighting Market Value Share (%), By Segment 1, 2019 & 2027
Figure 32: Latin America Automotive Adaptive Lighting Market Forecast (USD Billion), by Sub-Segment 1, 2016-2027
Figure 33: Latin America Automotive Adaptive Lighting Market Forecast (USD Billion), by Sub-Segment 2, 2016-2027
Figure 34: Latin America Automotive Adaptive Lighting Market Value Share (%), By Segment 2, 2019 & 2027
Figure 35: Latin America Automotive Adaptive Lighting Market Forecast (USD Billion), by Sub-Segment 1, 2016-2027
Figure 36: Latin America Automotive Adaptive Lighting Market Forecast (USD Billion), by Sub-Segment 2, 2016-2027
Figure 37: Latin America Automotive Adaptive Lighting Market Forecast (USD Billion), by Sub-Segment 3, 2016-2027
Figure 38: Latin America Automotive Adaptive Lighting Market Forecast (USD Billion), by Others, 2016-2027
Figure 39: Latin America Automotive Adaptive Lighting Market Value Share (%), By Segment 3, 2019 & 2027
Figure 40: Latin America Automotive Adaptive Lighting Market Forecast (USD Billion), by Sub-Segment 1, 2016-2027
Figure 41: Latin America Automotive Adaptive Lighting Market Forecast (USD Billion), by Sub-Segment 2, 2016-2027
Figure 42: Latin America Automotive Adaptive Lighting Market Forecast (USD Billion), by Sub-Segment 3, 2016-2027
Figure 43: Latin America Automotive Adaptive Lighting Market Forecast (USD Billion), by Others, 2016-2027
Figure 44: Latin America Automotive Adaptive Lighting Market Forecast (USD Billion), by Brazil, 2016-2027
Figure 45: Latin America Automotive Adaptive Lighting Market Forecast (USD Billion), by Mexico, 2016-2027
Figure 46: Latin America Automotive Adaptive Lighting Market Forecast (USD Billion), by Rest of Latin America, 2016-2027
Figure 47: Europe Automotive Adaptive Lighting Market Value Share (%), By Segment 1, 2019 & 2027
Figure 48: Europe Automotive Adaptive Lighting Market Forecast (USD Billion), by Sub-Segment 1, 2016-2027
Figure 49: Europe Automotive Adaptive Lighting Market Forecast (USD Billion), by Sub-Segment 2, 2016-2027
Figure 50: Europe Automotive Adaptive Lighting Market Value Share (%), By Segment 2, 2019 & 2027
Figure 51: Europe Automotive Adaptive Lighting Market Forecast (USD Billion), by Sub-Segment 1, 2016-2027
Figure 52: Europe Automotive Adaptive Lighting Market Forecast (USD Billion), by Sub-Segment 2, 2016-2027
Figure 53: Europe Automotive Adaptive Lighting Market Forecast (USD Billion), by Sub-Segment 3, 2016-2027
Figure 54: Europe Automotive Adaptive Lighting Market Forecast (USD Billion), by Others, 2016-2027
Figure 55: Europe Automotive Adaptive Lighting Market Value Share (%), By Segment 3, 2019 & 2027
Figure 56: Europe Automotive Adaptive Lighting Market Forecast (USD Billion), by Sub-Segment 1, 2016-2027
Figure 57: Europe Automotive Adaptive Lighting Market Forecast (USD Billion), by Sub-Segment 2, 2016-2027
Figure 58: Europe Automotive Adaptive Lighting Market Forecast (USD Billion), by Sub-Segment 3, 2016-2027
Figure 59: Europe Automotive Adaptive Lighting Market Forecast (USD Billion), by Others, 2016-2027
Figure 60: Europe Automotive Adaptive Lighting Market Forecast (USD Billion), by U.K., 2016-2027
Figure 61: Europe Automotive Adaptive Lighting Market Forecast (USD Billion), by Germany, 2016-2027
Figure 62: Europe Automotive Adaptive Lighting Market Forecast (USD Billion), by France, 2016-2027
Figure 63: Europe Automotive Adaptive Lighting Market Forecast (USD Billion), by Italy, 2016-2027
Figure 64: Europe Automotive Adaptive Lighting Market Forecast (USD Billion), by Spain, 2016-2027
Figure 65: Europe Automotive Adaptive Lighting Market Forecast (USD Billion), by Russia, 2016-2027
Figure 66: Europe Automotive Adaptive Lighting Market Forecast (USD Billion), by Rest of Europe, 2016-2027
Figure 67: Asia Pacific Automotive Adaptive Lighting Market Value Share (%), By Segment 1, 2019 & 2027
Figure 68: Asia Pacific Automotive Adaptive Lighting Market Forecast (USD Billion), by Sub-Segment 1, 2016-2027
Figure 69: Asia Pacific Automotive Adaptive Lighting Market Forecast (USD Billion), by Sub-Segment 2, 2016-2027
Figure 70: Asia Pacific Automotive Adaptive Lighting Market Value Share (%), By Segment 2, 2019 & 2027
Figure 71: Asia Pacific Automotive Adaptive Lighting Market Forecast (USD Billion), by Sub-Segment 1, 2016-2027
Figure 72: Asia Pacific Automotive Adaptive Lighting Market Forecast (USD Billion), by Sub-Segment 2, 2016-2027
Figure 73: Asia Pacific Automotive Adaptive Lighting Market Forecast (USD Billion), by Sub-Segment 3, 2016-2027
Figure 74: Asia Pacific Automotive Adaptive Lighting Market Forecast (USD Billion), by Others, 2016-2027
Figure 75: Asia Pacific Automotive Adaptive Lighting Market Value Share (%), By Segment 3, 2019 & 2027
Figure 76: Asia Pacific Automotive Adaptive Lighting Market Forecast (USD Billion), by Sub-Segment 1, 2016-2027
Figure 77: Asia Pacific Automotive Adaptive Lighting Market Forecast (USD Billion), by Sub-Segment 2, 2016-2027
Figure 78: Asia Pacific Automotive Adaptive Lighting Market Forecast (USD Billion), by Sub-Segment 3, 2016-2027
Figure 79: Asia Pacific Automotive Adaptive Lighting Market Forecast (USD Billion), by Others, 2016-2027
Figure 80: Asia Pacific Automotive Adaptive Lighting Market Forecast (USD Billion), by China, 2016-2027
Figure 81: Asia Pacific Automotive Adaptive Lighting Market Forecast (USD Billion), by India, 2016-2027
Figure 82: Asia Pacific Automotive Adaptive Lighting Market Forecast (USD Billion), by Japan, 2016-2027
Figure 83: Asia Pacific Automotive Adaptive Lighting Market Forecast (USD Billion), by Australia, 2016-2027
Figure 84: Asia Pacific Automotive Adaptive Lighting Market Forecast (USD Billion), by Southeast Asia, 2016-2027
Figure 85: Asia Pacific Automotive Adaptive Lighting Market Forecast (USD Billion), by Rest of Asia Pacific, 2016-2027
Figure 86: Middle East & Africa Automotive Adaptive Lighting Market Value Share (%), By Segment 1, 2019 & 2027
Figure 87: Middle East & Africa Automotive Adaptive Lighting Market Forecast (USD Billion), by Sub-Segment 1, 2016-2027
Figure 88: Middle East & Africa Automotive Adaptive Lighting Market Forecast (USD Billion), by Sub-Segment 2, 2016-2027
Figure 89: Middle East & Africa Automotive Adaptive Lighting Market Value Share (%), By Segment 2, 2019 & 2027
Figure 90: Middle East & Africa Automotive Adaptive Lighting Market Forecast (USD Billion), by Sub-Segment 1, 2016-2027
Figure 91: Middle East & Africa Automotive Adaptive Lighting Market Forecast (USD Billion), by Sub-Segment 2, 2016-2027
Figure 92: Middle East & Africa Automotive Adaptive Lighting Market Forecast (USD Billion), by Sub-Segment 3, 2016-2027
Figure 93: Middle East & Africa Automotive Adaptive Lighting Market Forecast (USD Billion), by Others, 2016-2027
Figure 94: Middle East & Africa Automotive Adaptive Lighting Market Value Share (%), By Segment 3, 2019 & 2027
Figure 95: Middle East & Africa Automotive Adaptive Lighting Market Forecast (USD Billion), by Sub-Segment 1, 2016-2027
Figure 96: Middle East & Africa Automotive Adaptive Lighting Market Forecast (USD Billion), by Sub-Segment 2, 2016-2027
Figure 97: Middle East & Africa Automotive Adaptive Lighting Market Forecast (USD Billion), by Sub-Segment 3, 2016-2027
Figure 98: Middle East & Africa Automotive Adaptive Lighting Market Forecast (USD Billion), by Others, 2016-2027
Figure 99: Middle East & Africa Automotive Adaptive Lighting Market Forecast (USD Billion), by GCC, 2016-2027
Figure 100: Middle East & Africa Automotive Adaptive Lighting Market Forecast (USD Billion), by South Africa, 2016-2027
Figure 101: Middle East & Africa Automotive Adaptive Lighting Market Forecast (USD Billion), by Rest of Middle East & Africa, 2016-2027
List of Tables
Table 1: Global Automotive Adaptive Lighting Market Revenue (USD Billion) Forecast, by Segment 1, 2016-2027
Table 2: Global Automotive Adaptive Lighting Market Revenue (USD Billion) Forecast, by Segment 2, 2016-2027
Table 3: Global Automotive Adaptive Lighting Market Revenue (USD Billion) Forecast, by Segment 3, 2016-2027
Table 4: Global Automotive Adaptive Lighting Market Revenue (USD Billion) Forecast, by Region, 2016-2027
Table 5: North America Automotive Adaptive Lighting Market Revenue (USD Billion) Forecast, by Segment 1, 2016-2027
Table 6: North America Automotive Adaptive Lighting Market Revenue (USD Billion) Forecast, by Segment 2, 2016-2027
Table 7: North America Automotive Adaptive Lighting Market Revenue (USD Billion) Forecast, by Segment 3, 2016-2027
Table 8: North America Automotive Adaptive Lighting Market Revenue (USD Billion) Forecast, by Country, 2016-2027
Table 9: Europe Automotive Adaptive Lighting Market Revenue (USD Billion) Forecast, by Segment 1, 2016-2027
Table 10: Europe Automotive Adaptive Lighting Market Revenue (USD Billion) Forecast, by Segment 2, 2016-2027
Table 11: Europe Automotive Adaptive Lighting Market Revenue (USD Billion) Forecast, by Segment 3, 2016-2027
Table 12: Europe Automotive Adaptive Lighting Market Revenue (USD Billion) Forecast, by Country, 2016-2027
Table 13: Latin America Automotive Adaptive Lighting Market Revenue (USD Billion) Forecast, by Segment 1, 2016-2027
Table 14: Latin America Automotive Adaptive Lighting Market Revenue (USD Billion) Forecast, by Segment 2, 2016-2027
Table 15: Latin America Automotive Adaptive Lighting Market Revenue (USD Billion) Forecast, by Segment 3, 2016-2027
Table 16: Latin America Automotive Adaptive Lighting Market Revenue (USD Billion) Forecast, by Country, 2016-2027
Table 17: Asia Pacific Automotive Adaptive Lighting Market Revenue (USD Billion) Forecast, by Segment 1, 2016-2027
Table 18: Asia Pacific Automotive Adaptive Lighting Market Revenue (USD Billion) Forecast, by Segment 2, 2016-2027
Table 19: Asia Pacific Automotive Adaptive Lighting Market Revenue (USD Billion) Forecast, by Segment 3, 2016-2027
Table 20: Asia Pacific Automotive Adaptive Lighting Market Revenue (USD Billion) Forecast, by Country, 2016-2027
Table 21: Middle East & Africa Automotive Adaptive Lighting Market Revenue (USD Billion) Forecast, by Segment 1, 2016-2027
Table 22: Middle East & Africa Automotive Adaptive Lighting Market Revenue (USD Billion) Forecast, by Segment 2, 2016-2027
Table 23: Middle East & Africa Automotive Adaptive Lighting Market Revenue (USD Billion) Forecast, by Segment 3, 2016-2027
Table 24: Middle East & Africa Automotive Adaptive Lighting Market Revenue (USD Billion) Forecast, by Country, 2016-2027
Research Process
Data Library Research are conducted by industry experts who offer insight on
industry structure, market segmentations technology assessment and competitive landscape (CL), and penetration, as well as on emerging trends. Their analysis is based on primary interviews (~ 80%) and secondary research (~ 20%) as well as years of professional expertise in their respective industries. Adding to this, by analysing historical trends and current market positions, our analysts predict where the market will be headed for the next five years. Furthermore, the varying trends of segment & categories geographically presented are also studied and the estimated based on the primary & secondary research.
In this particular report from the supply side Data Library Research has conducted primary surveys (interviews) with the key level executives (VP, CEO’s, Marketing Director, Business Development Manager
and SOFT) of the companies that active & prominent as well as the midsized organization
FIGURE 1: DLR RESEARH PROCESS
![research-methodology1]()
Primary Research
Extensive primary research was conducted to gain a deeper insight of the market and industry performance. The analysis is based on both primary and secondary research as well as years of professional expertise in the respective industries.
In addition to analysing current and historical trends, our analysts predict where the market is headed over the next five years.
It varies by segment for these categories geographically presented in the list of market tables. Speaking about this particular report we have conducted primary surveys (interviews) with the key level executives (VP, CEO’s, Marketing Director, Business Development Manager and many more) of the major players active in the market.
Secondary Research
Secondary research was mainly used to collect and identify information useful for the extensive, technical, market-oriented, and Friend’s study of the Global Extra Neutral Alcohol. It was also used to obtain key information about major players, market classification and segmentation according to the industry trends, geographical markets, and developments related to the market and technology perspectives. For this study, analysts have gathered information from various credible sources, such as annual reports, sec filings, journals, white papers, SOFT presentations, and company web sites.
Market Size Estimation
Both, top-down and bottom-up approaches were used to estimate and validate the size of the Global market and to estimate the size of various other dependent submarkets in the overall Extra Neutral Alcohol. The key players in the market were identified through secondary research and their market contributions in the respective geographies were determined through primary and secondary research.
Forecast Model
![research-methodology2]()