Financial Terminal SE Chips Market Overview and Analysis
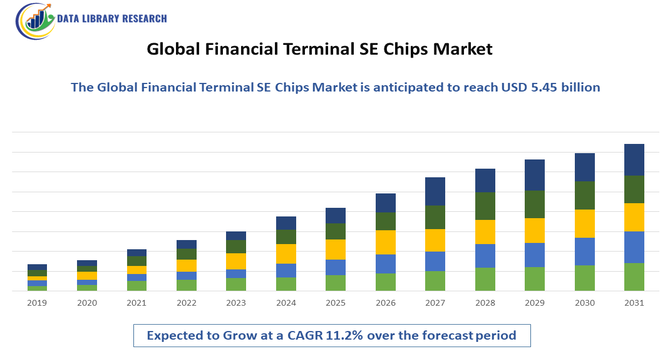
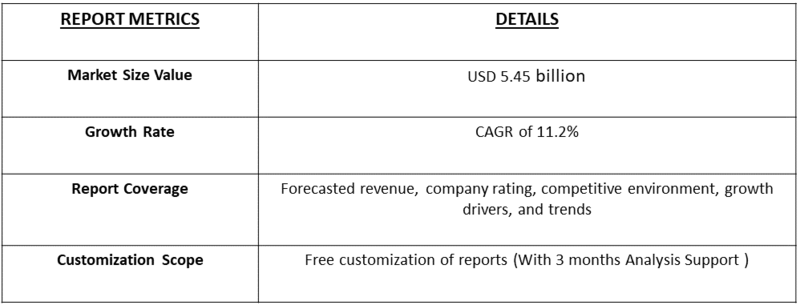
The Financial Terminal SE Chips Market size is estimated to be USD 1.62 Billion in 2025 and is expected to reach USD 5.45 by 2033 at a CAGR of 11.2% from 2025 to 2032.
Get Complete Analysis Of The Report - Download Updated Free Sample PDF
The Global Financial Terminal SE Chips Market encompasses the specialized semiconductor components—Secure Element (SE) chips—embedded in Point-of-Sale (POS) systems, ATMs, stock market trading terminals, and other financial transaction equipment. These chips are foundational for securing digital payments and sensitive data, as they are specifically designed to perform cryptographic operations, store confidential keys, and prevent tampering, meeting stringent industry standards like EMVCo and PCI. The market's value is directly tied to the worldwide growth in electronic transactions, the upgrade cycle for secure payment infrastructure, and the continuous need to mitigate sophisticated fraud, making them indispensable components in modern retail and institutional finance.
Financial Terminal SE Chips Market Latest Trends
The market is currently being shaped by several key trends, primarily the surging global demand for Near-Field Communication (NFC) and contactless payments, driving the adoption of chips supporting technologies like mobile wallets and tap-to-pay. There is a strong movement towards integrating advanced SE chips with larger System-on-Chips (SoCs) to create all-in-one payment solutions with enhanced AI capabilities for real-time fraud detection. Furthermore, increasing regulatory requirements globally, such as new data privacy and payment security mandates, necessitate hardware upgrades, pushing financial institutions to adopt newer, more robust SE chip generations with sophisticated encryption and enhanced physical security features to ensure compliance and consumer trust.
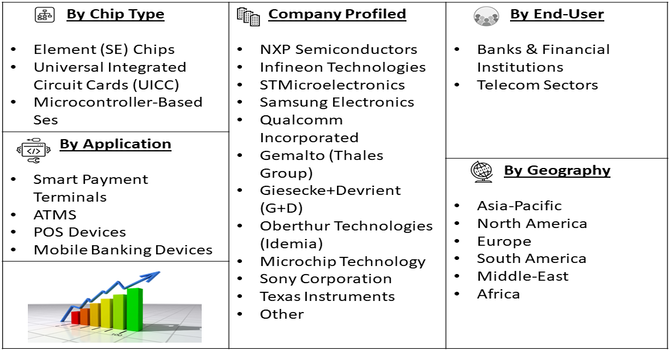
Segmentation: The Global Financial Terminal SE Chips Market is segmented by Chip Type (Element (SE) Chips, Universal Integrated Circuit Cards (UICC), and Microcontroller-Based Ses), Applications (Smart Payment Terminals, ATMS, POS Devices, and Mobile Banking Devices), End-Users (Banks & Financial Institutions and Telecom Sectors) and Geography (North America, Europe, Asia-Pacific, Latin America, Middle East & Africa). The report provides the value (in USD million) for the segments listed above.
For Detailed Market Segmentation - Get a Free Sample PDF
Market Drivers:
- Global Shift to Digital and Contactless Payments
A primary engine of growth for the Financial Terminal SE Chips Market is the dramatic, worldwide shift from cash to digital and contactless transaction methods. Consumers increasingly prefer the speed and convenience of using NFC-enabled credit cards, smartphones, and wearables (like smartwatches) to tap-and-pay at Point-of-Sale (POS) terminals. This mass adoption is forcing banks and retailers everywhere to rapidly upgrade their existing financial infrastructure with new terminals that contain the latest Secure Element (SE) chips. These advanced chips are essential because they provide the non-negotiable hardware security layer required to protect every contactless transaction from fraud, ensuring compliance with global security standards like EMV, and thereby directly fueling the demand for billions of new, secure chips.
- Tightening Regulatory Standards and the Fight Against Fraud
The another critical driver is the continuous evolution and tightening of global financial regulations, which demand stronger security measures against increasingly sophisticated cyber threats and physical attacks. Regulatory bodies worldwide are constantly updating mandates for payment security, particularly concerning data encryption and tamper-resistance for financial terminals. This forces financial service providers to frequently update or replace older equipment with systems featuring state-of-the-art SE chips. These chips include features like advanced cryptographic accelerators and active shielding to detect and neutralize physical attacks, making them mandatory components for all new terminals. This regulatory-driven obsolescence cycle ensures a steady, non-optional stream of demand for the latest, most secure chip technology.
Market Restraints:
- High Barrier to Entry and the Immense Complexity of Certification
The primary constraint on the Global Financial Terminal SE Chips Market is the high barrier to entry and the immense complexity of certification for new manufacturers. Secure Element chips must meet an extremely strict set of security standards and receive multiple, exhaustive certifications from organizations like EMVCo and various national regulatory bodies. The research and development costs, the specialized manufacturing processes (requiring high-precision fabrication plants), and the lengthy, multi-year certification process create a challenging environment. This high entry cost limits the number of players, resulting in a highly concentrated supply chain. Consequently, it exposes the entire financial industry to risks like single-source dependency and price fluctuations, which can delay the roll-out of new terminals, especially for smaller financial institutions and regional payment providers.
Social Economic Impact on Financial Terminal SE Chips Market
The global proliferation of Financial Terminal SE Chips has a significant, positive socio-economic impact by bolstering consumer trust and driving the growth of digital economies worldwide. By ensuring the integrity and confidentiality of billions of daily transactions, these secure chips facilitate the adoption of modern payment methods, which in turn reduces the shadow economy and increases the efficiency of tax collection for governments. For consumers, the robust security capabilities lead to lower instances of fraud losses and greater confidence in using electronic payments, particularly benefiting underserved populations by providing a secure, traceable entry point into the formal financial system. This accelerated digitization helps businesses, especially small and medium-sized enterprises (SMEs), reduce cash handling risks, lower transaction costs, and expand their market reach through e-commerce and secure mobile POS solutions.
Segmental Analysis:
- Element (SE) Chips Segment is Expected to Witness High Growth Over the Forecasted Period
The Secure Element (SE) chips segment is expected to experience significant growth due to the increasing need for enhanced security in financial transactions. SE chips provide a dedicated, tamper-resistant environment to securely store sensitive data such as cryptographic keys and payment credentials, making them critical for preventing fraud and cyberattacks. With the rise of contactless payments, digital wallets, and IoT-connected financial devices, demand for reliable SE chips has surged. Additionally, governments and financial institutions are enforcing stricter regulations on data protection, further driving SE chip adoption. Technological advancements, including embedded SEs (eSE) and hardware-based security solutions, are expanding the range of applications, propelling the segment’s growth throughout the forecast period.
- Mobile Banking Devices Segment is Expected to Witness High Growth Over the Forecasted Period
The mobile banking devices segment is projected to grow rapidly as smartphones and tablets become the preferred platforms for financial services worldwide. Consumers increasingly use mobile apps for transactions, account management, and payments, driving demand for secure and reliable SE chips integrated into these devices. Enhanced mobile security measures are crucial to protect sensitive financial data from cyber threats. Moreover, the adoption of biometric authentication and AI-powered security features in mobile banking apps further supports this growth. As digital banking expands in both developed and emerging markets, financial institutions are prioritizing mobile platforms, encouraging chip manufacturers to innovate and supply advanced SE chips tailored for mobile banking devices.
- BFSI Segment is Expected to Witness High Growth Over the Forecasted Period
The Banking, Financial Services, and Insurance (BFSI) segment is expected to see substantial growth in the financial terminal SE chips market, driven by the sector’s increasing focus on digital transformation and security. Financial institutions are adopting advanced payment systems, including contactless cards, mobile wallets, and biometric authentication, all requiring robust SE chip technology to safeguard sensitive information. The growing prevalence of cyber threats and regulatory mandates for data protection in BFSI further fuels demand. Additionally, the push for seamless customer experiences through secure digital platforms encourages investment in secure chip solutions. As BFSI remains a critical driver of innovation and adoption, the segment is poised for significant expansion during the forecast period.
- North America Region is Expected to Witness High Growth Over the Forecasted Period
North America is anticipated to experience high growth in the financial terminal SE chips market due to its advanced technological infrastructure and early adoption of secure payment solutions.
The region houses major semiconductor manufacturers and financial institutions investing heavily in R&D for next-generation SE chips. Increasing consumer demand for contactless payments, mobile banking, and digital wallets, coupled with stringent cybersecurity regulations, drives market growth. Furthermore, the presence of major players in the U.S. and Canada promotes innovation and commercialization of secure chip technologies. For instance, in July 2025, Japan has agreed to a USD 550 billion U.S.-bound investment package as part of a tariff reduction deal, which may help fund Taiwanese semiconductor plant developments in the U.S., according to Japan's top trade negotiator. The package includes equity, loans, and guarantees to strengthen bilateral economic ties. This move is expected to bolster North America's semiconductor infrastructure, accelerating secure chip production domestically. It could significantly benefit the financial terminal SE chips market in North America by enhancing supply chain resilience and reducing dependency on overseas chipmakers. As financial institutions prioritize enhancing transaction security and privacy, North America is expected to lead market expansion and set global trends throughout the forecast period.
To Learn More About This Report - Request a Free Sample Copy
Financial Terminal SE Chips Market Competitive Landscape:
The competitive landscape is dominated by a few major global semiconductor manufacturers like NXP Semiconductors, Infineon Technologies, and STMicroelectronics, alongside key players in the related secure data services like Thales and Giesecke+Devrient. Competition centers on miniaturization, power efficiency, offering certified software stacks, and securing long-term contracts with major financial terminal and POS system manufacturers.
The 20 major players for above market are:
- NXP Semiconductors
- Infineon Technologies
- STMicroelectronics
- Samsung Electronics
- Qualcomm Incorporated
- Gemalto (Thales Group)
- Giesecke+Devrient (G+D)
- Oberthur Technologies (Idemia)
- Microchip Technology
- Sony Corporation
- Texas Instruments
- Renesas Electronics
- Verifone Systems
- Ingenico Group (Worldline)
- Zebra Technologies
- Fidesmo
- HID Global
- Nexperia
- Broadcom Inc.
- ON Semiconductor
Recent Developments:
- In September 2025, Amlogic, has submitted its listing application to the Hong Kong Stock Exchange (HKEX), aiming to raise capital to expand its presence in AIoT and wireless communications. This move aligns with its vision of driving the "Internet of Everything" through advanced chip solutions. The IPO is expected to strengthen Amlogic’s R&D capabilities, potentially increasing its role in secure chip development, which could positively impact the financial terminal SE chips market through expanded innovation and global competitiveness
- In November 2024, iServeU has partnered with PAX Technology to introduce advanced All-in-One Soundbox terminals, integrating payment acceptance with voice-enabled transaction alerts. This collaboration aims to enhance merchant payment experiences, particularly in semi-urban and rural markets, by combining smart POS functionality with audio feedback. This partnership is likely to boost demand for secure element (SE) chips in multi-functional terminals, driving growth in the financial terminal SE chips market through increased deployment of smart, secure payment solutions.
Frequently Asked Questions (FAQ) :
Q1. What are the main growth driving factors for this market?
The main growth drivers are the increasing need for secure and fast financial transactions, especially in retail and banking sectors. Rising use of smart payment terminals, growth in digital banking, and e-commerce are pushing demand. Advances in chip technology, such as enhanced security features and better processing speed, also encourage companies to adopt these secure element (SE) chips.
Q2. What are the main restraining factors for this market?
The market faces challenges like the high cost of developing advanced SE chips and complex compliance with financial regulations across different countries. Security threats such as hacking and data breaches create hesitation among businesses. Additionally, the need for continuous innovation to keep up with cyberattacks adds pressure on manufacturers.
Q3. Which segment is expected to witness high growth?
The smart payment terminals segment is expected to witness the highest growth because retailers and banks increasingly rely on contactless and chip-based payment methods. These terminals require robust SE chips for secure transactions, driving demand in this segment as digital payments become more popular worldwide.
Q4. Who are the top major players for this market?
Top major players in the market include NXP Semiconductors, Infineon Technologies, STMicroelectronics, Samsung Electronics, and Qualcomm. These companies invest heavily in R&D to develop secure, reliable chips and maintain partnerships with financial institutions and terminal manufacturers to expand their market presence.
Q5. Which country is the largest player?
The United States is the largest player in the financial terminal SE chips market due to its strong technological infrastructure, presence of leading chip manufacturers, and early adoption of digital payment systems. The country’s focus on cybersecurity and innovation drives continuous growth and leadership in this market.
List of Figures
Figure 1: Global Financial Terminal SE Chips Market Revenue Breakdown (USD Billion, %) by Region, 2023 & 2029
Figure 2: Global Financial Terminal SE Chips Market Value Share (%), By Segment 1, 2023 & 2029
Figure 3: Global Financial Terminal SE Chips Market Forecast (USD Billion), by Sub-Segment 1, 2018-2029
Figure 4: Global Financial Terminal SE Chips Market Forecast (USD Billion), by Sub-Segment 2, 2018-2029
Figure 5: Global Financial Terminal SE Chips Market Value Share (%), By Segment 2, 2023 & 2029
Figure 6: Global Financial Terminal SE Chips Market Forecast (USD Billion), by Sub-Segment 1, 2018-2029
Figure 7: Global Financial Terminal SE Chips Market Forecast (USD Billion), by Sub-Segment 2, 2018-2029
Figure 8: Global Financial Terminal SE Chips Market Forecast (USD Billion), by Sub-Segment 3, 2018-2029
Figure 9: Global Financial Terminal SE Chips Market Forecast (USD Billion), by Others, 2018-2029
Figure 10: Global Financial Terminal SE Chips Market Value Share (%), By Segment 3, 2023 & 2029
Figure 11: Global Financial Terminal SE Chips Market Forecast (USD Billion), by Sub-Segment 1, 2018-2029
Figure 12: Global Financial Terminal SE Chips Market Forecast (USD Billion), by Sub-Segment 2, 2018-2029
Figure 13: Global Financial Terminal SE Chips Market Forecast (USD Billion), by Sub-Segment 3, 2018-2029
Figure 14: Global Financial Terminal SE Chips Market Forecast (USD Billion), by Others, 2018-2029
Figure 15: Global Financial Terminal SE Chips Market Value (USD Billion), by Region, 2023 & 2029
Figure 16: North America Financial Terminal SE Chips Market Value Share (%), By Segment 1, 2023 & 2029
Figure 17: North America Financial Terminal SE Chips Market Forecast (USD Billion), by Sub-Segment 1, 2018-2029
Figure 18: North America Financial Terminal SE Chips Market Forecast (USD Billion), by Sub-Segment 2, 2018-2029
Figure 19: North America Financial Terminal SE Chips Market Value Share (%), By Segment 2, 2023 & 2029
Figure 20: North America Financial Terminal SE Chips Market Forecast (USD Billion), by Sub-Segment 1, 2018-2029
Figure 21: North America Financial Terminal SE Chips Market Forecast (USD Billion), by Sub-Segment 2, 2018-2029
Figure 22: North America Financial Terminal SE Chips Market Forecast (USD Billion), by Sub-Segment 3, 2018-2029
Figure 23: North America Financial Terminal SE Chips Market Forecast (USD Billion), by Others, 2018-2029
Figure 24: North America Financial Terminal SE Chips Market Value Share (%), By Segment 3, 2023 & 2029
Figure 25: North America Financial Terminal SE Chips Market Forecast (USD Billion), by Sub-Segment 1, 2018-2029
Figure 26: North America Financial Terminal SE Chips Market Forecast (USD Billion), by Sub-Segment 2, 2018-2029
Figure 27: North America Financial Terminal SE Chips Market Forecast (USD Billion), by Sub-Segment 3, 2018-2029
Figure 28: North America Financial Terminal SE Chips Market Forecast (USD Billion), by Others, 2018-2029
Figure 29: North America Financial Terminal SE Chips Market Forecast (USD Billion), by U.S., 2018-2029
Figure 30: North America Financial Terminal SE Chips Market Forecast (USD Billion), by Canada, 2018-2029
Figure 31: Latin America Financial Terminal SE Chips Market Value Share (%), By Segment 1, 2023 & 2029
Figure 32: Latin America Financial Terminal SE Chips Market Forecast (USD Billion), by Sub-Segment 1, 2018-2029
Figure 33: Latin America Financial Terminal SE Chips Market Forecast (USD Billion), by Sub-Segment 2, 2018-2029
Figure 34: Latin America Financial Terminal SE Chips Market Value Share (%), By Segment 2, 2023 & 2029
Figure 35: Latin America Financial Terminal SE Chips Market Forecast (USD Billion), by Sub-Segment 1, 2018-2029
Figure 36: Latin America Financial Terminal SE Chips Market Forecast (USD Billion), by Sub-Segment 2, 2018-2029
Figure 37: Latin America Financial Terminal SE Chips Market Forecast (USD Billion), by Sub-Segment 3, 2018-2029
Figure 38: Latin America Financial Terminal SE Chips Market Forecast (USD Billion), by Others, 2018-2029
Figure 39: Latin America Financial Terminal SE Chips Market Value Share (%), By Segment 3, 2023 & 2029
Figure 40: Latin America Financial Terminal SE Chips Market Forecast (USD Billion), by Sub-Segment 1, 2018-2029
Figure 41: Latin America Financial Terminal SE Chips Market Forecast (USD Billion), by Sub-Segment 2, 2018-2029
Figure 42: Latin America Financial Terminal SE Chips Market Forecast (USD Billion), by Sub-Segment 3, 2018-2029
Figure 43: Latin America Financial Terminal SE Chips Market Forecast (USD Billion), by Others, 2018-2029
Figure 44: Latin America Financial Terminal SE Chips Market Forecast (USD Billion), by Brazil, 2018-2029
Figure 45: Latin America Financial Terminal SE Chips Market Forecast (USD Billion), by Mexico, 2018-2029
Figure 46: Latin America Financial Terminal SE Chips Market Forecast (USD Billion), by Rest of Latin America, 2018-2029
Figure 47: Europe Financial Terminal SE Chips Market Value Share (%), By Segment 1, 2023 & 2029
Figure 48: Europe Financial Terminal SE Chips Market Forecast (USD Billion), by Sub-Segment 1, 2018-2029
Figure 49: Europe Financial Terminal SE Chips Market Forecast (USD Billion), by Sub-Segment 2, 2018-2029
Figure 50: Europe Financial Terminal SE Chips Market Value Share (%), By Segment 2, 2023 & 2029
Figure 51: Europe Financial Terminal SE Chips Market Forecast (USD Billion), by Sub-Segment 1, 2018-2029
Figure 52: Europe Financial Terminal SE Chips Market Forecast (USD Billion), by Sub-Segment 2, 2018-2029
Figure 53: Europe Financial Terminal SE Chips Market Forecast (USD Billion), by Sub-Segment 3, 2018-2029
Figure 54: Europe Financial Terminal SE Chips Market Forecast (USD Billion), by Others, 2018-2029
Figure 55: Europe Financial Terminal SE Chips Market Value Share (%), By Segment 3, 2023 & 2029
Figure 56: Europe Financial Terminal SE Chips Market Forecast (USD Billion), by Sub-Segment 1, 2018-2029
Figure 57: Europe Financial Terminal SE Chips Market Forecast (USD Billion), by Sub-Segment 2, 2018-2029
Figure 58: Europe Financial Terminal SE Chips Market Forecast (USD Billion), by Sub-Segment 3, 2018-2029
Figure 59: Europe Financial Terminal SE Chips Market Forecast (USD Billion), by Others, 2018-2029
Figure 60: Europe Financial Terminal SE Chips Market Forecast (USD Billion), by U.K., 2018-2029
Figure 61: Europe Financial Terminal SE Chips Market Forecast (USD Billion), by Germany, 2018-2029
Figure 62: Europe Financial Terminal SE Chips Market Forecast (USD Billion), by France, 2018-2029
Figure 63: Europe Financial Terminal SE Chips Market Forecast (USD Billion), by Italy, 2018-2029
Figure 64: Europe Financial Terminal SE Chips Market Forecast (USD Billion), by Spain, 2018-2029
Figure 65: Europe Financial Terminal SE Chips Market Forecast (USD Billion), by Russia, 2018-2029
Figure 66: Europe Financial Terminal SE Chips Market Forecast (USD Billion), by Rest of Europe, 2018-2029
Figure 67: Asia Pacific Financial Terminal SE Chips Market Value Share (%), By Segment 1, 2023 & 2029
Figure 68: Asia Pacific Financial Terminal SE Chips Market Forecast (USD Billion), by Sub-Segment 1, 2018-2029
Figure 69: Asia Pacific Financial Terminal SE Chips Market Forecast (USD Billion), by Sub-Segment 2, 2018-2029
Figure 70: Asia Pacific Financial Terminal SE Chips Market Value Share (%), By Segment 2, 2023 & 2029
Figure 71: Asia Pacific Financial Terminal SE Chips Market Forecast (USD Billion), by Sub-Segment 1, 2018-2029
Figure 72: Asia Pacific Financial Terminal SE Chips Market Forecast (USD Billion), by Sub-Segment 2, 2018-2029
Figure 73: Asia Pacific Financial Terminal SE Chips Market Forecast (USD Billion), by Sub-Segment 3, 2018-2029
Figure 74: Asia Pacific Financial Terminal SE Chips Market Forecast (USD Billion), by Others, 2018-2029
Figure 75: Asia Pacific Financial Terminal SE Chips Market Value Share (%), By Segment 3, 2023 & 2029
Figure 76: Asia Pacific Financial Terminal SE Chips Market Forecast (USD Billion), by Sub-Segment 1, 2018-2029
Figure 77: Asia Pacific Financial Terminal SE Chips Market Forecast (USD Billion), by Sub-Segment 2, 2018-2029
Figure 78: Asia Pacific Financial Terminal SE Chips Market Forecast (USD Billion), by Sub-Segment 3, 2018-2029
Figure 79: Asia Pacific Financial Terminal SE Chips Market Forecast (USD Billion), by Others, 2018-2029
Figure 80: Asia Pacific Financial Terminal SE Chips Market Forecast (USD Billion), by China, 2018-2029
Figure 81: Asia Pacific Financial Terminal SE Chips Market Forecast (USD Billion), by India, 2018-2029
Figure 82: Asia Pacific Financial Terminal SE Chips Market Forecast (USD Billion), by Japan, 2018-2029
Figure 83: Asia Pacific Financial Terminal SE Chips Market Forecast (USD Billion), by Australia, 2018-2029
Figure 84: Asia Pacific Financial Terminal SE Chips Market Forecast (USD Billion), by Southeast Asia, 2018-2029
Figure 85: Asia Pacific Financial Terminal SE Chips Market Forecast (USD Billion), by Rest of Asia Pacific, 2018-2029
Figure 86: Middle East & Africa Financial Terminal SE Chips Market Value Share (%), By Segment 1, 2023 & 2029
Figure 87: Middle East & Africa Financial Terminal SE Chips Market Forecast (USD Billion), by Sub-Segment 1, 2018-2029
Figure 88: Middle East & Africa Financial Terminal SE Chips Market Forecast (USD Billion), by Sub-Segment 2, 2018-2029
Figure 89: Middle East & Africa Financial Terminal SE Chips Market Value Share (%), By Segment 2, 2023 & 2029
Figure 90: Middle East & Africa Financial Terminal SE Chips Market Forecast (USD Billion), by Sub-Segment 1, 2018-2029
Figure 91: Middle East & Africa Financial Terminal SE Chips Market Forecast (USD Billion), by Sub-Segment 2, 2018-2029
Figure 92: Middle East & Africa Financial Terminal SE Chips Market Forecast (USD Billion), by Sub-Segment 3, 2018-2029
Figure 93: Middle East & Africa Financial Terminal SE Chips Market Forecast (USD Billion), by Others, 2018-2029
Figure 94: Middle East & Africa Financial Terminal SE Chips Market Value Share (%), By Segment 3, 2023 & 2029
Figure 95: Middle East & Africa Financial Terminal SE Chips Market Forecast (USD Billion), by Sub-Segment 1, 2018-2029
Figure 96: Middle East & Africa Financial Terminal SE Chips Market Forecast (USD Billion), by Sub-Segment 2, 2018-2029
Figure 97: Middle East & Africa Financial Terminal SE Chips Market Forecast (USD Billion), by Sub-Segment 3, 2018-2029
Figure 98: Middle East & Africa Financial Terminal SE Chips Market Forecast (USD Billion), by Others, 2018-2029
Figure 99: Middle East & Africa Financial Terminal SE Chips Market Forecast (USD Billion), by GCC, 2018-2029
Figure 100: Middle East & Africa Financial Terminal SE Chips Market Forecast (USD Billion), by South Africa, 2018-2029
Figure 101: Middle East & Africa Financial Terminal SE Chips Market Forecast (USD Billion), by Rest of Middle East & Africa, 2018-2029
List of Tables
Table 1: Global Financial Terminal SE Chips Market Revenue (USD Billion) Forecast, by Segment 1, 2018-2029
Table 2: Global Financial Terminal SE Chips Market Revenue (USD Billion) Forecast, by Segment 2, 2018-2029
Table 3: Global Financial Terminal SE Chips Market Revenue (USD Billion) Forecast, by Segment 3, 2018-2029
Table 4: Global Financial Terminal SE Chips Market Revenue (USD Billion) Forecast, by Region, 2018-2029
Table 5: North America Financial Terminal SE Chips Market Revenue (USD Billion) Forecast, by Segment 1, 2018-2029
Table 6: North America Financial Terminal SE Chips Market Revenue (USD Billion) Forecast, by Segment 2, 2018-2029
Table 7: North America Financial Terminal SE Chips Market Revenue (USD Billion) Forecast, by Segment 3, 2018-2029
Table 8: North America Financial Terminal SE Chips Market Revenue (USD Billion) Forecast, by Country, 2018-2029
Table 9: Europe Financial Terminal SE Chips Market Revenue (USD Billion) Forecast, by Segment 1, 2018-2029
Table 10: Europe Financial Terminal SE Chips Market Revenue (USD Billion) Forecast, by Segment 2, 2018-2029
Table 11: Europe Financial Terminal SE Chips Market Revenue (USD Billion) Forecast, by Segment 3, 2018-2029
Table 12: Europe Financial Terminal SE Chips Market Revenue (USD Billion) Forecast, by Country, 2018-2029
Table 13: Latin America Financial Terminal SE Chips Market Revenue (USD Billion) Forecast, by Segment 1, 2018-2029
Table 14: Latin America Financial Terminal SE Chips Market Revenue (USD Billion) Forecast, by Segment 2, 2018-2029
Table 15: Latin America Financial Terminal SE Chips Market Revenue (USD Billion) Forecast, by Segment 3, 2018-2029
Table 16: Latin America Financial Terminal SE Chips Market Revenue (USD Billion) Forecast, by Country, 2018-2029
Table 17: Asia Pacific Financial Terminal SE Chips Market Revenue (USD Billion) Forecast, by Segment 1, 2018-2029
Table 18: Asia Pacific Financial Terminal SE Chips Market Revenue (USD Billion) Forecast, by Segment 2, 2018-2029
Table 19: Asia Pacific Financial Terminal SE Chips Market Revenue (USD Billion) Forecast, by Segment 3, 2018-2029
Table 20: Asia Pacific Financial Terminal SE Chips Market Revenue (USD Billion) Forecast, by Country, 2018-2029
Table 21: Middle East & Africa Financial Terminal SE Chips Market Revenue (USD Billion) Forecast, by Segment 1, 2018-2029
Table 22: Middle East & Africa Financial Terminal SE Chips Market Revenue (USD Billion) Forecast, by Segment 2, 2018-2029
Table 23: Middle East & Africa Financial Terminal SE Chips Market Revenue (USD Billion) Forecast, by Segment 3, 2018-2029
Table 24: Middle East & Africa Financial Terminal SE Chips Market Revenue (USD Billion) Forecast, by Country, 2018-2029
Research Process
Data Library Research are conducted by industry experts who offer insight on
industry structure, market segmentations technology assessment and competitive landscape (CL), and penetration, as well as on emerging trends. Their analysis is based on primary interviews (~ 80%) and secondary research (~ 20%) as well as years of professional expertise in their respective industries. Adding to this, by analysing historical trends and current market positions, our analysts predict where the market will be headed for the next five years. Furthermore, the varying trends of segment & categories geographically presented are also studied and the estimated based on the primary & secondary research.
In this particular report from the supply side Data Library Research has conducted primary surveys (interviews) with the key level executives (VP, CEO’s, Marketing Director, Business Development Manager
and SOFT) of the companies that active & prominent as well as the midsized organization
FIGURE 1: DLR RESEARH PROCESS
![research-methodology1]()
Primary Research
Extensive primary research was conducted to gain a deeper insight of the market and industry performance. The analysis is based on both primary and secondary research as well as years of professional expertise in the respective industries.
In addition to analysing current and historical trends, our analysts predict where the market is headed over the next five years.
It varies by segment for these categories geographically presented in the list of market tables. Speaking about this particular report we have conducted primary surveys (interviews) with the key level executives (VP, CEO’s, Marketing Director, Business Development Manager and many more) of the major players active in the market.
Secondary Research
Secondary research was mainly used to collect and identify information useful for the extensive, technical, market-oriented, and Friend’s study of the Global Extra Neutral Alcohol. It was also used to obtain key information about major players, market classification and segmentation according to the industry trends, geographical markets, and developments related to the market and technology perspectives. For this study, analysts have gathered information from various credible sources, such as annual reports, sec filings, journals, white papers, SOFT presentations, and company web sites.
Market Size Estimation
Both, top-down and bottom-up approaches were used to estimate and validate the size of the Global market and to estimate the size of various other dependent submarkets in the overall Extra Neutral Alcohol. The key players in the market were identified through secondary research and their market contributions in the respective geographies were determined through primary and secondary research.
Forecast Model
![research-methodology2]()