Industrial VOC Purification Equipment Market Overview and Analysis
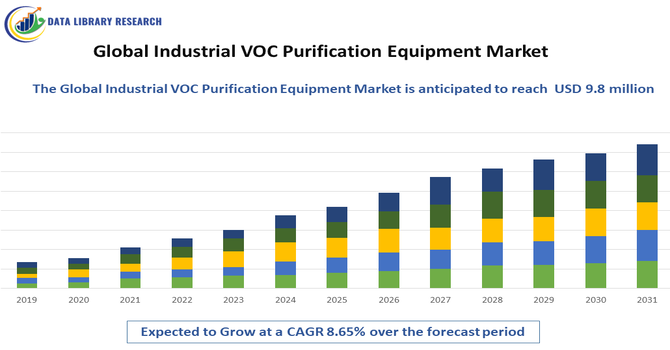
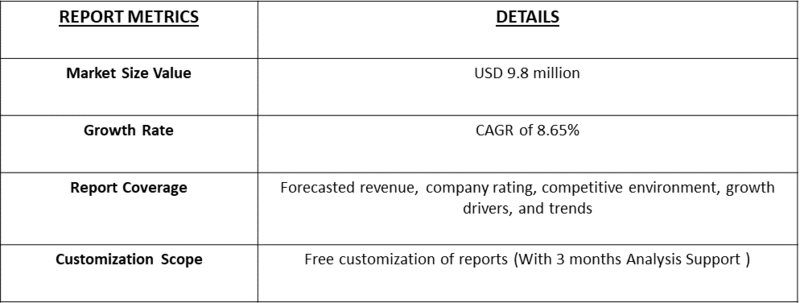
- The Global Industrial VOC Purification Equipment Market size is expected to reach USD 5.4 million by 2026, growing at a CAGR of 8.65% from 2026-2033, reaching USD 9.8 million in 2033.
Get Complete Analysis Of The Report - Download Updated Free Sample PDF
The Global Industrial VOC Purification Equipment Market refers to the industry focused on designing, manufacturing, and supplying systems that remove volatile organic compounds (VOCs) from industrial emissions. VOCs, released during processes like painting, chemical production, solvent use, and concrete spraying, pose health and environmental risks. Industrial VOC purification equipment—such as thermal oxidizers, biofilters, activated carbon systems, and adsorption units—ensures cleaner air, regulatory compliance, and reduced environmental impact. Growing industrialization, stricter environmental regulations, and increased awareness of occupational health drive market demand.
Industrial VOC Purification Equipment Market Latest Trends
The Global Industrial VOC Purification Equipment Market is growing as industries increasingly adopt cleaner production practices and comply with stricter environmental regulations. Key trends include the shift toward energy efficient and low maintenance purification systems, such as thermal oxidizers with heat recovery, activated carbon adsorption, and biologically based solutions. Digital monitoring and IoT integration allow real time emission tracking and predictive maintenance. Growth in sectors like chemicals, automotive, construction, and semiconductor manufacturing is driving demand.
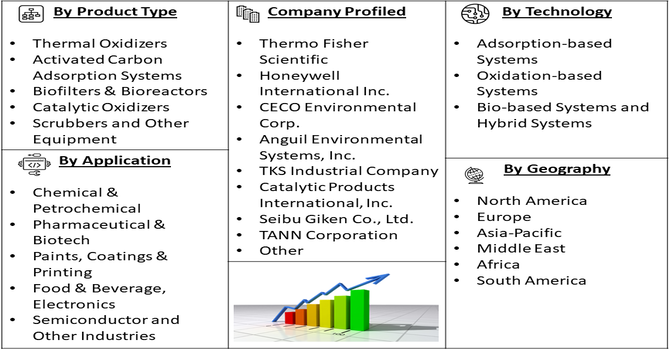
Segmentation: The Global Industrial VOC Purification Equipment Market is segmented by Equipment Type (Thermal Oxidizers, Activated Carbon Adsorption Systems, Biofilters & Bioreactors, Catalytic Oxidizers, Scrubbers and Other Equipment), Application (Chemical & Petrochemical, Pharmaceutical & Biotech, Paints, Coatings & Printing, Food & Beverage, Automotive & Aerospace, Electronics & Semiconductor and Other Industries), Technology (Adsorption-based Systems, Oxidation-based Systems, Bio-based Systems and Hybrid Systems), and Geography (North America, Europe, Asia-Pacific, Middle East and Africa, and South America). The report provides the value (in USD million) for the above segments.
For Detailed Market Segmentation - Get a Free Sample PDF
Market Drivers:
- Stringent Environmental Regulations and Emission Standards
Rising enforcement of environmental regulations is a major driver of the industrial VOC purification equipment market. Governments worldwide are implementing strict emission limits to control air pollution and protect public health. Industries such as chemicals, automotive, pharmaceuticals, and construction must comply with air quality standards, prompting investment in VOC control systems. Non-compliance can result in heavy penalties, shutdowns, and reputational damage. As regulatory frameworks become more rigorous across developed and emerging economies, companies are increasingly adopting advanced VOC purification technologies to meet compliance requirements, ensure operational continuity, and demonstrate commitment to environmental responsibility and sustainability.
- Growing Industrialization and Manufacturing Activities
Rapid industrial growth and expansion of manufacturing facilities globally are driving demand for VOC purification equipment. Increased production of chemicals, coatings, solvents, electronics, and construction materials generates higher levels of VOC emissions. To manage these emissions and maintain safe working environments, industries are adopting efficient purification systems such as thermal oxidizers, activated carbon units, and biofilters. Additionally, modernization of industrial plants and expansion into emerging markets further fuel demand. As industries focus on productivity while minimizing environmental impact, VOC purification equipment becomes essential for sustainable growth, operational efficiency, and long-term compliance with environmental standards.
Market Restraints:
- High Capital and Operational Costs
High initial investment and ongoing operational costs act as a significant restraint for the industrial VOC purification equipment market. Advanced systems require substantial capital expenditure for installation, infrastructure integration, and customization. Operational costs, including energy consumption, maintenance, replacement of filters or catalysts, and skilled personnel, further add to financial burden. Small and medium-sized enterprises often find it challenging to justify these expenses, especially in cost-sensitive markets. Additionally, complex system design and long installation timelines can delay adoption. These financial and operational challenges may slow market penetration despite increasing regulatory pressure and environmental awareness.
Socioeconomic Impact on Industrial VOC Purification Equipment Market
Industrial VOC purification equipment improves workplace safety, public health, and environmental quality by reducing harmful emissions from factories and plants. Cleaner air lowers respiratory and chronic health issues, cutting healthcare costs and enhancing productivity. Investments in VOC control systems support regulatory compliance, helping companies avoid fines and legal risks. The market also fosters job creation in engineering, manufacturing, installation, and maintenance services. As industries adopt advanced purification technologies, local economies benefit from safer industrial growth, increased export competitiveness, and improved community well being. Reducing pollution also enhances urban livability and supports broader sustainability goals, aligning industrial practices with environmental stewardship and responsible economic development.
Segmental Analysis:
- Activated Carbon Adsorption Systems segment is expected to witness highest growth over the forecast period
The activated carbon adsorption systems segment is expected to witness the highest growth over the forecast period due to its efficiency, flexibility, and cost-effectiveness in VOC removal. These systems are widely adopted across multiple industries for capturing a broad range of volatile organic compounds at low to moderate concentrations. Their modular design, ease of installation, and ability to regenerate or replace carbon media make them attractive for both new and retrofitted facilities. Increasing demand for compact, energy-efficient solutions and compliance with strict emission standards is driving adoption. Additionally, advancements in carbon materials and system design are improving performance and expanding application areas globally.
- Chemical & Petrochemical segment is expected to witness highest growth over the forecast period
The chemical and petrochemical segment is expected to experience the highest growth as these industries generate significant VOC emissions during processing, storage, and transportation activities. Stricter environmental regulations and rising awareness of occupational health risks are compelling operators to invest in advanced VOC purification equipment. Rapid capacity expansion, particularly in emerging economies, further increases emission control requirements. VOC purification systems help chemical producers maintain regulatory compliance, enhance workplace safety, and reduce environmental impact. As demand for chemicals, plastics, and refined products continues to rise globally, adoption of reliable and scalable VOC control solutions in this segment is expected to grow steadily over the forecast period.
- Adsorption-based Systems segment is expected to witness highest growth over the forecast period
The adsorption-based systems segment is projected to witness the highest growth due to its proven effectiveness in capturing VOCs without high energy consumption. These systems are preferred for applications involving variable airflows and lower VOC concentrations, making them suitable for diverse industrial processes. Adsorption technologies, particularly those using activated carbon and zeolites, offer flexibility, lower operating costs, and ease of integration with existing infrastructure. Increasing focus on energy efficiency and sustainable emission control solutions is driving adoption. Industries seeking cost-effective compliance solutions are increasingly selecting adsorption-based systems, supporting strong growth of this segment across both developed and developing markets.
- Asia-Pacfic Region is expected to witness highest growth over the forecast period
Asia-Pacific is expected to witness the highest growth in the industrial VOC purification equipment market over the forecast period. Rapid industrialization, expanding chemical and manufacturing sectors, and stricter environmental regulations are driving demand for VOC control technologies. Countries such as China, India, Japan, and South Korea are investing heavily in pollution control to address air quality concerns. Growth in construction, automotive, electronics, and petrochemical industries further increases VOC emissions, creating strong demand for purification equipment. Government initiatives promoting sustainable industrial practices and increasing awareness of environmental compliance are expected to support continued market expansion across the Asia-Pacific region.
To Learn More About This Report - Request a Free Sample Copy
Industrial VOC Purification Equipment Market Competitive Landscape
The competitive landscape of the industrial VOC purification equipment market features established environmental engineering firms and specialized air pollution control equipment manufacturers. Companies compete on technology performance, energy efficiency, customization, and after sales support. Leading players invest in R&D to offer modular, scalable solutions tailored to diverse industries and emission profiles. Strategic partnerships with industrial firms and system integrators help secure long term contracts. Smaller niche players differentiate through specialized solutions for unique applications, while larger corporations leverage global distribution networks and brand reputation.
The major players for above market are:
- Thermo Fisher Scientific
- Honeywell International Inc.
- CECO Environmental Corp.
- Anguil Environmental Systems, Inc.
- TKS Industrial Company
- Catalytic Products International, Inc.
- Seibu Giken Co., Ltd.
- Taikisha Ltd.
- Dürr AG
- The CMM Group, LLC
- Munters Group AB
- Condorchem Envitech
- Air Clear, LLC
- Evoqua Water Technologies LLC
- TANN Corporation
- Ecolab Inc.
- Alfa Laval
- Parker Hannifin Corporation
- Donaldson Company, Inc.
- Gulf Coast Environmental Systems
Recent Development
- In February 2025, Great Wall Filtration announced the mass production of its newly developed activated carbon filter sheets. The company confirmed that its high-performance activated carbon filter boards successfully completed comprehensive technical validation and were approved for large-scale manufacturing.
- In May 2024, Organic Recycling Systems Limited (ORS) launched GAC-01 under its Alpha Carbon brand. The new biomass-based activated carbon granule, produced from discarded feedstocks such as coconut shells, marked a major advancement in sustainable water treatment filtration media.
Frequently Asked Questions (FAQ) :
Q1. What are the main growth-driving factors for this market?
The primary driver is the implementation of stringent environmental regulations worldwide, such as the Clean Air Act, mandating industries to reduce Volatile Organic Compound emissions. Rapid industrialization in emerging economies and increasing corporate focus on ESG (Environmental, Social, and Governance) standards further accelerate the adoption of advanced air filtration and purification technologies.
Q2. What are the main restraining factors for this market?
The high initial capital expenditure and substantial operational costs associated with maintaining thermal oxidizers and carbon adsorption systems act as significant barriers. Additionally, the technical complexity of treating diverse gas compositions and the economic impact of industrial slowdowns can delay investment in new purification infrastructure for small and medium enterprises.
Q3. Which segment is expected to witness high growth?
The activated carbon adsorption systems segment is expected to grow fastest due to high VOC removal efficiency, cost-effectiveness, easy installation, and rising adoption across chemical, manufacturing, and environmental compliance applications worldwide.
Q4. Who are the top major players for this market?
Leading global participants include Dürr AG, Munters, Anguil Environmental Systems, CECO Environmental, and TKS Industrial. These companies maintain their market positions through continuous R&D, focusing on modular designs and energy-efficient systems. They provide comprehensive solutions ranging from adsorption and biofiltration to advanced thermal and catalytic oxidation technologies for various sectors.
Q5. Which country is the largest player?
China stands as the largest player in the global VOC purification market. Driven by the government’s "Blue Sky" defense plan and aggressive anti-pollution targets, China has seen a massive surge in demand across its manufacturing hubs. The country’s large-scale production of steel, chemicals, and electronics necessitates extensive VOC abatement infrastructure.
List of Figures
Figure 1: Global Industrial VOC Purification Equipment Market Revenue Breakdown (USD Billion, %) by Region, 2022 & 2029
Figure 2: Global Industrial VOC Purification Equipment Market Value Share (%), By Segment 1, 2022 & 2029
Figure 3: Global Industrial VOC Purification Equipment Market Forecast (USD Billion), by Sub-Segment 1, 2018-2029
Figure 4: Global Industrial VOC Purification Equipment Market Forecast (USD Billion), by Sub-Segment 2, 2018-2029
Figure 5: Global Industrial VOC Purification Equipment Market Value Share (%), By Segment 2, 2022 & 2029
Figure 6: Global Industrial VOC Purification Equipment Market Forecast (USD Billion), by Sub-Segment 1, 2018-2029
Figure 7: Global Industrial VOC Purification Equipment Market Forecast (USD Billion), by Sub-Segment 2, 2018-2029
Figure 8: Global Industrial VOC Purification Equipment Market Forecast (USD Billion), by Sub-Segment 3, 2018-2029
Figure 9: Global Industrial VOC Purification Equipment Market Forecast (USD Billion), by Others, 2018-2029
Figure 10: Global Industrial VOC Purification Equipment Market Value Share (%), By Segment 3, 2022 & 2029
Figure 11: Global Industrial VOC Purification Equipment Market Forecast (USD Billion), by Sub-Segment 1, 2018-2029
Figure 12: Global Industrial VOC Purification Equipment Market Forecast (USD Billion), by Sub-Segment 2, 2018-2029
Figure 13: Global Industrial VOC Purification Equipment Market Forecast (USD Billion), by Sub-Segment 3, 2018-2029
Figure 14: Global Industrial VOC Purification Equipment Market Forecast (USD Billion), by Others, 2018-2029
Figure 15: Global Industrial VOC Purification Equipment Market Value (USD Billion), by Region, 2022 & 2029
Figure 16: North America Industrial VOC Purification Equipment Market Value Share (%), By Segment 1, 2022 & 2029
Figure 17: North America Industrial VOC Purification Equipment Market Forecast (USD Billion), by Sub-Segment 1, 2018-2029
Figure 18: North America Industrial VOC Purification Equipment Market Forecast (USD Billion), by Sub-Segment 2, 2018-2029
Figure 19: North America Industrial VOC Purification Equipment Market Value Share (%), By Segment 2, 2022 & 2029
Figure 20: North America Industrial VOC Purification Equipment Market Forecast (USD Billion), by Sub-Segment 1, 2018-2029
Figure 21: North America Industrial VOC Purification Equipment Market Forecast (USD Billion), by Sub-Segment 2, 2018-2029
Figure 22: North America Industrial VOC Purification Equipment Market Forecast (USD Billion), by Sub-Segment 3, 2018-2029
Figure 23: North America Industrial VOC Purification Equipment Market Forecast (USD Billion), by Others, 2018-2029
Figure 24: North America Industrial VOC Purification Equipment Market Value Share (%), By Segment 3, 2022 & 2029
Figure 25: North America Industrial VOC Purification Equipment Market Forecast (USD Billion), by Sub-Segment 1, 2018-2029
Figure 26: North America Industrial VOC Purification Equipment Market Forecast (USD Billion), by Sub-Segment 2, 2018-2029
Figure 27: North America Industrial VOC Purification Equipment Market Forecast (USD Billion), by Sub-Segment 3, 2018-2029
Figure 28: North America Industrial VOC Purification Equipment Market Forecast (USD Billion), by Others, 2018-2029
Figure 29: North America Industrial VOC Purification Equipment Market Forecast (USD Billion), by U.S., 2018-2029
Figure 30: North America Industrial VOC Purification Equipment Market Forecast (USD Billion), by Canada, 2018-2029
Figure 31: Latin America Industrial VOC Purification Equipment Market Value Share (%), By Segment 1, 2022 & 2029
Figure 32: Latin America Industrial VOC Purification Equipment Market Forecast (USD Billion), by Sub-Segment 1, 2018-2029
Figure 33: Latin America Industrial VOC Purification Equipment Market Forecast (USD Billion), by Sub-Segment 2, 2018-2029
Figure 34: Latin America Industrial VOC Purification Equipment Market Value Share (%), By Segment 2, 2022 & 2029
Figure 35: Latin America Industrial VOC Purification Equipment Market Forecast (USD Billion), by Sub-Segment 1, 2018-2029
Figure 36: Latin America Industrial VOC Purification Equipment Market Forecast (USD Billion), by Sub-Segment 2, 2018-2029
Figure 37: Latin America Industrial VOC Purification Equipment Market Forecast (USD Billion), by Sub-Segment 3, 2018-2029
Figure 38: Latin America Industrial VOC Purification Equipment Market Forecast (USD Billion), by Others, 2018-2029
Figure 39: Latin America Industrial VOC Purification Equipment Market Value Share (%), By Segment 3, 2022 & 2029
Figure 40: Latin America Industrial VOC Purification Equipment Market Forecast (USD Billion), by Sub-Segment 1, 2018-2029
Figure 41: Latin America Industrial VOC Purification Equipment Market Forecast (USD Billion), by Sub-Segment 2, 2018-2029
Figure 42: Latin America Industrial VOC Purification Equipment Market Forecast (USD Billion), by Sub-Segment 3, 2018-2029
Figure 43: Latin America Industrial VOC Purification Equipment Market Forecast (USD Billion), by Others, 2018-2029
Figure 44: Latin America Industrial VOC Purification Equipment Market Forecast (USD Billion), by Brazil, 2018-2029
Figure 45: Latin America Industrial VOC Purification Equipment Market Forecast (USD Billion), by Mexico, 2018-2029
Figure 46: Latin America Industrial VOC Purification Equipment Market Forecast (USD Billion), by Rest of Latin America, 2018-2029
Figure 47: Europe Industrial VOC Purification Equipment Market Value Share (%), By Segment 1, 2022 & 2029
Figure 48: Europe Industrial VOC Purification Equipment Market Forecast (USD Billion), by Sub-Segment 1, 2018-2029
Figure 49: Europe Industrial VOC Purification Equipment Market Forecast (USD Billion), by Sub-Segment 2, 2018-2029
Figure 50: Europe Industrial VOC Purification Equipment Market Value Share (%), By Segment 2, 2022 & 2029
Figure 51: Europe Industrial VOC Purification Equipment Market Forecast (USD Billion), by Sub-Segment 1, 2018-2029
Figure 52: Europe Industrial VOC Purification Equipment Market Forecast (USD Billion), by Sub-Segment 2, 2018-2029
Figure 53: Europe Industrial VOC Purification Equipment Market Forecast (USD Billion), by Sub-Segment 3, 2018-2029
Figure 54: Europe Industrial VOC Purification Equipment Market Forecast (USD Billion), by Others, 2018-2029
Figure 55: Europe Industrial VOC Purification Equipment Market Value Share (%), By Segment 3, 2022 & 2029
Figure 56: Europe Industrial VOC Purification Equipment Market Forecast (USD Billion), by Sub-Segment 1, 2018-2029
Figure 57: Europe Industrial VOC Purification Equipment Market Forecast (USD Billion), by Sub-Segment 2, 2018-2029
Figure 58: Europe Industrial VOC Purification Equipment Market Forecast (USD Billion), by Sub-Segment 3, 2018-2029
Figure 59: Europe Industrial VOC Purification Equipment Market Forecast (USD Billion), by Others, 2018-2029
Figure 60: Europe Industrial VOC Purification Equipment Market Forecast (USD Billion), by U.K., 2018-2029
Figure 61: Europe Industrial VOC Purification Equipment Market Forecast (USD Billion), by Germany, 2018-2029
Figure 62: Europe Industrial VOC Purification Equipment Market Forecast (USD Billion), by France, 2018-2029
Figure 63: Europe Industrial VOC Purification Equipment Market Forecast (USD Billion), by Italy, 2018-2029
Figure 64: Europe Industrial VOC Purification Equipment Market Forecast (USD Billion), by Spain, 2018-2029
Figure 65: Europe Industrial VOC Purification Equipment Market Forecast (USD Billion), by Russia, 2018-2029
Figure 66: Europe Industrial VOC Purification Equipment Market Forecast (USD Billion), by Rest of Europe, 2018-2029
Figure 67: Asia Pacific Industrial VOC Purification Equipment Market Value Share (%), By Segment 1, 2022 & 2029
Figure 68: Asia Pacific Industrial VOC Purification Equipment Market Forecast (USD Billion), by Sub-Segment 1, 2018-2029
Figure 69: Asia Pacific Industrial VOC Purification Equipment Market Forecast (USD Billion), by Sub-Segment 2, 2018-2029
Figure 70: Asia Pacific Industrial VOC Purification Equipment Market Value Share (%), By Segment 2, 2022 & 2029
Figure 71: Asia Pacific Industrial VOC Purification Equipment Market Forecast (USD Billion), by Sub-Segment 1, 2018-2029
Figure 72: Asia Pacific Industrial VOC Purification Equipment Market Forecast (USD Billion), by Sub-Segment 2, 2018-2029
Figure 73: Asia Pacific Industrial VOC Purification Equipment Market Forecast (USD Billion), by Sub-Segment 3, 2018-2029
Figure 74: Asia Pacific Industrial VOC Purification Equipment Market Forecast (USD Billion), by Others, 2018-2029
Figure 75: Asia Pacific Industrial VOC Purification Equipment Market Value Share (%), By Segment 3, 2022 & 2029
Figure 76: Asia Pacific Industrial VOC Purification Equipment Market Forecast (USD Billion), by Sub-Segment 1, 2018-2029
Figure 77: Asia Pacific Industrial VOC Purification Equipment Market Forecast (USD Billion), by Sub-Segment 2, 2018-2029
Figure 78: Asia Pacific Industrial VOC Purification Equipment Market Forecast (USD Billion), by Sub-Segment 3, 2018-2029
Figure 79: Asia Pacific Industrial VOC Purification Equipment Market Forecast (USD Billion), by Others, 2018-2029
Figure 80: Asia Pacific Industrial VOC Purification Equipment Market Forecast (USD Billion), by China, 2018-2029
Figure 81: Asia Pacific Industrial VOC Purification Equipment Market Forecast (USD Billion), by India, 2018-2029
Figure 82: Asia Pacific Industrial VOC Purification Equipment Market Forecast (USD Billion), by Japan, 2018-2029
Figure 83: Asia Pacific Industrial VOC Purification Equipment Market Forecast (USD Billion), by Australia, 2018-2029
Figure 84: Asia Pacific Industrial VOC Purification Equipment Market Forecast (USD Billion), by Southeast Asia, 2018-2029
Figure 85: Asia Pacific Industrial VOC Purification Equipment Market Forecast (USD Billion), by Rest of Asia Pacific, 2018-2029
Figure 86: Middle East & Africa Industrial VOC Purification Equipment Market Value Share (%), By Segment 1, 2022 & 2029
Figure 87: Middle East & Africa Industrial VOC Purification Equipment Market Forecast (USD Billion), by Sub-Segment 1, 2018-2029
Figure 88: Middle East & Africa Industrial VOC Purification Equipment Market Forecast (USD Billion), by Sub-Segment 2, 2018-2029
Figure 89: Middle East & Africa Industrial VOC Purification Equipment Market Value Share (%), By Segment 2, 2022 & 2029
Figure 90: Middle East & Africa Industrial VOC Purification Equipment Market Forecast (USD Billion), by Sub-Segment 1, 2018-2029
Figure 91: Middle East & Africa Industrial VOC Purification Equipment Market Forecast (USD Billion), by Sub-Segment 2, 2018-2029
Figure 92: Middle East & Africa Industrial VOC Purification Equipment Market Forecast (USD Billion), by Sub-Segment 3, 2018-2029
Figure 93: Middle East & Africa Industrial VOC Purification Equipment Market Forecast (USD Billion), by Others, 2018-2029
Figure 94: Middle East & Africa Industrial VOC Purification Equipment Market Value Share (%), By Segment 3, 2022 & 2029
Figure 95: Middle East & Africa Industrial VOC Purification Equipment Market Forecast (USD Billion), by Sub-Segment 1, 2018-2029
Figure 96: Middle East & Africa Industrial VOC Purification Equipment Market Forecast (USD Billion), by Sub-Segment 2, 2018-2029
Figure 97: Middle East & Africa Industrial VOC Purification Equipment Market Forecast (USD Billion), by Sub-Segment 3, 2018-2029
Figure 98: Middle East & Africa Industrial VOC Purification Equipment Market Forecast (USD Billion), by Others, 2018-2029
Figure 99: Middle East & Africa Industrial VOC Purification Equipment Market Forecast (USD Billion), by GCC, 2018-2029
Figure 100: Middle East & Africa Industrial VOC Purification Equipment Market Forecast (USD Billion), by South Africa, 2018-2029
Figure 101: Middle East & Africa Industrial VOC Purification Equipment Market Forecast (USD Billion), by Rest of Middle East & Africa, 2018-2029
List of Tables
Table 1: Global Industrial VOC Purification Equipment Market Revenue (USD Billion) Forecast, by Segment 1, 2018-2029
Table 2: Global Industrial VOC Purification Equipment Market Revenue (USD Billion) Forecast, by Segment 2, 2018-2029
Table 3: Global Industrial VOC Purification Equipment Market Revenue (USD Billion) Forecast, by Segment 3, 2018-2029
Table 4: Global Industrial VOC Purification Equipment Market Revenue (USD Billion) Forecast, by Region, 2018-2029
Table 5: North America Industrial VOC Purification Equipment Market Revenue (USD Billion) Forecast, by Segment 1, 2018-2029
Table 6: North America Industrial VOC Purification Equipment Market Revenue (USD Billion) Forecast, by Segment 2, 2018-2029
Table 7: North America Industrial VOC Purification Equipment Market Revenue (USD Billion) Forecast, by Segment 3, 2018-2029
Table 8: North America Industrial VOC Purification Equipment Market Revenue (USD Billion) Forecast, by Country, 2018-2029
Table 9: Europe Industrial VOC Purification Equipment Market Revenue (USD Billion) Forecast, by Segment 1, 2018-2029
Table 10: Europe Industrial VOC Purification Equipment Market Revenue (USD Billion) Forecast, by Segment 2, 2018-2029
Table 11: Europe Industrial VOC Purification Equipment Market Revenue (USD Billion) Forecast, by Segment 3, 2018-2029
Table 12: Europe Industrial VOC Purification Equipment Market Revenue (USD Billion) Forecast, by Country, 2018-2029
Table 13: Latin America Industrial VOC Purification Equipment Market Revenue (USD Billion) Forecast, by Segment 1, 2018-2029
Table 14: Latin America Industrial VOC Purification Equipment Market Revenue (USD Billion) Forecast, by Segment 2, 2018-2029
Table 15: Latin America Industrial VOC Purification Equipment Market Revenue (USD Billion) Forecast, by Segment 3, 2018-2029
Table 16: Latin America Industrial VOC Purification Equipment Market Revenue (USD Billion) Forecast, by Country, 2018-2029
Table 17: Asia Pacific Industrial VOC Purification Equipment Market Revenue (USD Billion) Forecast, by Segment 1, 2018-2029
Table 18: Asia Pacific Industrial VOC Purification Equipment Market Revenue (USD Billion) Forecast, by Segment 2, 2018-2029
Table 19: Asia Pacific Industrial VOC Purification Equipment Market Revenue (USD Billion) Forecast, by Segment 3, 2018-2029
Table 20: Asia Pacific Industrial VOC Purification Equipment Market Revenue (USD Billion) Forecast, by Country, 2018-2029
Table 21: Middle East & Africa Industrial VOC Purification Equipment Market Revenue (USD Billion) Forecast, by Segment 1, 2018-2029
Table 22: Middle East & Africa Industrial VOC Purification Equipment Market Revenue (USD Billion) Forecast, by Segment 2, 2018-2029
Table 23: Middle East & Africa Industrial VOC Purification Equipment Market Revenue (USD Billion) Forecast, by Segment 3, 2018-2029
Table 24: Middle East & Africa Industrial VOC Purification Equipment Market Revenue (USD Billion) Forecast, by Country, 2018-2029
Research Process
Data Library Research are conducted by industry experts who offer insight on
industry structure, market segmentations technology assessment and competitive landscape (CL), and penetration, as well as on emerging trends. Their analysis is based on primary interviews (~ 80%) and secondary research (~ 20%) as well as years of professional expertise in their respective industries. Adding to this, by analysing historical trends and current market positions, our analysts predict where the market will be headed for the next five years. Furthermore, the varying trends of segment & categories geographically presented are also studied and the estimated based on the primary & secondary research.
In this particular report from the supply side Data Library Research has conducted primary surveys (interviews) with the key level executives (VP, CEO’s, Marketing Director, Business Development Manager
and SOFT) of the companies that active & prominent as well as the midsized organization
FIGURE 1: DLR RESEARH PROCESS
![research-methodology1]()
Primary Research
Extensive primary research was conducted to gain a deeper insight of the market and industry performance. The analysis is based on both primary and secondary research as well as years of professional expertise in the respective industries.
In addition to analysing current and historical trends, our analysts predict where the market is headed over the next five years.
It varies by segment for these categories geographically presented in the list of market tables. Speaking about this particular report we have conducted primary surveys (interviews) with the key level executives (VP, CEO’s, Marketing Director, Business Development Manager and many more) of the major players active in the market.
Secondary Research
Secondary research was mainly used to collect and identify information useful for the extensive, technical, market-oriented, and Friend’s study of the Global Extra Neutral Alcohol. It was also used to obtain key information about major players, market classification and segmentation according to the industry trends, geographical markets, and developments related to the market and technology perspectives. For this study, analysts have gathered information from various credible sources, such as annual reports, sec filings, journals, white papers, SOFT presentations, and company web sites.
Market Size Estimation
Both, top-down and bottom-up approaches were used to estimate and validate the size of the Global market and to estimate the size of various other dependent submarkets in the overall Extra Neutral Alcohol. The key players in the market were identified through secondary research and their market contributions in the respective geographies were determined through primary and secondary research.
Forecast Model
![research-methodology2]()