IT Asset Management (ITAM) Software Market Overview
IT Asset Management (ITAM) is a type of business management that is linked to an organization's IT infrastructure. To manage the overall life cycle of these assets, it includes inventory, financial, contractual, and risk management activities. It entails obtaining extensive information on hardware and software inventory in order to assist the business in managing the assets' purchase and use.
The platform assists businesses in recognizing the value of assets, which aids in strategic decision-making and life cycle management in the IT field. The increased demand for IT framework centralization and automation. These are some of the variables that are expected to drive market expansion over the next few years.
On the other hand, the high installation cost is a major factor that could limit the market's growth.
| Report Metric |
Details |
| Market size available for years |
2023–2030 |
| Base year considered |
2023 |
| Forecast period |
2024–2030 |
| Forecast unit |
Value (USD Million) |
| Segments covered |
Type, Application, and Region. |
| Regions covered |
North America (the U.S. and Canada), Europe (UK, Germany, France, Italy, Spain, Russia, Rest of Europe), Asia-Pacific (China, India, Japan, Australia, South East Asia, Rest of Asia Pacific), Latin America and the Middle East and Africa (Brazil, Saudi Arabia, UAE, Rest of LAMEA) |
| Companies covered |
Symantec, Microsoft, BMC, Attachmate, JustSAMIt, IBM, Scalable, HP, Freshservice, and Samanage. |
Covid-19 Impact on IT Asset Management (ITAM) Software Market
Like many other industries, COVID-19 badly knocked the electronic and semiconductor industries. This unprecedented event has impacted nearly 230 countries in just a few weeks, resulting in the forced shutdown of manufacturing and transportation activities within and across the countries. This has directly affected the overall sector's growth. It is estimated that COVID-19 to leave more than USD 30 billion impacts on the electronics and semiconductor industry. The sector is majorly affected due to transport restrictions on major electronics and semiconductor raw material providers. However, the emerging need for semiconductors in several industries will offer rapid market recovery over the future period
IT Asset Management (ITAM) Software Market Segment Overview
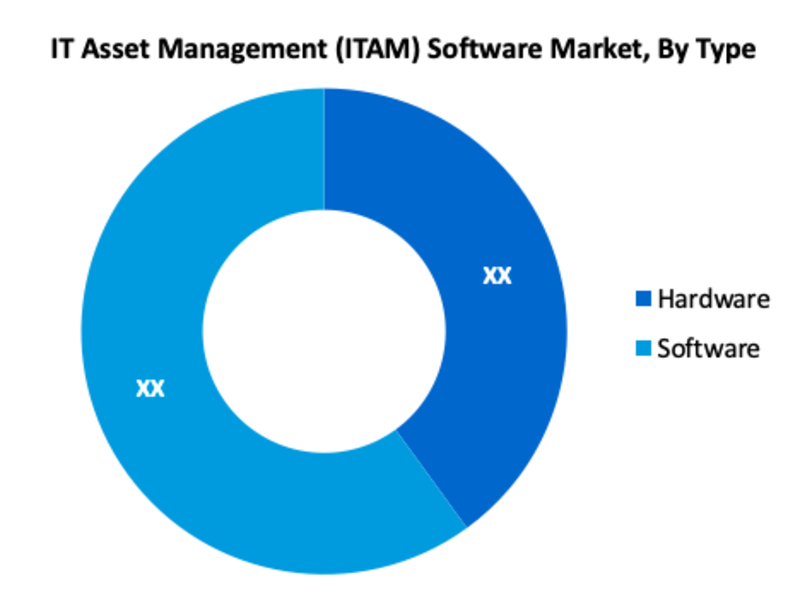
Based on the Type, Software is one of the most prominent segments in the global IT Asset Management (ITAM) Software Market. The purpose of ITAM is to create a centralized location to manage an organization's whole inventory of IT assets, which is a tough undertaking that most firms can't fully accomplish due to the scope and scale of most IT inventories. Third-party services, on the other hand, can assist organizations in getting as near to achieving centralized IT asset control as possible.
IT Asset Management (ITAM) Software Market, By Type
· Hardware
· Software
IT Asset Management (ITAM) Software Market, By Application
· Government
· Pharm and Medical
· Bank and Finance
· Transportation
· Energy
· Others
IT Asset Management (ITAM) Software Market Regional Overview
In terms of geography, the global IT Asset Management (ITAM) Software market is classified into North America, South America, Europe, Asia Pacific, and Middle East & Africa. North America now dominates the IT asset management software market, owing to strong investment in technology, attention to the needs of complicated software lifecycle management, and strict laws and regulations governing asset purchases. These reasons encourage businesses to implement technology that reduces the variable cost of purchases while also maintaining balance by keeping track of demand and supply.
IT Asset Management (ITAM) Software Market, By Geography
· North America (US & Canada)
· Europe (UK, Germany, France, Italy, Spain, Russia & Rest of Europe)
· Asia-Pacific (Japan, China, India, Australia, & South Korea, & Rest of Asia-Pacific)
· LAMEA (Brazil, Saudi Arabia, UAE & Rest of LAMEA)
IT Asset Management (ITAM) Software Market, Key Players
· Symantec
· Microsoft
· BMC
· Attachmate
· JustSAMIt
· IBM
· Scalable
· HP
· Freshservice
· Samanage
Frequently Asked Questions (FAQ) :
Q1. What are the driving factors for the global IT Asset Management (ITAM) Software market?
The increased demand for IT framework centralization and automation. This variable that is expected to drive market expansion over the next few years
Q2. What are the restraining factors for the global IT Asset Management (ITAM) Software market?
The high installation cost is a major factor that could limit the market's growth
Q3. Which segment is projected to hold the largest share in the global IT Asset Management (ITAM) Software market?
The software segment is projected to hold the largest share in the global IT Asset Management (ITAM) Software market
Q4. Which region holds the largest share in the global IT Asset Management (ITAM) Software market?
North America holds the largest share in the global IT Asset Management (ITAM) Software market.
Q5. Which are the prominent players in the global IT Asset Management (ITAM) Software market?
Symantec, Microsoft, BMC, Attachmate, JustSAMIt, IBM, Scalable, HP, Freshservice, and Samanage. are some key players in the global IT Asset Management (ITAM) Software market.
List of Figures
Figure 1: Global IT Asset Management (ITAM) Software Market Revenue Breakdown (USD Billion, %) by Region, 2019 & 2027
Figure 2: Global IT Asset Management (ITAM) Software Market Value Share (%), By Segment 1, 2019 & 2027
Figure 3: Global IT Asset Management (ITAM) Software Market Forecast (USD Billion), by Sub-Segment 1, 2016-2027
Figure 4: Global IT Asset Management (ITAM) Software Market Forecast (USD Billion), by Sub-Segment 2, 2016-2027
Figure 5: Global IT Asset Management (ITAM) Software Market Value Share (%), By Segment 2, 2019 & 2027
Figure 6: Global IT Asset Management (ITAM) Software Market Forecast (USD Billion), by Sub-Segment 1, 2016-2027
Figure 7: Global IT Asset Management (ITAM) Software Market Forecast (USD Billion), by Sub-Segment 2, 2016-2027
Figure 8: Global IT Asset Management (ITAM) Software Market Forecast (USD Billion), by Sub-Segment 3, 2016-2027
Figure 9: Global IT Asset Management (ITAM) Software Market Forecast (USD Billion), by Others, 2016-2027
Figure 10: Global IT Asset Management (ITAM) Software Market Value Share (%), By Segment 3, 2019 & 2027
Figure 11: Global IT Asset Management (ITAM) Software Market Forecast (USD Billion), by Sub-Segment 1, 2016-2027
Figure 12: Global IT Asset Management (ITAM) Software Market Forecast (USD Billion), by Sub-Segment 2, 2016-2027
Figure 13: Global IT Asset Management (ITAM) Software Market Forecast (USD Billion), by Sub-Segment 3, 2016-2027
Figure 14: Global IT Asset Management (ITAM) Software Market Forecast (USD Billion), by Others, 2016-2027
Figure 15: Global IT Asset Management (ITAM) Software Market Value (USD Billion), by Region, 2019 & 2027
Figure 16: North America IT Asset Management (ITAM) Software Market Value Share (%), By Segment 1, 2019 & 2027
Figure 17: North America IT Asset Management (ITAM) Software Market Forecast (USD Billion), by Sub-Segment 1, 2016-2027
Figure 18: North America IT Asset Management (ITAM) Software Market Forecast (USD Billion), by Sub-Segment 2, 2016-2027
Figure 19: North America IT Asset Management (ITAM) Software Market Value Share (%), By Segment 2, 2019 & 2027
Figure 20: North America IT Asset Management (ITAM) Software Market Forecast (USD Billion), by Sub-Segment 1, 2016-2027
Figure 21: North America IT Asset Management (ITAM) Software Market Forecast (USD Billion), by Sub-Segment 2, 2016-2027
Figure 22: North America IT Asset Management (ITAM) Software Market Forecast (USD Billion), by Sub-Segment 3, 2016-2027
Figure 23: North America IT Asset Management (ITAM) Software Market Forecast (USD Billion), by Others, 2016-2027
Figure 24: North America IT Asset Management (ITAM) Software Market Value Share (%), By Segment 3, 2019 & 2027
Figure 25: North America IT Asset Management (ITAM) Software Market Forecast (USD Billion), by Sub-Segment 1, 2016-2027
Figure 26: North America IT Asset Management (ITAM) Software Market Forecast (USD Billion), by Sub-Segment 2, 2016-2027
Figure 27: North America IT Asset Management (ITAM) Software Market Forecast (USD Billion), by Sub-Segment 3, 2016-2027
Figure 28: North America IT Asset Management (ITAM) Software Market Forecast (USD Billion), by Others, 2016-2027
Figure 29: North America IT Asset Management (ITAM) Software Market Forecast (USD Billion), by U.S., 2016-2027
Figure 30: North America IT Asset Management (ITAM) Software Market Forecast (USD Billion), by Canada, 2016-2027
Figure 31: Latin America IT Asset Management (ITAM) Software Market Value Share (%), By Segment 1, 2019 & 2027
Figure 32: Latin America IT Asset Management (ITAM) Software Market Forecast (USD Billion), by Sub-Segment 1, 2016-2027
Figure 33: Latin America IT Asset Management (ITAM) Software Market Forecast (USD Billion), by Sub-Segment 2, 2016-2027
Figure 34: Latin America IT Asset Management (ITAM) Software Market Value Share (%), By Segment 2, 2019 & 2027
Figure 35: Latin America IT Asset Management (ITAM) Software Market Forecast (USD Billion), by Sub-Segment 1, 2016-2027
Figure 36: Latin America IT Asset Management (ITAM) Software Market Forecast (USD Billion), by Sub-Segment 2, 2016-2027
Figure 37: Latin America IT Asset Management (ITAM) Software Market Forecast (USD Billion), by Sub-Segment 3, 2016-2027
Figure 38: Latin America IT Asset Management (ITAM) Software Market Forecast (USD Billion), by Others, 2016-2027
Figure 39: Latin America IT Asset Management (ITAM) Software Market Value Share (%), By Segment 3, 2019 & 2027
Figure 40: Latin America IT Asset Management (ITAM) Software Market Forecast (USD Billion), by Sub-Segment 1, 2016-2027
Figure 41: Latin America IT Asset Management (ITAM) Software Market Forecast (USD Billion), by Sub-Segment 2, 2016-2027
Figure 42: Latin America IT Asset Management (ITAM) Software Market Forecast (USD Billion), by Sub-Segment 3, 2016-2027
Figure 43: Latin America IT Asset Management (ITAM) Software Market Forecast (USD Billion), by Others, 2016-2027
Figure 44: Latin America IT Asset Management (ITAM) Software Market Forecast (USD Billion), by Brazil, 2016-2027
Figure 45: Latin America IT Asset Management (ITAM) Software Market Forecast (USD Billion), by Mexico, 2016-2027
Figure 46: Latin America IT Asset Management (ITAM) Software Market Forecast (USD Billion), by Rest of Latin America, 2016-2027
Figure 47: Europe IT Asset Management (ITAM) Software Market Value Share (%), By Segment 1, 2019 & 2027
Figure 48: Europe IT Asset Management (ITAM) Software Market Forecast (USD Billion), by Sub-Segment 1, 2016-2027
Figure 49: Europe IT Asset Management (ITAM) Software Market Forecast (USD Billion), by Sub-Segment 2, 2016-2027
Figure 50: Europe IT Asset Management (ITAM) Software Market Value Share (%), By Segment 2, 2019 & 2027
Figure 51: Europe IT Asset Management (ITAM) Software Market Forecast (USD Billion), by Sub-Segment 1, 2016-2027
Figure 52: Europe IT Asset Management (ITAM) Software Market Forecast (USD Billion), by Sub-Segment 2, 2016-2027
Figure 53: Europe IT Asset Management (ITAM) Software Market Forecast (USD Billion), by Sub-Segment 3, 2016-2027
Figure 54: Europe IT Asset Management (ITAM) Software Market Forecast (USD Billion), by Others, 2016-2027
Figure 55: Europe IT Asset Management (ITAM) Software Market Value Share (%), By Segment 3, 2019 & 2027
Figure 56: Europe IT Asset Management (ITAM) Software Market Forecast (USD Billion), by Sub-Segment 1, 2016-2027
Figure 57: Europe IT Asset Management (ITAM) Software Market Forecast (USD Billion), by Sub-Segment 2, 2016-2027
Figure 58: Europe IT Asset Management (ITAM) Software Market Forecast (USD Billion), by Sub-Segment 3, 2016-2027
Figure 59: Europe IT Asset Management (ITAM) Software Market Forecast (USD Billion), by Others, 2016-2027
Figure 60: Europe IT Asset Management (ITAM) Software Market Forecast (USD Billion), by U.K., 2016-2027
Figure 61: Europe IT Asset Management (ITAM) Software Market Forecast (USD Billion), by Germany, 2016-2027
Figure 62: Europe IT Asset Management (ITAM) Software Market Forecast (USD Billion), by France, 2016-2027
Figure 63: Europe IT Asset Management (ITAM) Software Market Forecast (USD Billion), by Italy, 2016-2027
Figure 64: Europe IT Asset Management (ITAM) Software Market Forecast (USD Billion), by Spain, 2016-2027
Figure 65: Europe IT Asset Management (ITAM) Software Market Forecast (USD Billion), by Russia, 2016-2027
Figure 66: Europe IT Asset Management (ITAM) Software Market Forecast (USD Billion), by Rest of Europe, 2016-2027
Figure 67: Asia Pacific IT Asset Management (ITAM) Software Market Value Share (%), By Segment 1, 2019 & 2027
Figure 68: Asia Pacific IT Asset Management (ITAM) Software Market Forecast (USD Billion), by Sub-Segment 1, 2016-2027
Figure 69: Asia Pacific IT Asset Management (ITAM) Software Market Forecast (USD Billion), by Sub-Segment 2, 2016-2027
Figure 70: Asia Pacific IT Asset Management (ITAM) Software Market Value Share (%), By Segment 2, 2019 & 2027
Figure 71: Asia Pacific IT Asset Management (ITAM) Software Market Forecast (USD Billion), by Sub-Segment 1, 2016-2027
Figure 72: Asia Pacific IT Asset Management (ITAM) Software Market Forecast (USD Billion), by Sub-Segment 2, 2016-2027
Figure 73: Asia Pacific IT Asset Management (ITAM) Software Market Forecast (USD Billion), by Sub-Segment 3, 2016-2027
Figure 74: Asia Pacific IT Asset Management (ITAM) Software Market Forecast (USD Billion), by Others, 2016-2027
Figure 75: Asia Pacific IT Asset Management (ITAM) Software Market Value Share (%), By Segment 3, 2019 & 2027
Figure 76: Asia Pacific IT Asset Management (ITAM) Software Market Forecast (USD Billion), by Sub-Segment 1, 2016-2027
Figure 77: Asia Pacific IT Asset Management (ITAM) Software Market Forecast (USD Billion), by Sub-Segment 2, 2016-2027
Figure 78: Asia Pacific IT Asset Management (ITAM) Software Market Forecast (USD Billion), by Sub-Segment 3, 2016-2027
Figure 79: Asia Pacific IT Asset Management (ITAM) Software Market Forecast (USD Billion), by Others, 2016-2027
Figure 80: Asia Pacific IT Asset Management (ITAM) Software Market Forecast (USD Billion), by China, 2016-2027
Figure 81: Asia Pacific IT Asset Management (ITAM) Software Market Forecast (USD Billion), by India, 2016-2027
Figure 82: Asia Pacific IT Asset Management (ITAM) Software Market Forecast (USD Billion), by Japan, 2016-2027
Figure 83: Asia Pacific IT Asset Management (ITAM) Software Market Forecast (USD Billion), by Australia, 2016-2027
Figure 84: Asia Pacific IT Asset Management (ITAM) Software Market Forecast (USD Billion), by Southeast Asia, 2016-2027
Figure 85: Asia Pacific IT Asset Management (ITAM) Software Market Forecast (USD Billion), by Rest of Asia Pacific, 2016-2027
Figure 86: Middle East & Africa IT Asset Management (ITAM) Software Market Value Share (%), By Segment 1, 2019 & 2027
Figure 87: Middle East & Africa IT Asset Management (ITAM) Software Market Forecast (USD Billion), by Sub-Segment 1, 2016-2027
Figure 88: Middle East & Africa IT Asset Management (ITAM) Software Market Forecast (USD Billion), by Sub-Segment 2, 2016-2027
Figure 89: Middle East & Africa IT Asset Management (ITAM) Software Market Value Share (%), By Segment 2, 2019 & 2027
Figure 90: Middle East & Africa IT Asset Management (ITAM) Software Market Forecast (USD Billion), by Sub-Segment 1, 2016-2027
Figure 91: Middle East & Africa IT Asset Management (ITAM) Software Market Forecast (USD Billion), by Sub-Segment 2, 2016-2027
Figure 92: Middle East & Africa IT Asset Management (ITAM) Software Market Forecast (USD Billion), by Sub-Segment 3, 2016-2027
Figure 93: Middle East & Africa IT Asset Management (ITAM) Software Market Forecast (USD Billion), by Others, 2016-2027
Figure 94: Middle East & Africa IT Asset Management (ITAM) Software Market Value Share (%), By Segment 3, 2019 & 2027
Figure 95: Middle East & Africa IT Asset Management (ITAM) Software Market Forecast (USD Billion), by Sub-Segment 1, 2016-2027
Figure 96: Middle East & Africa IT Asset Management (ITAM) Software Market Forecast (USD Billion), by Sub-Segment 2, 2016-2027
Figure 97: Middle East & Africa IT Asset Management (ITAM) Software Market Forecast (USD Billion), by Sub-Segment 3, 2016-2027
Figure 98: Middle East & Africa IT Asset Management (ITAM) Software Market Forecast (USD Billion), by Others, 2016-2027
Figure 99: Middle East & Africa IT Asset Management (ITAM) Software Market Forecast (USD Billion), by GCC, 2016-2027
Figure 100: Middle East & Africa IT Asset Management (ITAM) Software Market Forecast (USD Billion), by South Africa, 2016-2027
Figure 101: Middle East & Africa IT Asset Management (ITAM) Software Market Forecast (USD Billion), by Rest of Middle East & Africa, 2016-2027
List of Tables
Table 1: Global IT Asset Management (ITAM) Software Market Revenue (USD Billion) Forecast, by Segment 1, 2016-2027
Table 2: Global IT Asset Management (ITAM) Software Market Revenue (USD Billion) Forecast, by Segment 2, 2016-2027
Table 3: Global IT Asset Management (ITAM) Software Market Revenue (USD Billion) Forecast, by Segment 3, 2016-2027
Table 4: Global IT Asset Management (ITAM) Software Market Revenue (USD Billion) Forecast, by Region, 2016-2027
Table 5: North America IT Asset Management (ITAM) Software Market Revenue (USD Billion) Forecast, by Segment 1, 2016-2027
Table 6: North America IT Asset Management (ITAM) Software Market Revenue (USD Billion) Forecast, by Segment 2, 2016-2027
Table 7: North America IT Asset Management (ITAM) Software Market Revenue (USD Billion) Forecast, by Segment 3, 2016-2027
Table 8: North America IT Asset Management (ITAM) Software Market Revenue (USD Billion) Forecast, by Country, 2016-2027
Table 9: Europe IT Asset Management (ITAM) Software Market Revenue (USD Billion) Forecast, by Segment 1, 2016-2027
Table 10: Europe IT Asset Management (ITAM) Software Market Revenue (USD Billion) Forecast, by Segment 2, 2016-2027
Table 11: Europe IT Asset Management (ITAM) Software Market Revenue (USD Billion) Forecast, by Segment 3, 2016-2027
Table 12: Europe IT Asset Management (ITAM) Software Market Revenue (USD Billion) Forecast, by Country, 2016-2027
Table 13: Latin America IT Asset Management (ITAM) Software Market Revenue (USD Billion) Forecast, by Segment 1, 2016-2027
Table 14: Latin America IT Asset Management (ITAM) Software Market Revenue (USD Billion) Forecast, by Segment 2, 2016-2027
Table 15: Latin America IT Asset Management (ITAM) Software Market Revenue (USD Billion) Forecast, by Segment 3, 2016-2027
Table 16: Latin America IT Asset Management (ITAM) Software Market Revenue (USD Billion) Forecast, by Country, 2016-2027
Table 17: Asia Pacific IT Asset Management (ITAM) Software Market Revenue (USD Billion) Forecast, by Segment 1, 2016-2027
Table 18: Asia Pacific IT Asset Management (ITAM) Software Market Revenue (USD Billion) Forecast, by Segment 2, 2016-2027
Table 19: Asia Pacific IT Asset Management (ITAM) Software Market Revenue (USD Billion) Forecast, by Segment 3, 2016-2027
Table 20: Asia Pacific IT Asset Management (ITAM) Software Market Revenue (USD Billion) Forecast, by Country, 2016-2027
Table 21: Middle East & Africa IT Asset Management (ITAM) Software Market Revenue (USD Billion) Forecast, by Segment 1, 2016-2027
Table 22: Middle East & Africa IT Asset Management (ITAM) Software Market Revenue (USD Billion) Forecast, by Segment 2, 2016-2027
Table 23: Middle East & Africa IT Asset Management (ITAM) Software Market Revenue (USD Billion) Forecast, by Segment 3, 2016-2027
Table 24: Middle East & Africa IT Asset Management (ITAM) Software Market Revenue (USD Billion) Forecast, by Country, 2016-2027
Research Process
Data Library Research are conducted by industry experts who offer insight on
industry structure, market segmentations technology assessment and competitive landscape (CL), and penetration, as well as on emerging trends. Their analysis is based on primary interviews (~ 80%) and secondary research (~ 20%) as well as years of professional expertise in their respective industries. Adding to this, by analysing historical trends and current market positions, our analysts predict where the market will be headed for the next five years. Furthermore, the varying trends of segment & categories geographically presented are also studied and the estimated based on the primary & secondary research.
In this particular report from the supply side Data Library Research has conducted primary surveys (interviews) with the key level executives (VP, CEO’s, Marketing Director, Business Development Manager
and SOFT) of the companies that active & prominent as well as the midsized organization
FIGURE 1: DLR RESEARH PROCESS
![research-methodology1]()
Primary Research
Extensive primary research was conducted to gain a deeper insight of the market and industry performance. The analysis is based on both primary and secondary research as well as years of professional expertise in the respective industries.
In addition to analysing current and historical trends, our analysts predict where the market is headed over the next five years.
It varies by segment for these categories geographically presented in the list of market tables. Speaking about this particular report we have conducted primary surveys (interviews) with the key level executives (VP, CEO’s, Marketing Director, Business Development Manager and many more) of the major players active in the market.
Secondary Research
Secondary research was mainly used to collect and identify information useful for the extensive, technical, market-oriented, and Friend’s study of the Global Extra Neutral Alcohol. It was also used to obtain key information about major players, market classification and segmentation according to the industry trends, geographical markets, and developments related to the market and technology perspectives. For this study, analysts have gathered information from various credible sources, such as annual reports, sec filings, journals, white papers, SOFT presentations, and company web sites.
Market Size Estimation
Both, top-down and bottom-up approaches were used to estimate and validate the size of the Global market and to estimate the size of various other dependent submarkets in the overall Extra Neutral Alcohol. The key players in the market were identified through secondary research and their market contributions in the respective geographies were determined through primary and secondary research.
Forecast Model
![research-methodology2]()