Marine Stern Propulsion Systems Market Overview and Analysis
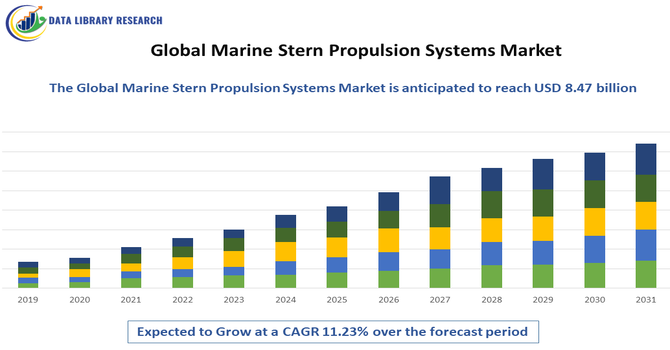
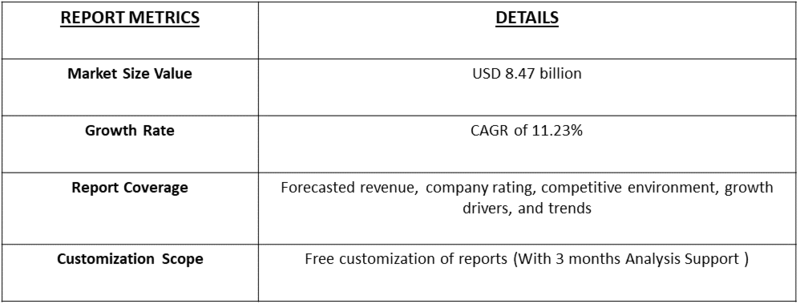
- The Global Marine Stern Propulsion Systems Market size is projected to grow from USD 4.85 billion in 2026 to USD 8.47 billion by 2033, at a CAGR of 11.23% from 2026-2033.
Get Complete Analysis Of The Report - Download Updated Free Sample PDF
The Global Marine Stern Propulsion Systems Market refers to the worldwide industry focused on producing, selling, and servicing stern propulsion systems used in marine vessels. Stern propulsion systems, including conventional shaft-driven propellers, azimuth thrusters, and pod drives, are critical for vessel maneuverability, efficiency, and performance. Growth is driven by increasing maritime trade, shipbuilding activities, demand for fuel-efficient and low-emission technologies, and advancements in automation. The market encompasses new equipment, aftermarket services, and retrofits across commercial, naval, and recreational segments.
Marine Stern Propulsion Systems Market Latest Trends
The marine stern propulsion systems market is rapidly evolving with a strong emphasis on energy efficiency and environmental compliance. Shipowners increasingly adopt hybrid and electric propulsion, azimuth thrusters, and pod drives to reduce fuel consumption and emissions under IMO regulations. Digitalization and automation are driving smart monitoring and predictive maintenance for operational reliability. There is growth in retrofit demand as older vessels upgrade for fuel savings. Demand in offshore wind support vessels, LNG carriers, and cruise ships is rising.
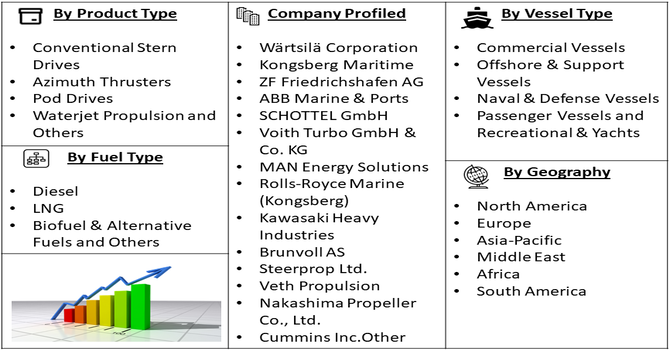
Segmentation: The Global Marine Stern Propulsion Systems Market is segmented by Propulsion Type (Conventional Stern Drives, Azimuth Thrusters, Pod Drives, Waterjet Propulsion and Others), Power Source (Mechanical Propulsion Systems, Electric Propulsion Systems, and Hybrid Propulsion Systems), Vessel Type (Commercial Vessels (Container ships, bulk carriers, tankers), Offshore & Support Vessels (FPSOs, AHTS, OSVs), Naval & Defense Vessels, Passenger Vessels and Recreational & Yachts), Fuel Type (Diesel, LNG, Biofuel & Alternative Fuels and Others), Installation Type (New Builds and Retrofits & Upgrades), and Geography (North America, Europe, Asia-Pacific, Middle East and Africa, and South America). The report provides the value (in USD million) for the above segments.
For Detailed Market Segmentation - Get a Free Sample PDF
Market Drivers:
- Growth in Global Maritime Trade
The steady expansion of global maritime trade is a major driver for the marine stern propulsion systems market. Rising demand for raw materials, energy products, and consumer goods has increased vessel traffic across international shipping routes. This growth fuels new shipbuilding activities and fleet expansion, particularly for container ships, bulk carriers, and tankers. Stern propulsion systems are critical for ensuring efficient thrust, maneuverability, and operational reliability in these vessels. As shipping companies focus on improving cargo capacity and voyage efficiency, demand for advanced and durable stern propulsion technologies continues to grow, supporting long-term market expansion worldwide.
- Demand for Fuel-Efficient and Low-Emission Systems
Increasing environmental regulations and fuel cost pressures are driving demand for fuel-efficient and low-emission marine stern propulsion systems. International Maritime Organization (IMO) norms on sulfur emissions and carbon intensity compel shipowners to adopt advanced propulsion technologies that reduce fuel consumption and greenhouse gas emissions. Modern stern propulsion systems, including hybrid and electric-assisted solutions, offer improved hydrodynamic performance and optimized power transmission. These technologies enable vessels to achieve regulatory compliance while lowering operating expenses. The push toward sustainability, coupled with advancements in propulsion design and materials, is accelerating adoption across commercial, offshore, and passenger vessel segments globally.
Market Restraints:
- High Capital and Maintenance Costs
High initial investment and maintenance costs present a key restraint for the global marine stern propulsion systems market. Advanced propulsion technologies, such as azimuth thrusters and pod drives, require substantial capital expenditure for procurement, installation, and system integration. Additionally, maintenance and repair of these complex systems demand specialized expertise and spare parts, increasing lifecycle costs. Smaller shipowners and operators in developing regions may face financial constraints, limiting adoption of advanced stern propulsion solutions. Economic uncertainties and fluctuating freight rates further discourage investment, slowing market penetration despite the long-term operational and environmental benefits of modern propulsion systems.
Socioeconomic Impact on Marine Stern Propulsion Systems Market
The marine stern propulsion systems market significantly influences global socioeconomic dynamics. It supports shipbuilding and marine engineering jobs, from manufacturing and installation to maintenance and repair. Advancements in propulsion lead to lower fuel costs, benefiting shipping companies and reducing global freight costs, which can ease inflationary pressures on traded goods. Environmentally efficient systems contribute to reduced emissions, improving port city air quality and public health. Emerging markets with expanding maritime trade see infrastructure growth and technology transfer opportunities. Investments in greener propulsion help nations meet climate goals, fostering sustainable maritime economies while stimulating innovation, workforce upskilling, and regional industrial growth.
Segmental Analysis:
- Waterjet Propulsion segment is expected to witness highest growth over the forecast period
The waterjet propulsion segment is expected to witness the highest growth over the forecast period due to its superior maneuverability, high-speed performance, and reduced underwater noise. Waterjet systems are increasingly adopted in fast ferries, patrol boats, luxury yachts, and naval vessels where shallow draft operation and enhanced safety are critical. These systems eliminate exposed propellers, reducing the risk of damage and improving operational reliability. Additionally, waterjet propulsion offers improved fuel efficiency at high speeds and supports integration with hybrid and electric powertrains. Growing demand for advanced, agile vessels and increased naval and coastal security investments are key contributors to segment growth.
- Mechanical Propulsion Systems segment is expected to witness highest growth over the forecast period
Mechanical propulsion systems are expected to witness the highest growth over the forecast period due to their proven reliability, cost-effectiveness, and widespread adoption across multiple vessel types. These systems remain the preferred choice for commercial and offshore vessels operating under demanding conditions. Mechanical propulsion offers simpler design, easier maintenance, and compatibility with conventional and alternative fuels, making it attractive for fleet operators seeking operational efficiency. Continuous advancements in gearbox technology, shaft alignment, and propeller design further enhance performance and fuel economy. Strong demand from new shipbuilding projects and retrofit applications, especially in developing maritime economies, continues to support the robust growth of mechanical propulsion systems.
- Commercial Vessels segment is expected to witness highest growth over the forecast period
The commercial vessels segment is expected to witness the highest growth over the forecast period, driven by increasing global trade, expanding port infrastructure, and rising demand for bulk and container transportation. Growth in e-commerce and industrial production has intensified shipping activity, prompting fleet expansion and modernization. Commercial vessels require reliable and efficient stern propulsion systems to ensure optimal fuel consumption, cargo handling, and operational continuity. Shipowners are also investing in propulsion upgrades to comply with stringent emission regulations and reduce operating costs. The combination of rising freight volumes, regulatory pressure, and efficiency-focused investments is accelerating demand for advanced stern propulsion systems in the commercial vessel segment.
- Biofuel & Alternative Fuels segment is expected to witness highest growth over the forecast period
The biofuel and alternative fuels segment is expected to witness the highest growth over the forecast period as the maritime industry transitions toward sustainable energy solutions. Growing environmental awareness and strict emission regulations are pushing shipowners to adopt fuels such as biofuels, LNG, methanol, and hydrogen-compatible propulsion systems. Stern propulsion systems designed for alternative fuels offer reduced carbon footprints and compliance with international standards. Advances in fuel flexibility and engine–propulsion integration enable smoother adoption across vessel types. Government incentives, pilot projects, and collaboration between fuel suppliers and shipbuilders further accelerate market growth, positioning alternative fuel-compatible propulsion systems as a key focus area.
- Retrofits & Upgrades segment is expected to witness highest growth over the forecast period
The retrofits and upgrades segment is expected to witness the highest growth over the forecast period due to the large global fleet of aging vessels requiring efficiency improvements and regulatory compliance. Retrofitting existing vessels with advanced stern propulsion systems helps shipowners reduce fuel consumption, emissions, and maintenance costs without investing in new builds. Regulatory mandates from international maritime authorities are encouraging operators to modernize propulsion systems to meet carbon intensity and sulfur emission targets. Technological advancements have made retrofitting more feasible and cost-effective. Strong economic incentives, shorter downtime solutions, and growing awareness of lifecycle cost benefits are driving robust demand in this segment.
- North American Region is expected to witness highest growth over the forecast period
The North American region is expected to witness the highest growth over the forecast period, supported by strong maritime trade, defense spending, and technological adoption. The region has a well-established shipbuilding and marine equipment manufacturing base, particularly in the United States and Canada.
Rising investments in naval modernization, offshore energy projects, and inland waterway transportation are driving demand for advanced stern propulsion systems. For instance, in January 2026, Karman Space & Defense’s $220 million acquisition of Seemann Composites and Materials Sciences is set to bolster U.S. naval modernization, enhancing capabilities in submarines and unmanned vessels. The move is expected to drive demand for advanced stern propulsion systems, accelerate innovation in high-performance marine propulsion, and strengthen the U.S. market’s position in next-generation naval propulsion technologies.
Strict environmental regulations are accelerating the adoption of fuel-efficient and low-emission propulsion technologies. Additionally, the presence of leading market players, innovation-driven R&D, and a robust retrofit market further contribute to the region’s strong growth outlook.
To Learn More About This Report - Request a Free Sample Copy
Marine Stern Propulsion Systems Market Competitive Landscape
The competitive landscape in the global marine stern propulsion systems market is marked by diverse players ranging from legacy marine equipment manufacturers to specialized technology firms. Competition centers on innovation, reliability, fuel efficiency, and after-sales services. Key firms invest heavily in R&D to launch advanced propulsion solutions that meet strict emission standards. Strategic collaborations with shipyards, technology partners, and operators help differentiate offerings. Market leaders leverage global service networks to ensure rapid support and maintenance. Pricing, customization for vessel types, and digital integration are crucial competitive factors. Mergers and acquisitions, along with regional expansion, help companies gain market share and address growing demand in commercial and defense sectors.
The major players for this market are:
- Wärtsilä Corporation
- Kongsberg Maritime
- ZF Friedrichshafen AG
- ABB Marine & Ports
- SCHOTTEL GmbH
- Voith Turbo GmbH & Co. KG
- MAN Energy Solutions
- Rolls-Royce Marine (Kongsberg)
- Kawasaki Heavy Industries
- Brunvoll AS
- Steerprop Ltd.
- Veth Propulsion
- Thrustmaster of Texas
- Hydromaster Propulsion
- Nakashima Propeller Co., Ltd.
- Cummins Inc.
- DTG Propulsion
- Italdraghe
- SJMATEK Marine Machine
- Fincantieri S.p.A.
Recent Development
- In September 2025, Lloyd’s Register awarded Approval in Principle to HD Hyundai Heavy Industries for a new Very Large Gas Carrier design featuring a forward accommodation block and integrated wind-assisted propulsion systems. Announced at Gastech 2025, the design relocated the bridge and accommodation to the bow, significantly improving the vessel’s aerodynamic profile, reducing headwind resistance, and enhancing overall propulsion efficiency.
- In June 2025, Finnish propulsion systems manufacturer Steerprop expanded its retractable thruster portfolio with the introduction of the SP 45 R, marking the company’s largest retractable thruster to date. The SP 45 R was developed to deliver enhanced station-keeping performance and additional supplemental thrust, addressing the operational requirements of vessels working in demanding and complex marine environments.
Frequently Asked Questions (FAQ) :
Q1. What are the main growth-driving factors for this market?
The primary driver is the global expansion of seaborne trade, necessitating efficient and powerful propulsion for commercial vessels. Increasing investments in naval defense and a surge in recreational boating also contribute significantly. Furthermore, the push for fuel efficiency and the integration of smart technologies in maritime logistics are accelerating system upgrades.
Q2. What are the main restraining factors for this market?
Stringent environmental regulations regarding carbon emissions and maritime pollution act as a major restraint. High initial installation costs and complex maintenance requirements for advanced stern systems can deter small-scale shipbuilders. Additionally, fluctuations in raw material prices and the high cost of transitioning to eco-friendly or hybrid propulsion technologies impact profitability.
Q3. Which segment is expected to witness high growth?
The Outboard and Sterndrive segments are expected to witness high growth, particularly within the leisure and small commercial craft categories. As marine tourism and water sports gain popularity globally, there is a rising preference for these systems due to their ease of maintenance, space-saving designs, and improved power-to-weight ratios.
Q4. Who are the top major players for this market?
The market is dominated by prominent engineering firms including Brunswick Corporation (Mercury Marine), Volvo Penta, and Yamaha Motor. Other influential players include Caterpillar, Rolls-Royce Holdings, Schottel Group, and Wärtsilä. These companies focus on technological innovation, such as joystick piloting and hybrid-electric compatibility, to maintain their competitive edge.
Q5. Which country is the largest player?
The United States stands as the largest player in this market, driven by a massive domestic recreational boating industry and significant naval expenditures. China is rapidly closing the gap due to its status as a global shipbuilding hub, but the U.S. remains the leader in terms of market value and innovation.
List of Figures
Figure 1: Global Marine Stern Propulsion Systems Market Revenue Breakdown (USD Billion, %) by Region, 2022 & 2029
Figure 2: Global Marine Stern Propulsion Systems Market Value Share (%), By Segment 1, 2022 & 2029
Figure 3: Global Marine Stern Propulsion Systems Market Forecast (USD Billion), by Sub-Segment 1, 2018-2029
Figure 4: Global Marine Stern Propulsion Systems Market Forecast (USD Billion), by Sub-Segment 2, 2018-2029
Figure 5: Global Marine Stern Propulsion Systems Market Value Share (%), By Segment 2, 2022 & 2029
Figure 6: Global Marine Stern Propulsion Systems Market Forecast (USD Billion), by Sub-Segment 1, 2018-2029
Figure 7: Global Marine Stern Propulsion Systems Market Forecast (USD Billion), by Sub-Segment 2, 2018-2029
Figure 8: Global Marine Stern Propulsion Systems Market Forecast (USD Billion), by Sub-Segment 3, 2018-2029
Figure 9: Global Marine Stern Propulsion Systems Market Forecast (USD Billion), by Others, 2018-2029
Figure 10: Global Marine Stern Propulsion Systems Market Value Share (%), By Segment 3, 2022 & 2029
Figure 11: Global Marine Stern Propulsion Systems Market Forecast (USD Billion), by Sub-Segment 1, 2018-2029
Figure 12: Global Marine Stern Propulsion Systems Market Forecast (USD Billion), by Sub-Segment 2, 2018-2029
Figure 13: Global Marine Stern Propulsion Systems Market Forecast (USD Billion), by Sub-Segment 3, 2018-2029
Figure 14: Global Marine Stern Propulsion Systems Market Forecast (USD Billion), by Others, 2018-2029
Figure 15: Global Marine Stern Propulsion Systems Market Value (USD Billion), by Region, 2022 & 2029
Figure 16: North America Marine Stern Propulsion Systems Market Value Share (%), By Segment 1, 2022 & 2029
Figure 17: North America Marine Stern Propulsion Systems Market Forecast (USD Billion), by Sub-Segment 1, 2018-2029
Figure 18: North America Marine Stern Propulsion Systems Market Forecast (USD Billion), by Sub-Segment 2, 2018-2029
Figure 19: North America Marine Stern Propulsion Systems Market Value Share (%), By Segment 2, 2022 & 2029
Figure 20: North America Marine Stern Propulsion Systems Market Forecast (USD Billion), by Sub-Segment 1, 2018-2029
Figure 21: North America Marine Stern Propulsion Systems Market Forecast (USD Billion), by Sub-Segment 2, 2018-2029
Figure 22: North America Marine Stern Propulsion Systems Market Forecast (USD Billion), by Sub-Segment 3, 2018-2029
Figure 23: North America Marine Stern Propulsion Systems Market Forecast (USD Billion), by Others, 2018-2029
Figure 24: North America Marine Stern Propulsion Systems Market Value Share (%), By Segment 3, 2022 & 2029
Figure 25: North America Marine Stern Propulsion Systems Market Forecast (USD Billion), by Sub-Segment 1, 2018-2029
Figure 26: North America Marine Stern Propulsion Systems Market Forecast (USD Billion), by Sub-Segment 2, 2018-2029
Figure 27: North America Marine Stern Propulsion Systems Market Forecast (USD Billion), by Sub-Segment 3, 2018-2029
Figure 28: North America Marine Stern Propulsion Systems Market Forecast (USD Billion), by Others, 2018-2029
Figure 29: North America Marine Stern Propulsion Systems Market Forecast (USD Billion), by U.S., 2018-2029
Figure 30: North America Marine Stern Propulsion Systems Market Forecast (USD Billion), by Canada, 2018-2029
Figure 31: Latin America Marine Stern Propulsion Systems Market Value Share (%), By Segment 1, 2022 & 2029
Figure 32: Latin America Marine Stern Propulsion Systems Market Forecast (USD Billion), by Sub-Segment 1, 2018-2029
Figure 33: Latin America Marine Stern Propulsion Systems Market Forecast (USD Billion), by Sub-Segment 2, 2018-2029
Figure 34: Latin America Marine Stern Propulsion Systems Market Value Share (%), By Segment 2, 2022 & 2029
Figure 35: Latin America Marine Stern Propulsion Systems Market Forecast (USD Billion), by Sub-Segment 1, 2018-2029
Figure 36: Latin America Marine Stern Propulsion Systems Market Forecast (USD Billion), by Sub-Segment 2, 2018-2029
Figure 37: Latin America Marine Stern Propulsion Systems Market Forecast (USD Billion), by Sub-Segment 3, 2018-2029
Figure 38: Latin America Marine Stern Propulsion Systems Market Forecast (USD Billion), by Others, 2018-2029
Figure 39: Latin America Marine Stern Propulsion Systems Market Value Share (%), By Segment 3, 2022 & 2029
Figure 40: Latin America Marine Stern Propulsion Systems Market Forecast (USD Billion), by Sub-Segment 1, 2018-2029
Figure 41: Latin America Marine Stern Propulsion Systems Market Forecast (USD Billion), by Sub-Segment 2, 2018-2029
Figure 42: Latin America Marine Stern Propulsion Systems Market Forecast (USD Billion), by Sub-Segment 3, 2018-2029
Figure 43: Latin America Marine Stern Propulsion Systems Market Forecast (USD Billion), by Others, 2018-2029
Figure 44: Latin America Marine Stern Propulsion Systems Market Forecast (USD Billion), by Brazil, 2018-2029
Figure 45: Latin America Marine Stern Propulsion Systems Market Forecast (USD Billion), by Mexico, 2018-2029
Figure 46: Latin America Marine Stern Propulsion Systems Market Forecast (USD Billion), by Rest of Latin America, 2018-2029
Figure 47: Europe Marine Stern Propulsion Systems Market Value Share (%), By Segment 1, 2022 & 2029
Figure 48: Europe Marine Stern Propulsion Systems Market Forecast (USD Billion), by Sub-Segment 1, 2018-2029
Figure 49: Europe Marine Stern Propulsion Systems Market Forecast (USD Billion), by Sub-Segment 2, 2018-2029
Figure 50: Europe Marine Stern Propulsion Systems Market Value Share (%), By Segment 2, 2022 & 2029
Figure 51: Europe Marine Stern Propulsion Systems Market Forecast (USD Billion), by Sub-Segment 1, 2018-2029
Figure 52: Europe Marine Stern Propulsion Systems Market Forecast (USD Billion), by Sub-Segment 2, 2018-2029
Figure 53: Europe Marine Stern Propulsion Systems Market Forecast (USD Billion), by Sub-Segment 3, 2018-2029
Figure 54: Europe Marine Stern Propulsion Systems Market Forecast (USD Billion), by Others, 2018-2029
Figure 55: Europe Marine Stern Propulsion Systems Market Value Share (%), By Segment 3, 2022 & 2029
Figure 56: Europe Marine Stern Propulsion Systems Market Forecast (USD Billion), by Sub-Segment 1, 2018-2029
Figure 57: Europe Marine Stern Propulsion Systems Market Forecast (USD Billion), by Sub-Segment 2, 2018-2029
Figure 58: Europe Marine Stern Propulsion Systems Market Forecast (USD Billion), by Sub-Segment 3, 2018-2029
Figure 59: Europe Marine Stern Propulsion Systems Market Forecast (USD Billion), by Others, 2018-2029
Figure 60: Europe Marine Stern Propulsion Systems Market Forecast (USD Billion), by U.K., 2018-2029
Figure 61: Europe Marine Stern Propulsion Systems Market Forecast (USD Billion), by Germany, 2018-2029
Figure 62: Europe Marine Stern Propulsion Systems Market Forecast (USD Billion), by France, 2018-2029
Figure 63: Europe Marine Stern Propulsion Systems Market Forecast (USD Billion), by Italy, 2018-2029
Figure 64: Europe Marine Stern Propulsion Systems Market Forecast (USD Billion), by Spain, 2018-2029
Figure 65: Europe Marine Stern Propulsion Systems Market Forecast (USD Billion), by Russia, 2018-2029
Figure 66: Europe Marine Stern Propulsion Systems Market Forecast (USD Billion), by Rest of Europe, 2018-2029
Figure 67: Asia Pacific Marine Stern Propulsion Systems Market Value Share (%), By Segment 1, 2022 & 2029
Figure 68: Asia Pacific Marine Stern Propulsion Systems Market Forecast (USD Billion), by Sub-Segment 1, 2018-2029
Figure 69: Asia Pacific Marine Stern Propulsion Systems Market Forecast (USD Billion), by Sub-Segment 2, 2018-2029
Figure 70: Asia Pacific Marine Stern Propulsion Systems Market Value Share (%), By Segment 2, 2022 & 2029
Figure 71: Asia Pacific Marine Stern Propulsion Systems Market Forecast (USD Billion), by Sub-Segment 1, 2018-2029
Figure 72: Asia Pacific Marine Stern Propulsion Systems Market Forecast (USD Billion), by Sub-Segment 2, 2018-2029
Figure 73: Asia Pacific Marine Stern Propulsion Systems Market Forecast (USD Billion), by Sub-Segment 3, 2018-2029
Figure 74: Asia Pacific Marine Stern Propulsion Systems Market Forecast (USD Billion), by Others, 2018-2029
Figure 75: Asia Pacific Marine Stern Propulsion Systems Market Value Share (%), By Segment 3, 2022 & 2029
Figure 76: Asia Pacific Marine Stern Propulsion Systems Market Forecast (USD Billion), by Sub-Segment 1, 2018-2029
Figure 77: Asia Pacific Marine Stern Propulsion Systems Market Forecast (USD Billion), by Sub-Segment 2, 2018-2029
Figure 78: Asia Pacific Marine Stern Propulsion Systems Market Forecast (USD Billion), by Sub-Segment 3, 2018-2029
Figure 79: Asia Pacific Marine Stern Propulsion Systems Market Forecast (USD Billion), by Others, 2018-2029
Figure 80: Asia Pacific Marine Stern Propulsion Systems Market Forecast (USD Billion), by China, 2018-2029
Figure 81: Asia Pacific Marine Stern Propulsion Systems Market Forecast (USD Billion), by India, 2018-2029
Figure 82: Asia Pacific Marine Stern Propulsion Systems Market Forecast (USD Billion), by Japan, 2018-2029
Figure 83: Asia Pacific Marine Stern Propulsion Systems Market Forecast (USD Billion), by Australia, 2018-2029
Figure 84: Asia Pacific Marine Stern Propulsion Systems Market Forecast (USD Billion), by Southeast Asia, 2018-2029
Figure 85: Asia Pacific Marine Stern Propulsion Systems Market Forecast (USD Billion), by Rest of Asia Pacific, 2018-2029
Figure 86: Middle East & Africa Marine Stern Propulsion Systems Market Value Share (%), By Segment 1, 2022 & 2029
Figure 87: Middle East & Africa Marine Stern Propulsion Systems Market Forecast (USD Billion), by Sub-Segment 1, 2018-2029
Figure 88: Middle East & Africa Marine Stern Propulsion Systems Market Forecast (USD Billion), by Sub-Segment 2, 2018-2029
Figure 89: Middle East & Africa Marine Stern Propulsion Systems Market Value Share (%), By Segment 2, 2022 & 2029
Figure 90: Middle East & Africa Marine Stern Propulsion Systems Market Forecast (USD Billion), by Sub-Segment 1, 2018-2029
Figure 91: Middle East & Africa Marine Stern Propulsion Systems Market Forecast (USD Billion), by Sub-Segment 2, 2018-2029
Figure 92: Middle East & Africa Marine Stern Propulsion Systems Market Forecast (USD Billion), by Sub-Segment 3, 2018-2029
Figure 93: Middle East & Africa Marine Stern Propulsion Systems Market Forecast (USD Billion), by Others, 2018-2029
Figure 94: Middle East & Africa Marine Stern Propulsion Systems Market Value Share (%), By Segment 3, 2022 & 2029
Figure 95: Middle East & Africa Marine Stern Propulsion Systems Market Forecast (USD Billion), by Sub-Segment 1, 2018-2029
Figure 96: Middle East & Africa Marine Stern Propulsion Systems Market Forecast (USD Billion), by Sub-Segment 2, 2018-2029
Figure 97: Middle East & Africa Marine Stern Propulsion Systems Market Forecast (USD Billion), by Sub-Segment 3, 2018-2029
Figure 98: Middle East & Africa Marine Stern Propulsion Systems Market Forecast (USD Billion), by Others, 2018-2029
Figure 99: Middle East & Africa Marine Stern Propulsion Systems Market Forecast (USD Billion), by GCC, 2018-2029
Figure 100: Middle East & Africa Marine Stern Propulsion Systems Market Forecast (USD Billion), by South Africa, 2018-2029
Figure 101: Middle East & Africa Marine Stern Propulsion Systems Market Forecast (USD Billion), by Rest of Middle East & Africa, 2018-2029
List of Tables
Table 1: Global Marine Stern Propulsion Systems Market Revenue (USD Billion) Forecast, by Segment 1, 2018-2029
Table 2: Global Marine Stern Propulsion Systems Market Revenue (USD Billion) Forecast, by Segment 2, 2018-2029
Table 3: Global Marine Stern Propulsion Systems Market Revenue (USD Billion) Forecast, by Segment 3, 2018-2029
Table 4: Global Marine Stern Propulsion Systems Market Revenue (USD Billion) Forecast, by Region, 2018-2029
Table 5: North America Marine Stern Propulsion Systems Market Revenue (USD Billion) Forecast, by Segment 1, 2018-2029
Table 6: North America Marine Stern Propulsion Systems Market Revenue (USD Billion) Forecast, by Segment 2, 2018-2029
Table 7: North America Marine Stern Propulsion Systems Market Revenue (USD Billion) Forecast, by Segment 3, 2018-2029
Table 8: North America Marine Stern Propulsion Systems Market Revenue (USD Billion) Forecast, by Country, 2018-2029
Table 9: Europe Marine Stern Propulsion Systems Market Revenue (USD Billion) Forecast, by Segment 1, 2018-2029
Table 10: Europe Marine Stern Propulsion Systems Market Revenue (USD Billion) Forecast, by Segment 2, 2018-2029
Table 11: Europe Marine Stern Propulsion Systems Market Revenue (USD Billion) Forecast, by Segment 3, 2018-2029
Table 12: Europe Marine Stern Propulsion Systems Market Revenue (USD Billion) Forecast, by Country, 2018-2029
Table 13: Latin America Marine Stern Propulsion Systems Market Revenue (USD Billion) Forecast, by Segment 1, 2018-2029
Table 14: Latin America Marine Stern Propulsion Systems Market Revenue (USD Billion) Forecast, by Segment 2, 2018-2029
Table 15: Latin America Marine Stern Propulsion Systems Market Revenue (USD Billion) Forecast, by Segment 3, 2018-2029
Table 16: Latin America Marine Stern Propulsion Systems Market Revenue (USD Billion) Forecast, by Country, 2018-2029
Table 17: Asia Pacific Marine Stern Propulsion Systems Market Revenue (USD Billion) Forecast, by Segment 1, 2018-2029
Table 18: Asia Pacific Marine Stern Propulsion Systems Market Revenue (USD Billion) Forecast, by Segment 2, 2018-2029
Table 19: Asia Pacific Marine Stern Propulsion Systems Market Revenue (USD Billion) Forecast, by Segment 3, 2018-2029
Table 20: Asia Pacific Marine Stern Propulsion Systems Market Revenue (USD Billion) Forecast, by Country, 2018-2029
Table 21: Middle East & Africa Marine Stern Propulsion Systems Market Revenue (USD Billion) Forecast, by Segment 1, 2018-2029
Table 22: Middle East & Africa Marine Stern Propulsion Systems Market Revenue (USD Billion) Forecast, by Segment 2, 2018-2029
Table 23: Middle East & Africa Marine Stern Propulsion Systems Market Revenue (USD Billion) Forecast, by Segment 3, 2018-2029
Table 24: Middle East & Africa Marine Stern Propulsion Systems Market Revenue (USD Billion) Forecast, by Country, 2018-2029
Research Process
Data Library Research are conducted by industry experts who offer insight on
industry structure, market segmentations technology assessment and competitive landscape (CL), and penetration, as well as on emerging trends. Their analysis is based on primary interviews (~ 80%) and secondary research (~ 20%) as well as years of professional expertise in their respective industries. Adding to this, by analysing historical trends and current market positions, our analysts predict where the market will be headed for the next five years. Furthermore, the varying trends of segment & categories geographically presented are also studied and the estimated based on the primary & secondary research.
In this particular report from the supply side Data Library Research has conducted primary surveys (interviews) with the key level executives (VP, CEO’s, Marketing Director, Business Development Manager
and SOFT) of the companies that active & prominent as well as the midsized organization
FIGURE 1: DLR RESEARH PROCESS
![research-methodology1]()
Primary Research
Extensive primary research was conducted to gain a deeper insight of the market and industry performance. The analysis is based on both primary and secondary research as well as years of professional expertise in the respective industries.
In addition to analysing current and historical trends, our analysts predict where the market is headed over the next five years.
It varies by segment for these categories geographically presented in the list of market tables. Speaking about this particular report we have conducted primary surveys (interviews) with the key level executives (VP, CEO’s, Marketing Director, Business Development Manager and many more) of the major players active in the market.
Secondary Research
Secondary research was mainly used to collect and identify information useful for the extensive, technical, market-oriented, and Friend’s study of the Global Extra Neutral Alcohol. It was also used to obtain key information about major players, market classification and segmentation according to the industry trends, geographical markets, and developments related to the market and technology perspectives. For this study, analysts have gathered information from various credible sources, such as annual reports, sec filings, journals, white papers, SOFT presentations, and company web sites.
Market Size Estimation
Both, top-down and bottom-up approaches were used to estimate and validate the size of the Global market and to estimate the size of various other dependent submarkets in the overall Extra Neutral Alcohol. The key players in the market were identified through secondary research and their market contributions in the respective geographies were determined through primary and secondary research.
Forecast Model
![research-methodology2]()