Medical Imaging Superconducting Magnet Market Overview and Analysis
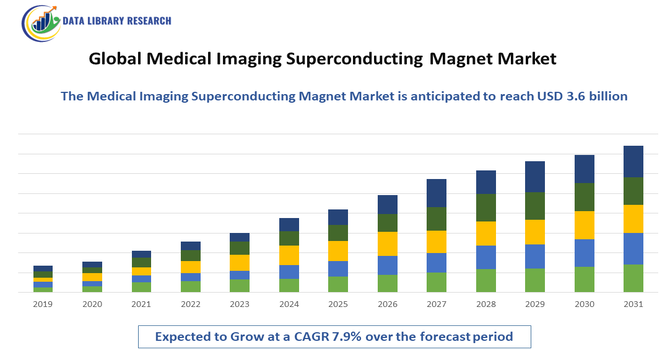
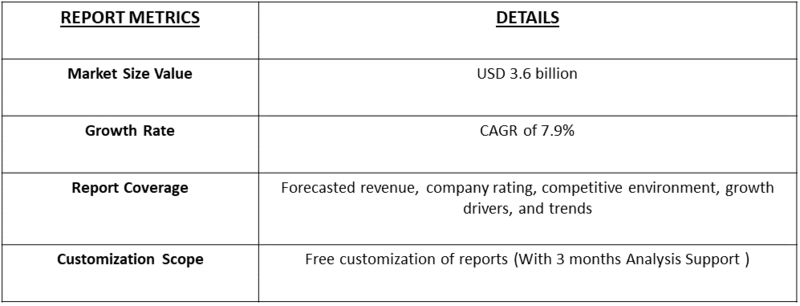
- The Global Medical Imaging Superconducting Magnet Market is forecast to reach USD 7.2 billion by 2035, up from USD 3.6 billion in 2025, growing with a CAGR of 7.9% from 2025-2032.
Get Complete Analysis Of The Report - Download Updated Free Sample PDF
The Global Medical Imaging Superconducting Magnet Market encompasses the market for superconducting magnets used in medical imaging devices—primarily magnetic resonance imaging (MRI) systems. These magnets employ superconducting wire cooled to cryogenic temperatures to generate intense, stable magnetic fields, enabling high resolution, non invasive diagnostics of internal body structures.
The Global Medical Imaging Superconducting Magnet Market is being driven by several key factors. One major driver is the rising prevalence of chronic diseases—such as cancer, neurological disorders and cardiovascular conditions—which increases demand for advanced diagnostic tools like MRI systems that rely on superconducting magnets. Another driver is the steady expansion and modernization of healthcare infrastructure worldwide, particularly in emerging markets, where governments and private providers are investing heavily in high field imaging systems and upgrading facilities.
Medical Imaging Superconducting Magnet Market Trends
The global medical imaging superconducting magnet market is seeing key trends: manufacturers are shifting toward helium free or reduced helium cryogenic systems, improving sustainability and cutting operational costs. There’s a strong move toward higher field magnets (3 T and above), especially for advanced diagnostics in neurology and oncology. Additionally, another trend is the rise of compact and outpatient suitable MRI systems equipped with superconducting magnets, enabling broader deployment beyond traditional hospital settings and expanding access to advanced imaging.
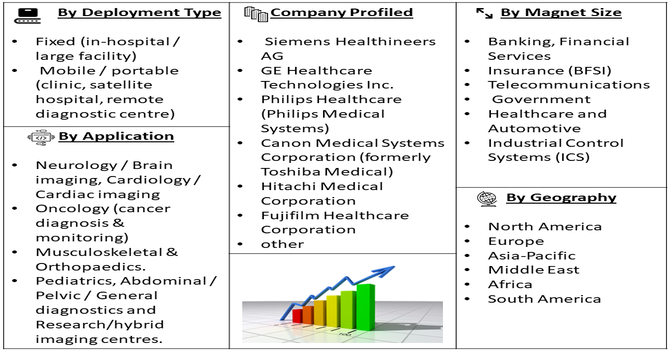
Segmentation: The Global Medical Imaging Superconducting Magnet Market is Segmented Field Strength (0.5 Tesla – 1.0 Tesla, 1.5 Tesla (widely used mainstream clinical systems) and 3 Tesla (high-field systems)), Application (Neurology / Brain imaging, Cardiology / Cardiac imaging, Oncology (cancer diagnosis & monitoring), Musculoskeletal & Orthopaedics, Pediatrics, Abdominal / Pelvic / General diagnostics and Research/hybrid imaging centres), Deployment Type (Fixed (in-hospital / large facility) and Mobile / portable (clinic, satellite hospital, remote diagnostic centre)), Magnet Size (Standard bore (e.g., 60cm etc), Wide-bore and Extremity / dedicated magnets), Technology (Helium‐cooled vs helium‐free, and Cryogen cooling type) and Geography (North America, Europe, Asia-Pacific, Middle East and Africa, and South America). The report provides the value (in USD million) for the above segments.
For Detailed Market Segmentation - Get a Free Sample PDF
Market Drivers:
- Rising Prevalence of Chronic and Neurological Diseases
The growing incidence of chronic and neurological disorders such as cancer, stroke, and multiple sclerosis is significantly driving demand for advanced diagnostic imaging technologies. MRI systems equipped with superconducting magnets enable high-resolution, non-invasive imaging crucial for early disease detection and treatment planning.
As global healthcare systems shift toward preventive and precision medicine, the need for accurate imaging tools continues to expand. For instance, in September 2025, hospitals in Bengaluru reported that among all stroke cases, youngsters now account for about 15 %–20 %, up from roughly 10 % five years ago. This shift signals growing demand for advanced diagnostic imaging — particularly MRI systems with superconducting magnets. As younger patients increasingly require rapid, high resolution scans, the global medical imaging superconducting magnet market stands to benefit from higher utilization, broader installation of MRI systems, and accelerated upgrades to meet this changing clinical profile.
- Technological Advancements in Superconducting Magnet Design
Continuous advancements in magnet design and superconducting materials are propelling market growth by enhancing imaging performance and operational efficiency. Developments such as helium-free cryogenic cooling, compact magnet geometries, and high-temperature superconductors (HTS) have lowered operating costs and expanded installation feasibility in smaller healthcare facilities. For instance, in March 2020, Bruker Corporation and Fujikura Ltd., long-time collaborators in superconductivity technology, achieved a major breakthrough when Fujikura successfully manufactured an ultra-high-field superconducting magnet for 1.2 GHz high-resolution NMR, using rare-earth high-temperature superconducting wire. This 28.2 Tesla magnet set a new world record for NMR systems. The achievement advanced global innovation in superconducting magnet design, driving progress toward higher-field, more efficient MRI technologies in the global medical imaging superconducting magnet market. These innovations address long-standing challenges related to maintenance and helium scarcity, making MRI technology more sustainable and cost-effective.
Market Restraint:
- High Manufacturing and Maintenance Costs
Despite strong demand, the high cost associated with manufacturing and maintaining superconducting magnets remains a major restraint to market growth. These systems require expensive superconducting materials like niobium-titanium and complex cryogenic cooling systems that significantly increase upfront capital investment. In addition, installation demands specialized infrastructure and technical expertise, particularly for high-field magnets. Operational expenses related to liquid helium refilling, servicing, and periodic calibration further burden healthcare providers, especially in cost-sensitive or resource-limited regions.
Socio Economic Impact on Medical Imaging Superconducting Magnet Market
The global medical imaging superconducting magnet market exerts a substantial socioeconomic impact by enhancing healthcare quality, stimulating technological innovation, and contributing to economic growth. Wider adoption of MRI systems powered by superconducting magnets improves early disease detection, reduces treatment costs, and enhances patient outcomes—particularly for neurological and oncological conditions. This leads to healthier populations and lower long-term healthcare burdens. Economically, the market supports high-value manufacturing, research collaborations, and skilled employment across engineering, materials science, and medical technology sectors.
Segmental Analysis:
- 1.5 Tesla (widely used mainstream clinical systems) Segment is Expected to Witness Significant Growth Over the Forecast Period
The 1.5 Tesla (1.5T) segment, despite the rise of 3T systems, is expected to maintain and witness significant growth because it represents the ideal balance of clinical utility, cost-effectiveness, and established reliability. The 1.5T field strength is sufficient for the vast majority of routine clinical examinations, including musculoskeletal, neurological, and abdominal imaging. Its affordability and lower site installation costs compared to 3T systems make it the preferred choice for hospitals and diagnostic centers in emerging economies and for replacement cycles in established markets, ensuring its continued dominance in terms of installed base.
- Oncology (cancer diagnosis & monitoring) Segment is Expected to Witness Significant Growth Over the Forecast Period
The Oncology (cancer diagnosis & monitoring) segment is poised for massive growth due to the rising global incidence of various cancers and the increasing demand for early, precise, and non-invasive detection. MRI, powered by superconducting magnets, offers superior soft-tissue contrast, making it crucial for tumor staging, treatment planning (e.g., radiotherapy), and monitoring treatment efficacy. The trend towards personalized medicine mandates highly detailed imaging, often achieved with advanced sequences on 3T magnets, driving continuous investment in the superconducting magnet technology dedicated to fighting cancer.
- Mobile / portable Segment is Expected to Witness Significant Growth Over the Forecast Period
The Mobile / Portable segment is expected to see significant growth, driven by the increasing demand for accessible and convenient point-of-care diagnostics. Utilizing specialized, often lower-field superconducting magnet designs, these systems allow imaging services to be delivered to patients in remote areas, long-term care facilities, or a patient's bedside within the hospital, reducing the need for patient transport. This trend aligns with the global shift towards decentralized healthcare and is heavily supported by advancements in miniaturization and connectivity.
- Standard bore (e.g., 60cm etc) Segment is Expected to Witness Significant Growth Over the Forecast Period
The Standard Bore (e.g., 60cm) segment will witness significant growth because it remains the industry standard for high-field, closed MRI systems. The standard bore design efficiently utilizes the superconducting magnet to generate a high, uniform field strength (like 1.5T and 3T), which is critical for superior image resolution, faster scanning times, and supporting advanced imaging sequences. While wide-bore systems cater to patient comfort, the standard bore is essential for maintaining the highest clinical performance and throughput required by major diagnostic centers and large hospitals worldwide.
- Cryogen cooling type Segment is Expected to Witness Significant Growth Over the Forecast Period
The segment encompassing cryogen-free or reduced-cryogen cooling types is expected to witness the most significant growth. While traditional systems rely heavily on expensive, scarce, and volatile liquid helium, modern systems are integrating cryocoolers and more advanced magnet designs to drastically reduce or eliminate the need for liquid helium over the magnet's lifespan. This innovation lowers operational costs, simplifies installation, and improves system reliability, making advanced MRI technology more viable for facilities globally, especially in regions facing supply chain challenges.
- North America Region is Expected to Witness Significant Growth Over the Forecast Period
The North America Region is expected to witness significant growth, driven by its highly advanced healthcare infrastructure, high healthcare expenditure, and robust adoption of cutting-edge technology. The region has a high installed base and replacement demand, coupled with favorable reimbursement policies that support the purchase of expensive high-field 3T systems. Furthermore, the strong presence of major medical imaging OEMs and a concentrated focus on integrating AI and advanced diagnostic protocols ensure continuous, high-value investment in superconducting magnet technology.
In November 2022, Royal Philips, a global leader in health technology, entered a research partnership with U.S.-based MagCorp to develop superconducting magnets for MRI scanners that operate without liquid helium cooling. This collaboration focused on high-temperature superconductors to create more affordable, compact, and sustainable MRI systems. The initiative strengthened North America’s medical imaging superconducting magnet market by accelerating innovation, reducing operational costs, and expanding access to advanced MRI technology across diverse healthcare settings.
Thus, all such factors are fuelling the growth of above market.
To Learn More About This Report - Request a Free Sample Copy
Medical Imaging Superconducting Magnet Market Competitive Analysis
The competitive landscape of the global medical-imaging superconducting magnet market is notably highly contested and technologically driven. Major integrated players such as Siemens Healthineers, GE Healthcare and Philips Healthcare dominate through their extensive MRI platforms, in-house magnet manufacturing capabilities and strong global service networks. At the same time, regional and independent magnet suppliers—especially in Asia—are gaining foothold by offering cost-competitive alternatives and focusing on less mature markets, increasing pressure on pricing and forcing innovation.
The major players for above market
- Siemens Healthineers AG
- GE Healthcare Technologies Inc.
- Philips Healthcare (Philips Medical Systems)
- Canon Medical Systems Corporation (formerly Toshiba Medical)
- Hitachi Medical Corporation
- Fujifilm Healthcare Corporation
- Neusoft Medical Systems Co., Ltd.
- United Imaging Healthcare Co., Ltd.
- Bruker Corporation
- Oxford Instruments plc
- Japan Superconductor Technology Inc. (JASTEC)
- Ningbo Jansen Superconducting Technologies Co., Ltd.
- Western Superconducting Technologies Co., Ltd.
- Alltech Medical Systems America Inc.
- Aurora Imaging Technology Inc.
- American Magnetics Inc.
- Cryomagnetics Inc.
- Scientific Magnetics Ltd.
- Shanghai ChenGuang Medical Technologies Co., Ltd.
- Yangzhou Kindsway Biotech Co., Ltd.
Recent Development
- In September 2025, The Society for Applied Microwave Electronics Engineering & Research (SAMEER) and the All India Institute of Medical Sciences (AIIMS), New Delhi, signed an MoU on the 32nd Foundation Day of AIIMS’ Department of NMR to collaborate on developing high-field and low-field MRI/NMR systems and advancing RF and microwave technologies for medical use. This partnership strengthened India’s capabilities in indigenous MRI magnet research, fostering innovation and competitiveness in the global medical imaging superconducting magnet market.
- In April 2025, Paras Defence & Space Technologies Limited, a leading Indian defence engineering firm, announced its key contribution to developing India’s first indigenous MRI machine as part of a consortium led by the Society for Applied Microwave Electronics Engineering and Research (SAMEER) under the Ministry of Electronics and Information Technology. This milestone advanced India’s self-reliance in high-end medical technology, reducing import dependency and enhancing global competition and innovation in the medical imaging superconducting magnet market.
Frequently Asked Questions (FAQ) :
Q1. What the main growth driving factors for this market?
The market's growth is primarily fueled by the rising global prevalence of chronic diseases such as cancer, neurological, and cardiovascular disorders, which necessitate highly accurate diagnostic imaging. Superconducting magnets are the core component of high-resolution Magnetic Resonance Imaging (MRI) systems, crucial for early and precise disease detection. Furthermore, continuous technological advancements in diagnostic equipment, including the development of higher-field strength (3T and above) and helium-free MRI systems, are enhancing image quality and reducing operational complexity, thereby boosting adoption across healthcare settings.
Q2. What are the main restraining factors for this market?
The major restraint is the extremely high capital and operational cost of superconducting magnet-based MRI systems. These high costs include not only the purchase price but also expensive infrastructure requirements, specialized shielding, and ongoing maintenance. Furthermore, the traditional reliance on liquid helium for cooling superconducting magnets creates a significant challenge due to the scarcity and rising price of helium, which increases the total cost of ownership, particularly in lower-income regions with limited funding for advanced medical equipment.
Q3. Which segment is expected to witness high growth?
The 3 Tesla (3T) Superconducting Magnet segment is expected to witness high growth. While the 1.5T magnet is the current industry workhorse, 3T systems offer superior image resolution and a significantly higher signal-to-noise ratio (SNR), making them increasingly preferred for advanced and complex diagnostics, such as detailed neurological, cardiac, and oncology imaging. The continuous technological push toward higher field strengths for improved diagnostic accuracy and the high volume of research in these areas are fueling the demand for new 3T installations and upgrades.
Q4. Who are the top major players for this market?
The market is dominated by a few global medical device and technology conglomerates that manufacture and integrate these complex systems. The top major players include Siemens Healthineers, GE Healthcare Technologies, Inc., and Koninklijke Philips N.V. These companies not only produce the MRI scanners but also invest heavily in the underlying magnet technology, often partnering with specialized magnet manufacturers. Emerging players like United Imaging Healthcare are also significantly increasing their market share through technological breakthroughs and aggressive expansion.
Q5. Which country is the largest player?
North America, specifically the United States, currently holds the largest market share in terms of revenue for advanced Medical Imaging Superconducting Magnets. This dominance is due to a well-established, capital-intensive healthcare infrastructure, high adoption rates of cutting-edge diagnostic technologies (like 3T MRI), and significant investment in medical research and development. However, the Asia-Pacific region, led by rapid growth in China, is the fastest-growing market, fueled by massive government investments to expand healthcare access and rapidly increase the installation volume of MRI systems.
List of Figures
Figure 1: Global Medical Imaging Superconducting Magnet Market Revenue Breakdown (USD Billion, %) by Region, 2022 & 2029
Figure 2: Global Medical Imaging Superconducting Magnet Market Value Share (%), By Segment 1, 2022 & 2029
Figure 3: Global Medical Imaging Superconducting Magnet Market Forecast (USD Billion), by Sub-Segment 1, 2018-2029
Figure 4: Global Medical Imaging Superconducting Magnet Market Forecast (USD Billion), by Sub-Segment 2, 2018-2029
Figure 5: Global Medical Imaging Superconducting Magnet Market Value Share (%), By Segment 2, 2022 & 2029
Figure 6: Global Medical Imaging Superconducting Magnet Market Forecast (USD Billion), by Sub-Segment 1, 2018-2029
Figure 7: Global Medical Imaging Superconducting Magnet Market Forecast (USD Billion), by Sub-Segment 2, 2018-2029
Figure 8: Global Medical Imaging Superconducting Magnet Market Forecast (USD Billion), by Sub-Segment 3, 2018-2029
Figure 9: Global Medical Imaging Superconducting Magnet Market Forecast (USD Billion), by Others, 2018-2029
Figure 10: Global Medical Imaging Superconducting Magnet Market Value Share (%), By Segment 3, 2022 & 2029
Figure 11: Global Medical Imaging Superconducting Magnet Market Forecast (USD Billion), by Sub-Segment 1, 2018-2029
Figure 12: Global Medical Imaging Superconducting Magnet Market Forecast (USD Billion), by Sub-Segment 2, 2018-2029
Figure 13: Global Medical Imaging Superconducting Magnet Market Forecast (USD Billion), by Sub-Segment 3, 2018-2029
Figure 14: Global Medical Imaging Superconducting Magnet Market Forecast (USD Billion), by Others, 2018-2029
Figure 15: Global Medical Imaging Superconducting Magnet Market Value (USD Billion), by Region, 2022 & 2029
Figure 16: North America Medical Imaging Superconducting Magnet Market Value Share (%), By Segment 1, 2022 & 2029
Figure 17: North America Medical Imaging Superconducting Magnet Market Forecast (USD Billion), by Sub-Segment 1, 2018-2029
Figure 18: North America Medical Imaging Superconducting Magnet Market Forecast (USD Billion), by Sub-Segment 2, 2018-2029
Figure 19: North America Medical Imaging Superconducting Magnet Market Value Share (%), By Segment 2, 2022 & 2029
Figure 20: North America Medical Imaging Superconducting Magnet Market Forecast (USD Billion), by Sub-Segment 1, 2018-2029
Figure 21: North America Medical Imaging Superconducting Magnet Market Forecast (USD Billion), by Sub-Segment 2, 2018-2029
Figure 22: North America Medical Imaging Superconducting Magnet Market Forecast (USD Billion), by Sub-Segment 3, 2018-2029
Figure 23: North America Medical Imaging Superconducting Magnet Market Forecast (USD Billion), by Others, 2018-2029
Figure 24: North America Medical Imaging Superconducting Magnet Market Value Share (%), By Segment 3, 2022 & 2029
Figure 25: North America Medical Imaging Superconducting Magnet Market Forecast (USD Billion), by Sub-Segment 1, 2018-2029
Figure 26: North America Medical Imaging Superconducting Magnet Market Forecast (USD Billion), by Sub-Segment 2, 2018-2029
Figure 27: North America Medical Imaging Superconducting Magnet Market Forecast (USD Billion), by Sub-Segment 3, 2018-2029
Figure 28: North America Medical Imaging Superconducting Magnet Market Forecast (USD Billion), by Others, 2018-2029
Figure 29: North America Medical Imaging Superconducting Magnet Market Forecast (USD Billion), by U.S., 2018-2029
Figure 30: North America Medical Imaging Superconducting Magnet Market Forecast (USD Billion), by Canada, 2018-2029
Figure 31: Latin America Medical Imaging Superconducting Magnet Market Value Share (%), By Segment 1, 2022 & 2029
Figure 32: Latin America Medical Imaging Superconducting Magnet Market Forecast (USD Billion), by Sub-Segment 1, 2018-2029
Figure 33: Latin America Medical Imaging Superconducting Magnet Market Forecast (USD Billion), by Sub-Segment 2, 2018-2029
Figure 34: Latin America Medical Imaging Superconducting Magnet Market Value Share (%), By Segment 2, 2022 & 2029
Figure 35: Latin America Medical Imaging Superconducting Magnet Market Forecast (USD Billion), by Sub-Segment 1, 2018-2029
Figure 36: Latin America Medical Imaging Superconducting Magnet Market Forecast (USD Billion), by Sub-Segment 2, 2018-2029
Figure 37: Latin America Medical Imaging Superconducting Magnet Market Forecast (USD Billion), by Sub-Segment 3, 2018-2029
Figure 38: Latin America Medical Imaging Superconducting Magnet Market Forecast (USD Billion), by Others, 2018-2029
Figure 39: Latin America Medical Imaging Superconducting Magnet Market Value Share (%), By Segment 3, 2022 & 2029
Figure 40: Latin America Medical Imaging Superconducting Magnet Market Forecast (USD Billion), by Sub-Segment 1, 2018-2029
Figure 41: Latin America Medical Imaging Superconducting Magnet Market Forecast (USD Billion), by Sub-Segment 2, 2018-2029
Figure 42: Latin America Medical Imaging Superconducting Magnet Market Forecast (USD Billion), by Sub-Segment 3, 2018-2029
Figure 43: Latin America Medical Imaging Superconducting Magnet Market Forecast (USD Billion), by Others, 2018-2029
Figure 44: Latin America Medical Imaging Superconducting Magnet Market Forecast (USD Billion), by Brazil, 2018-2029
Figure 45: Latin America Medical Imaging Superconducting Magnet Market Forecast (USD Billion), by Mexico, 2018-2029
Figure 46: Latin America Medical Imaging Superconducting Magnet Market Forecast (USD Billion), by Rest of Latin America, 2018-2029
Figure 47: Europe Medical Imaging Superconducting Magnet Market Value Share (%), By Segment 1, 2022 & 2029
Figure 48: Europe Medical Imaging Superconducting Magnet Market Forecast (USD Billion), by Sub-Segment 1, 2018-2029
Figure 49: Europe Medical Imaging Superconducting Magnet Market Forecast (USD Billion), by Sub-Segment 2, 2018-2029
Figure 50: Europe Medical Imaging Superconducting Magnet Market Value Share (%), By Segment 2, 2022 & 2029
Figure 51: Europe Medical Imaging Superconducting Magnet Market Forecast (USD Billion), by Sub-Segment 1, 2018-2029
Figure 52: Europe Medical Imaging Superconducting Magnet Market Forecast (USD Billion), by Sub-Segment 2, 2018-2029
Figure 53: Europe Medical Imaging Superconducting Magnet Market Forecast (USD Billion), by Sub-Segment 3, 2018-2029
Figure 54: Europe Medical Imaging Superconducting Magnet Market Forecast (USD Billion), by Others, 2018-2029
Figure 55: Europe Medical Imaging Superconducting Magnet Market Value Share (%), By Segment 3, 2022 & 2029
Figure 56: Europe Medical Imaging Superconducting Magnet Market Forecast (USD Billion), by Sub-Segment 1, 2018-2029
Figure 57: Europe Medical Imaging Superconducting Magnet Market Forecast (USD Billion), by Sub-Segment 2, 2018-2029
Figure 58: Europe Medical Imaging Superconducting Magnet Market Forecast (USD Billion), by Sub-Segment 3, 2018-2029
Figure 59: Europe Medical Imaging Superconducting Magnet Market Forecast (USD Billion), by Others, 2018-2029
Figure 60: Europe Medical Imaging Superconducting Magnet Market Forecast (USD Billion), by U.K., 2018-2029
Figure 61: Europe Medical Imaging Superconducting Magnet Market Forecast (USD Billion), by Germany, 2018-2029
Figure 62: Europe Medical Imaging Superconducting Magnet Market Forecast (USD Billion), by France, 2018-2029
Figure 63: Europe Medical Imaging Superconducting Magnet Market Forecast (USD Billion), by Italy, 2018-2029
Figure 64: Europe Medical Imaging Superconducting Magnet Market Forecast (USD Billion), by Spain, 2018-2029
Figure 65: Europe Medical Imaging Superconducting Magnet Market Forecast (USD Billion), by Russia, 2018-2029
Figure 66: Europe Medical Imaging Superconducting Magnet Market Forecast (USD Billion), by Rest of Europe, 2018-2029
Figure 67: Asia Pacific Medical Imaging Superconducting Magnet Market Value Share (%), By Segment 1, 2022 & 2029
Figure 68: Asia Pacific Medical Imaging Superconducting Magnet Market Forecast (USD Billion), by Sub-Segment 1, 2018-2029
Figure 69: Asia Pacific Medical Imaging Superconducting Magnet Market Forecast (USD Billion), by Sub-Segment 2, 2018-2029
Figure 70: Asia Pacific Medical Imaging Superconducting Magnet Market Value Share (%), By Segment 2, 2022 & 2029
Figure 71: Asia Pacific Medical Imaging Superconducting Magnet Market Forecast (USD Billion), by Sub-Segment 1, 2018-2029
Figure 72: Asia Pacific Medical Imaging Superconducting Magnet Market Forecast (USD Billion), by Sub-Segment 2, 2018-2029
Figure 73: Asia Pacific Medical Imaging Superconducting Magnet Market Forecast (USD Billion), by Sub-Segment 3, 2018-2029
Figure 74: Asia Pacific Medical Imaging Superconducting Magnet Market Forecast (USD Billion), by Others, 2018-2029
Figure 75: Asia Pacific Medical Imaging Superconducting Magnet Market Value Share (%), By Segment 3, 2022 & 2029
Figure 76: Asia Pacific Medical Imaging Superconducting Magnet Market Forecast (USD Billion), by Sub-Segment 1, 2018-2029
Figure 77: Asia Pacific Medical Imaging Superconducting Magnet Market Forecast (USD Billion), by Sub-Segment 2, 2018-2029
Figure 78: Asia Pacific Medical Imaging Superconducting Magnet Market Forecast (USD Billion), by Sub-Segment 3, 2018-2029
Figure 79: Asia Pacific Medical Imaging Superconducting Magnet Market Forecast (USD Billion), by Others, 2018-2029
Figure 80: Asia Pacific Medical Imaging Superconducting Magnet Market Forecast (USD Billion), by China, 2018-2029
Figure 81: Asia Pacific Medical Imaging Superconducting Magnet Market Forecast (USD Billion), by India, 2018-2029
Figure 82: Asia Pacific Medical Imaging Superconducting Magnet Market Forecast (USD Billion), by Japan, 2018-2029
Figure 83: Asia Pacific Medical Imaging Superconducting Magnet Market Forecast (USD Billion), by Australia, 2018-2029
Figure 84: Asia Pacific Medical Imaging Superconducting Magnet Market Forecast (USD Billion), by Southeast Asia, 2018-2029
Figure 85: Asia Pacific Medical Imaging Superconducting Magnet Market Forecast (USD Billion), by Rest of Asia Pacific, 2018-2029
Figure 86: Middle East & Africa Medical Imaging Superconducting Magnet Market Value Share (%), By Segment 1, 2022 & 2029
Figure 87: Middle East & Africa Medical Imaging Superconducting Magnet Market Forecast (USD Billion), by Sub-Segment 1, 2018-2029
Figure 88: Middle East & Africa Medical Imaging Superconducting Magnet Market Forecast (USD Billion), by Sub-Segment 2, 2018-2029
Figure 89: Middle East & Africa Medical Imaging Superconducting Magnet Market Value Share (%), By Segment 2, 2022 & 2029
Figure 90: Middle East & Africa Medical Imaging Superconducting Magnet Market Forecast (USD Billion), by Sub-Segment 1, 2018-2029
Figure 91: Middle East & Africa Medical Imaging Superconducting Magnet Market Forecast (USD Billion), by Sub-Segment 2, 2018-2029
Figure 92: Middle East & Africa Medical Imaging Superconducting Magnet Market Forecast (USD Billion), by Sub-Segment 3, 2018-2029
Figure 93: Middle East & Africa Medical Imaging Superconducting Magnet Market Forecast (USD Billion), by Others, 2018-2029
Figure 94: Middle East & Africa Medical Imaging Superconducting Magnet Market Value Share (%), By Segment 3, 2022 & 2029
Figure 95: Middle East & Africa Medical Imaging Superconducting Magnet Market Forecast (USD Billion), by Sub-Segment 1, 2018-2029
Figure 96: Middle East & Africa Medical Imaging Superconducting Magnet Market Forecast (USD Billion), by Sub-Segment 2, 2018-2029
Figure 97: Middle East & Africa Medical Imaging Superconducting Magnet Market Forecast (USD Billion), by Sub-Segment 3, 2018-2029
Figure 98: Middle East & Africa Medical Imaging Superconducting Magnet Market Forecast (USD Billion), by Others, 2018-2029
Figure 99: Middle East & Africa Medical Imaging Superconducting Magnet Market Forecast (USD Billion), by GCC, 2018-2029
Figure 100: Middle East & Africa Medical Imaging Superconducting Magnet Market Forecast (USD Billion), by South Africa, 2018-2029
Figure 101: Middle East & Africa Medical Imaging Superconducting Magnet Market Forecast (USD Billion), by Rest of Middle East & Africa, 2018-2029
List of Tables
Table 1: Global Medical Imaging Superconducting Magnet Market Revenue (USD Billion) Forecast, by Segment 1, 2018-2029
Table 2: Global Medical Imaging Superconducting Magnet Market Revenue (USD Billion) Forecast, by Segment 2, 2018-2029
Table 3: Global Medical Imaging Superconducting Magnet Market Revenue (USD Billion) Forecast, by Segment 3, 2018-2029
Table 4: Global Medical Imaging Superconducting Magnet Market Revenue (USD Billion) Forecast, by Region, 2018-2029
Table 5: North America Medical Imaging Superconducting Magnet Market Revenue (USD Billion) Forecast, by Segment 1, 2018-2029
Table 6: North America Medical Imaging Superconducting Magnet Market Revenue (USD Billion) Forecast, by Segment 2, 2018-2029
Table 7: North America Medical Imaging Superconducting Magnet Market Revenue (USD Billion) Forecast, by Segment 3, 2018-2029
Table 8: North America Medical Imaging Superconducting Magnet Market Revenue (USD Billion) Forecast, by Country, 2018-2029
Table 9: Europe Medical Imaging Superconducting Magnet Market Revenue (USD Billion) Forecast, by Segment 1, 2018-2029
Table 10: Europe Medical Imaging Superconducting Magnet Market Revenue (USD Billion) Forecast, by Segment 2, 2018-2029
Table 11: Europe Medical Imaging Superconducting Magnet Market Revenue (USD Billion) Forecast, by Segment 3, 2018-2029
Table 12: Europe Medical Imaging Superconducting Magnet Market Revenue (USD Billion) Forecast, by Country, 2018-2029
Table 13: Latin America Medical Imaging Superconducting Magnet Market Revenue (USD Billion) Forecast, by Segment 1, 2018-2029
Table 14: Latin America Medical Imaging Superconducting Magnet Market Revenue (USD Billion) Forecast, by Segment 2, 2018-2029
Table 15: Latin America Medical Imaging Superconducting Magnet Market Revenue (USD Billion) Forecast, by Segment 3, 2018-2029
Table 16: Latin America Medical Imaging Superconducting Magnet Market Revenue (USD Billion) Forecast, by Country, 2018-2029
Table 17: Asia Pacific Medical Imaging Superconducting Magnet Market Revenue (USD Billion) Forecast, by Segment 1, 2018-2029
Table 18: Asia Pacific Medical Imaging Superconducting Magnet Market Revenue (USD Billion) Forecast, by Segment 2, 2018-2029
Table 19: Asia Pacific Medical Imaging Superconducting Magnet Market Revenue (USD Billion) Forecast, by Segment 3, 2018-2029
Table 20: Asia Pacific Medical Imaging Superconducting Magnet Market Revenue (USD Billion) Forecast, by Country, 2018-2029
Table 21: Middle East & Africa Medical Imaging Superconducting Magnet Market Revenue (USD Billion) Forecast, by Segment 1, 2018-2029
Table 22: Middle East & Africa Medical Imaging Superconducting Magnet Market Revenue (USD Billion) Forecast, by Segment 2, 2018-2029
Table 23: Middle East & Africa Medical Imaging Superconducting Magnet Market Revenue (USD Billion) Forecast, by Segment 3, 2018-2029
Table 24: Middle East & Africa Medical Imaging Superconducting Magnet Market Revenue (USD Billion) Forecast, by Country, 2018-2029
Research Process
Data Library Research are conducted by industry experts who offer insight on
industry structure, market segmentations technology assessment and competitive landscape (CL), and penetration, as well as on emerging trends. Their analysis is based on primary interviews (~ 80%) and secondary research (~ 20%) as well as years of professional expertise in their respective industries. Adding to this, by analysing historical trends and current market positions, our analysts predict where the market will be headed for the next five years. Furthermore, the varying trends of segment & categories geographically presented are also studied and the estimated based on the primary & secondary research.
In this particular report from the supply side Data Library Research has conducted primary surveys (interviews) with the key level executives (VP, CEO’s, Marketing Director, Business Development Manager
and SOFT) of the companies that active & prominent as well as the midsized organization
FIGURE 1: DLR RESEARH PROCESS
![research-methodology1]()
Primary Research
Extensive primary research was conducted to gain a deeper insight of the market and industry performance. The analysis is based on both primary and secondary research as well as years of professional expertise in the respective industries.
In addition to analysing current and historical trends, our analysts predict where the market is headed over the next five years.
It varies by segment for these categories geographically presented in the list of market tables. Speaking about this particular report we have conducted primary surveys (interviews) with the key level executives (VP, CEO’s, Marketing Director, Business Development Manager and many more) of the major players active in the market.
Secondary Research
Secondary research was mainly used to collect and identify information useful for the extensive, technical, market-oriented, and Friend’s study of the Global Extra Neutral Alcohol. It was also used to obtain key information about major players, market classification and segmentation according to the industry trends, geographical markets, and developments related to the market and technology perspectives. For this study, analysts have gathered information from various credible sources, such as annual reports, sec filings, journals, white papers, SOFT presentations, and company web sites.
Market Size Estimation
Both, top-down and bottom-up approaches were used to estimate and validate the size of the Global market and to estimate the size of various other dependent submarkets in the overall Extra Neutral Alcohol. The key players in the market were identified through secondary research and their market contributions in the respective geographies were determined through primary and secondary research.
Forecast Model
![research-methodology2]()