Mobile Payment Technologies Market Overview and Analysis
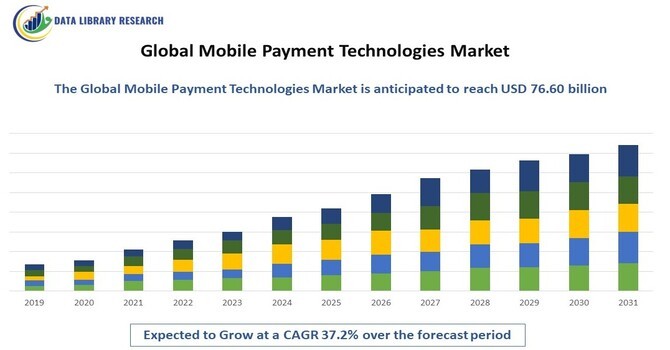
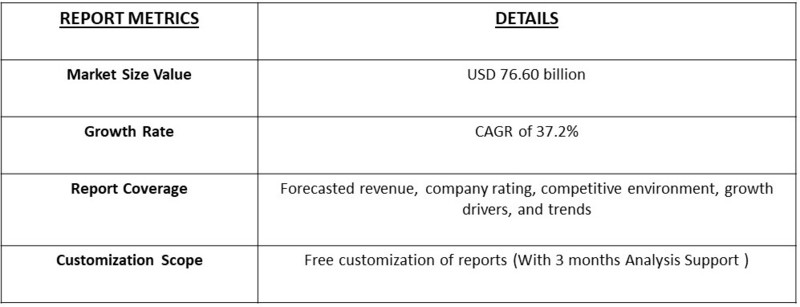
The global mobile payment market size was valued at USD 76.60 billion in 2023 and is projected to grow at a CAGR of 37.2% from 2024 to 2031.
Get a Complete Analysis Of The Report - Download a Free Sample PDF
Mobile payment is a concept wherein a portable electronic device such as a smartphone, tablet, or cell phone is used as a payment medium. Mobile payment technology allows consumers to make immediate payments for products and services. The global Mobile Payment Technologies market is projected to grow at a sound pace in the times to follow.
Increasing adoption of advanced technologies such as near field communication (NFC), wearable devices, and mobile point-of-sale (m-POS) are anticipated to boost the growth of Mobile Payment Technologies in the near future. At present, the increasing number of mobile users and the growing adoption of smart devices such as smartphones & tablets are anticipated to propel the growth of the global Mobile Payment Technologies market. In addition, mobile payment solutions are progressively adopted by developing countries, and increasing adoption of smart appliances and a rise in mobile data usage are estimated to boost the growth of the Mobile Payment Technologies market over the forecast period. This is mainly due to the ease of communication and increasing demand for convenient transactions by consumers around the globe.
Moreover, smart appliances such as smartphones and tablets, with their related applications, are the prime requirement for mobile payment technology, which allows payment without using traditional financial transaction channels. Similarly, demand for digital payment solutions is escalating around the world. Further, digital payment systems allow consumers to make immediate payments by using a smartphone. All these key factors are contributed more to the expansion of the global Mobile Payment Technologies market.
COVID-19 Impact on Mobile Payment Technologies Market
Like many other industries, COVID-19 badly knocked the electronic and semiconductor industries. This unprecedented event has impacted nearly 230 countries in just a few weeks, resulting in the forced shutdown of manufacturing and transportation activities within and across the countries. This has directly affected the overall sector's growth. It is estimated that COVID-19 to leave more than USD 30 billion impacts on the electronics and semiconductor industry. The sector is majorly affected due to transport restrictions on major electronics and semiconductor raw material providers. However, the emerging need for semiconductors in several industries will offer rapid market recovery over the future period.
Mobile Payment Technologies Market Segment
Based on Type, the Remote Payment segment has significant growth in the Mobile Payment Technologies Market. It is the most popular among users. It includes internet payments, in-app payments, telephone payments, mail order payments. According to Purchase Type, the Money Transfers & Payments segment hold the largest share in the market. By End-User, the Retail Sector is the largest segment in the market. The retail sector is looking for mobile payment technologies to ease payment transactions. Some major factors such as urbanization, income growth, favorable government regulations and policies, and changes in tastes & preferences of consumers across the globe are remarkably boosting the growth of the segment. The retail sector is also projected to see exponential growth in the forthcoming years.
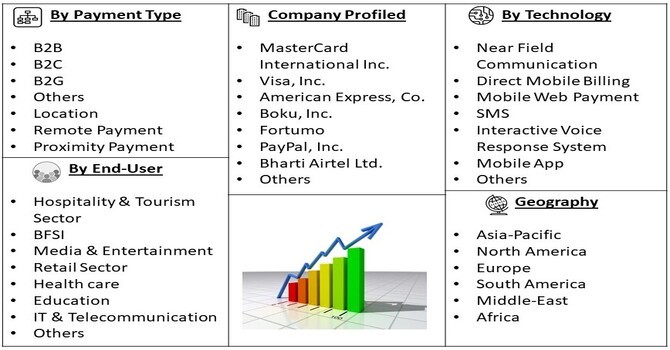
Mobile Payment Technologies Market, By Technology
- Near Field Communication
- Direct Mobile Billing
- Mobile Web Payment
- SMS
- Interactive Voice Response System
- Mobile App
- Others
Mobile Payment Technologies Market, By Payment Type
- B2B
- B2C
- B2G
- Others
- Location
- Remote Payment
- Proximity Payment
Mobile Payment Technologies Market, By End-User
- ·Hospitality & Tourism Sector
- BFSI
- Media & Entertainment
- Retail Sector
- Health care
- Education
- IT & Telecommunication
- Others
For Detailed Market Segmentation - Download Free Sample PDF
Mobile Payment Technologies Market Regional Overview
In terms of geography, Asia Pacific is expected to hold a major share of the global Mobile Payment Technologies market during the forecast period. The increasing adoption of smart appliances such as mobile phones, smartphones, and tablets is a major factor that escalating the growth of the mobile payment technologies market in the Asia Pacific. Moreover, the increase in advance payment solution offerings by technology providers has led to the growing adoption of ground-breaking mobile payment technologies across the region. In addition to this, the government-led initiatives in China and India to promote digitization are further helping in the growth of the market. Apart from this, many service providers are investing in tools development specific to a particular application and are focused on new product developments, partnerships, and mergers and acquisitions to boost their presence in the regional market. This fact further intensifies the growth of the global mobile payment technologies market in the Asia Pacific.
Mobile Payment Technologies Market, By Geography
· North America (US & Canada)
· Europe (UK, Germany, France, Italy, Spain, Russia & Rest of Europe)
· Asia-Pacific (Japan, China, India, Australia, & South Korea, & Rest of Asia-Pacific)
· LAMEA (Brazil, Saudi Arabia, UAE & Rest of LAMEA)
Mobile Payment Technologies Market Competitor Overview
Some key developments and strategies manufacturers adopt in Mobile Payment Technologies are highlighted below.
· In September 2021, The international branch of the National Payment Corporation of India, NPCI International Payments Ltd (NIPL), has collaborated with Mashreq, among the UAE's top financial firms, to enable the implementation of its mobile-based real-time payment system, Unified Payments Interface (UPI), in the UAE.
Get Complete Analysis Of The Report - Download Free Sample PDF
Mobile Payment Technologies Market, Key Players
· MasterCard International Inc.
· Visa, Inc.
· American Express, Co.
· Boku, Inc.
· Fortumo
· PayPal, Inc.
· Bharti Airtel Ltd.
· Vodafone Ltd.
· AT & T, Inc.
· Google, Inc.
· Apple, Inc.
· Microsoft Corporation
· Ant Financial Services Group
List of Figures
Figure 1: Global Mobile Payment Market Revenue Breakdown (USD Billion, %) by Region, 2019 & 2027
Figure 2: Global Mobile Payment Market Value Share (%), By Segment 1, 2019 & 2027
Figure 3: Global Mobile Payment Market Forecast (USD Billion), by Sub-Segment 1, 2016-2027
Figure 4: Global Mobile Payment Market Forecast (USD Billion), by Sub-Segment 2, 2016-2027
Figure 5: Global Mobile Payment Market Value Share (%), By Segment 2, 2019 & 2027
Figure 6: Global Mobile Payment Market Forecast (USD Billion), by Sub-Segment 1, 2016-2027
Figure 7: Global Mobile Payment Market Forecast (USD Billion), by Sub-Segment 2, 2016-2027
Figure 8: Global Mobile Payment Market Forecast (USD Billion), by Sub-Segment 3, 2016-2027
Figure 9: Global Mobile Payment Market Forecast (USD Billion), by Others, 2016-2027
Figure 10: Global Mobile Payment Market Value Share (%), By Segment 3, 2019 & 2027
Figure 11: Global Mobile Payment Market Forecast (USD Billion), by Sub-Segment 1, 2016-2027
Figure 12: Global Mobile Payment Market Forecast (USD Billion), by Sub-Segment 2, 2016-2027
Figure 13: Global Mobile Payment Market Forecast (USD Billion), by Sub-Segment 3, 2016-2027
Figure 14: Global Mobile Payment Market Forecast (USD Billion), by Others, 2016-2027
Figure 15: Global Mobile Payment Market Value (USD Billion), by Region, 2019 & 2027
Figure 16: North America Mobile Payment Market Value Share (%), By Segment 1, 2019 & 2027
Figure 17: North America Mobile Payment Market Forecast (USD Billion), by Sub-Segment 1, 2016-2027
Figure 18: North America Mobile Payment Market Forecast (USD Billion), by Sub-Segment 2, 2016-2027
Figure 19: North America Mobile Payment Market Value Share (%), By Segment 2, 2019 & 2027
Figure 20: North America Mobile Payment Market Forecast (USD Billion), by Sub-Segment 1, 2016-2027
Figure 21: North America Mobile Payment Market Forecast (USD Billion), by Sub-Segment 2, 2016-2027
Figure 22: North America Mobile Payment Market Forecast (USD Billion), by Sub-Segment 3, 2016-2027
Figure 23: North America Mobile Payment Market Forecast (USD Billion), by Others, 2016-2027
Figure 24: North America Mobile Payment Market Value Share (%), By Segment 3, 2019 & 2027
Figure 25: North America Mobile Payment Market Forecast (USD Billion), by Sub-Segment 1, 2016-2027
Figure 26: North America Mobile Payment Market Forecast (USD Billion), by Sub-Segment 2, 2016-2027
Figure 27: North America Mobile Payment Market Forecast (USD Billion), by Sub-Segment 3, 2016-2027
Figure 28: North America Mobile Payment Market Forecast (USD Billion), by Others, 2016-2027
Figure 29: North America Mobile Payment Market Forecast (USD Billion), by U.S., 2016-2027
Figure 30: North America Mobile Payment Market Forecast (USD Billion), by Canada, 2016-2027
Figure 31: Latin America Mobile Payment Market Value Share (%), By Segment 1, 2019 & 2027
Figure 32: Latin America Mobile Payment Market Forecast (USD Billion), by Sub-Segment 1, 2016-2027
Figure 33: Latin America Mobile Payment Market Forecast (USD Billion), by Sub-Segment 2, 2016-2027
Figure 34: Latin America Mobile Payment Market Value Share (%), By Segment 2, 2019 & 2027
Figure 35: Latin America Mobile Payment Market Forecast (USD Billion), by Sub-Segment 1, 2016-2027
Figure 36: Latin America Mobile Payment Market Forecast (USD Billion), by Sub-Segment 2, 2016-2027
Figure 37: Latin America Mobile Payment Market Forecast (USD Billion), by Sub-Segment 3, 2016-2027
Figure 38: Latin America Mobile Payment Market Forecast (USD Billion), by Others, 2016-2027
Figure 39: Latin America Mobile Payment Market Value Share (%), By Segment 3, 2019 & 2027
Figure 40: Latin America Mobile Payment Market Forecast (USD Billion), by Sub-Segment 1, 2016-2027
Figure 41: Latin America Mobile Payment Market Forecast (USD Billion), by Sub-Segment 2, 2016-2027
Figure 42: Latin America Mobile Payment Market Forecast (USD Billion), by Sub-Segment 3, 2016-2027
Figure 43: Latin America Mobile Payment Market Forecast (USD Billion), by Others, 2016-2027
Figure 44: Latin America Mobile Payment Market Forecast (USD Billion), by Brazil, 2016-2027
Figure 45: Latin America Mobile Payment Market Forecast (USD Billion), by Mexico, 2016-2027
Figure 46: Latin America Mobile Payment Market Forecast (USD Billion), by Rest of Latin America, 2016-2027
Figure 47: Europe Mobile Payment Market Value Share (%), By Segment 1, 2019 & 2027
Figure 48: Europe Mobile Payment Market Forecast (USD Billion), by Sub-Segment 1, 2016-2027
Figure 49: Europe Mobile Payment Market Forecast (USD Billion), by Sub-Segment 2, 2016-2027
Figure 50: Europe Mobile Payment Market Value Share (%), By Segment 2, 2019 & 2027
Figure 51: Europe Mobile Payment Market Forecast (USD Billion), by Sub-Segment 1, 2016-2027
Figure 52: Europe Mobile Payment Market Forecast (USD Billion), by Sub-Segment 2, 2016-2027
Figure 53: Europe Mobile Payment Market Forecast (USD Billion), by Sub-Segment 3, 2016-2027
Figure 54: Europe Mobile Payment Market Forecast (USD Billion), by Others, 2016-2027
Figure 55: Europe Mobile Payment Market Value Share (%), By Segment 3, 2019 & 2027
Figure 56: Europe Mobile Payment Market Forecast (USD Billion), by Sub-Segment 1, 2016-2027
Figure 57: Europe Mobile Payment Market Forecast (USD Billion), by Sub-Segment 2, 2016-2027
Figure 58: Europe Mobile Payment Market Forecast (USD Billion), by Sub-Segment 3, 2016-2027
Figure 59: Europe Mobile Payment Market Forecast (USD Billion), by Others, 2016-2027
Figure 60: Europe Mobile Payment Market Forecast (USD Billion), by U.K., 2016-2027
Figure 61: Europe Mobile Payment Market Forecast (USD Billion), by Germany, 2016-2027
Figure 62: Europe Mobile Payment Market Forecast (USD Billion), by France, 2016-2027
Figure 63: Europe Mobile Payment Market Forecast (USD Billion), by Italy, 2016-2027
Figure 64: Europe Mobile Payment Market Forecast (USD Billion), by Spain, 2016-2027
Figure 65: Europe Mobile Payment Market Forecast (USD Billion), by Russia, 2016-2027
Figure 66: Europe Mobile Payment Market Forecast (USD Billion), by Rest of Europe, 2016-2027
Figure 67: Asia Pacific Mobile Payment Market Value Share (%), By Segment 1, 2019 & 2027
Figure 68: Asia Pacific Mobile Payment Market Forecast (USD Billion), by Sub-Segment 1, 2016-2027
Figure 69: Asia Pacific Mobile Payment Market Forecast (USD Billion), by Sub-Segment 2, 2016-2027
Figure 70: Asia Pacific Mobile Payment Market Value Share (%), By Segment 2, 2019 & 2027
Figure 71: Asia Pacific Mobile Payment Market Forecast (USD Billion), by Sub-Segment 1, 2016-2027
Figure 72: Asia Pacific Mobile Payment Market Forecast (USD Billion), by Sub-Segment 2, 2016-2027
Figure 73: Asia Pacific Mobile Payment Market Forecast (USD Billion), by Sub-Segment 3, 2016-2027
Figure 74: Asia Pacific Mobile Payment Market Forecast (USD Billion), by Others, 2016-2027
Figure 75: Asia Pacific Mobile Payment Market Value Share (%), By Segment 3, 2019 & 2027
Figure 76: Asia Pacific Mobile Payment Market Forecast (USD Billion), by Sub-Segment 1, 2016-2027
Figure 77: Asia Pacific Mobile Payment Market Forecast (USD Billion), by Sub-Segment 2, 2016-2027
Figure 78: Asia Pacific Mobile Payment Market Forecast (USD Billion), by Sub-Segment 3, 2016-2027
Figure 79: Asia Pacific Mobile Payment Market Forecast (USD Billion), by Others, 2016-2027
Figure 80: Asia Pacific Mobile Payment Market Forecast (USD Billion), by China, 2016-2027
Figure 81: Asia Pacific Mobile Payment Market Forecast (USD Billion), by India, 2016-2027
Figure 82: Asia Pacific Mobile Payment Market Forecast (USD Billion), by Japan, 2016-2027
Figure 83: Asia Pacific Mobile Payment Market Forecast (USD Billion), by Australia, 2016-2027
Figure 84: Asia Pacific Mobile Payment Market Forecast (USD Billion), by Southeast Asia, 2016-2027
Figure 85: Asia Pacific Mobile Payment Market Forecast (USD Billion), by Rest of Asia Pacific, 2016-2027
Figure 86: Middle East & Africa Mobile Payment Market Value Share (%), By Segment 1, 2019 & 2027
Figure 87: Middle East & Africa Mobile Payment Market Forecast (USD Billion), by Sub-Segment 1, 2016-2027
Figure 88: Middle East & Africa Mobile Payment Market Forecast (USD Billion), by Sub-Segment 2, 2016-2027
Figure 89: Middle East & Africa Mobile Payment Market Value Share (%), By Segment 2, 2019 & 2027
Figure 90: Middle East & Africa Mobile Payment Market Forecast (USD Billion), by Sub-Segment 1, 2016-2027
Figure 91: Middle East & Africa Mobile Payment Market Forecast (USD Billion), by Sub-Segment 2, 2016-2027
Figure 92: Middle East & Africa Mobile Payment Market Forecast (USD Billion), by Sub-Segment 3, 2016-2027
Figure 93: Middle East & Africa Mobile Payment Market Forecast (USD Billion), by Others, 2016-2027
Figure 94: Middle East & Africa Mobile Payment Market Value Share (%), By Segment 3, 2019 & 2027
Figure 95: Middle East & Africa Mobile Payment Market Forecast (USD Billion), by Sub-Segment 1, 2016-2027
Figure 96: Middle East & Africa Mobile Payment Market Forecast (USD Billion), by Sub-Segment 2, 2016-2027
Figure 97: Middle East & Africa Mobile Payment Market Forecast (USD Billion), by Sub-Segment 3, 2016-2027
Figure 98: Middle East & Africa Mobile Payment Market Forecast (USD Billion), by Others, 2016-2027
Figure 99: Middle East & Africa Mobile Payment Market Forecast (USD Billion), by GCC, 2016-2027
Figure 100: Middle East & Africa Mobile Payment Market Forecast (USD Billion), by South Africa, 2016-2027
Figure 101: Middle East & Africa Mobile Payment Market Forecast (USD Billion), by Rest of Middle East & Africa, 2016-2027
List of Tables
Table 1: Global Mobile Payment Market Revenue (USD Billion) Forecast, by Segment 1, 2016-2027
Table 2: Global Mobile Payment Market Revenue (USD Billion) Forecast, by Segment 2, 2016-2027
Table 3: Global Mobile Payment Market Revenue (USD Billion) Forecast, by Segment 3, 2016-2027
Table 4: Global Mobile Payment Market Revenue (USD Billion) Forecast, by Region, 2016-2027
Table 5: North America Mobile Payment Market Revenue (USD Billion) Forecast, by Segment 1, 2016-2027
Table 6: North America Mobile Payment Market Revenue (USD Billion) Forecast, by Segment 2, 2016-2027
Table 7: North America Mobile Payment Market Revenue (USD Billion) Forecast, by Segment 3, 2016-2027
Table 8: North America Mobile Payment Market Revenue (USD Billion) Forecast, by Country, 2016-2027
Table 9: Europe Mobile Payment Market Revenue (USD Billion) Forecast, by Segment 1, 2016-2027
Table 10: Europe Mobile Payment Market Revenue (USD Billion) Forecast, by Segment 2, 2016-2027
Table 11: Europe Mobile Payment Market Revenue (USD Billion) Forecast, by Segment 3, 2016-2027
Table 12: Europe Mobile Payment Market Revenue (USD Billion) Forecast, by Country, 2016-2027
Table 13: Latin America Mobile Payment Market Revenue (USD Billion) Forecast, by Segment 1, 2016-2027
Table 14: Latin America Mobile Payment Market Revenue (USD Billion) Forecast, by Segment 2, 2016-2027
Table 15: Latin America Mobile Payment Market Revenue (USD Billion) Forecast, by Segment 3, 2016-2027
Table 16: Latin America Mobile Payment Market Revenue (USD Billion) Forecast, by Country, 2016-2027
Table 17: Asia Pacific Mobile Payment Market Revenue (USD Billion) Forecast, by Segment 1, 2016-2027
Table 18: Asia Pacific Mobile Payment Market Revenue (USD Billion) Forecast, by Segment 2, 2016-2027
Table 19: Asia Pacific Mobile Payment Market Revenue (USD Billion) Forecast, by Segment 3, 2016-2027
Table 20: Asia Pacific Mobile Payment Market Revenue (USD Billion) Forecast, by Country, 2016-2027
Table 21: Middle East & Africa Mobile Payment Market Revenue (USD Billion) Forecast, by Segment 1, 2016-2027
Table 22: Middle East & Africa Mobile Payment Market Revenue (USD Billion) Forecast, by Segment 2, 2016-2027
Table 23: Middle East & Africa Mobile Payment Market Revenue (USD Billion) Forecast, by Segment 3, 2016-2027
Table 24: Middle East & Africa Mobile Payment Market Revenue (USD Billion) Forecast, by Country, 2016-2027
Research Process
Data Library Research are conducted by industry experts who offer insight on
industry structure, market segmentations technology assessment and competitive landscape (CL), and penetration, as well as on emerging trends. Their analysis is based on primary interviews (~ 80%) and secondary research (~ 20%) as well as years of professional expertise in their respective industries. Adding to this, by analysing historical trends and current market positions, our analysts predict where the market will be headed for the next five years. Furthermore, the varying trends of segment & categories geographically presented are also studied and the estimated based on the primary & secondary research.
In this particular report from the supply side Data Library Research has conducted primary surveys (interviews) with the key level executives (VP, CEO’s, Marketing Director, Business Development Manager
and SOFT) of the companies that active & prominent as well as the midsized organization
FIGURE 1: DLR RESEARH PROCESS
![research-methodology1]()
Primary Research
Extensive primary research was conducted to gain a deeper insight of the market and industry performance. The analysis is based on both primary and secondary research as well as years of professional expertise in the respective industries.
In addition to analysing current and historical trends, our analysts predict where the market is headed over the next five years.
It varies by segment for these categories geographically presented in the list of market tables. Speaking about this particular report we have conducted primary surveys (interviews) with the key level executives (VP, CEO’s, Marketing Director, Business Development Manager and many more) of the major players active in the market.
Secondary Research
Secondary research was mainly used to collect and identify information useful for the extensive, technical, market-oriented, and Friend’s study of the Global Extra Neutral Alcohol. It was also used to obtain key information about major players, market classification and segmentation according to the industry trends, geographical markets, and developments related to the market and technology perspectives. For this study, analysts have gathered information from various credible sources, such as annual reports, sec filings, journals, white papers, SOFT presentations, and company web sites.
Market Size Estimation
Both, top-down and bottom-up approaches were used to estimate and validate the size of the Global market and to estimate the size of various other dependent submarkets in the overall Extra Neutral Alcohol. The key players in the market were identified through secondary research and their market contributions in the respective geographies were determined through primary and secondary research.
Forecast Model
![research-methodology2]()