Myelodysplastic Syndromes (MDS) Treatment Market Overview and Analysis
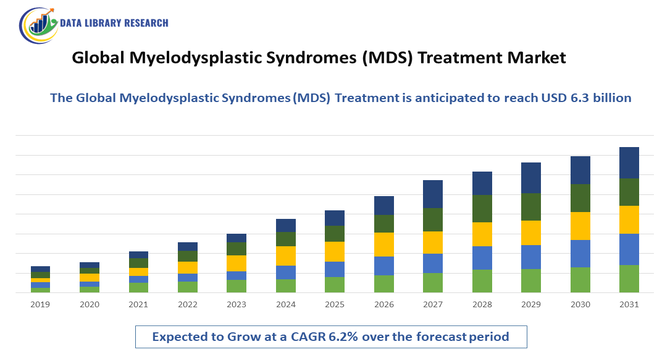
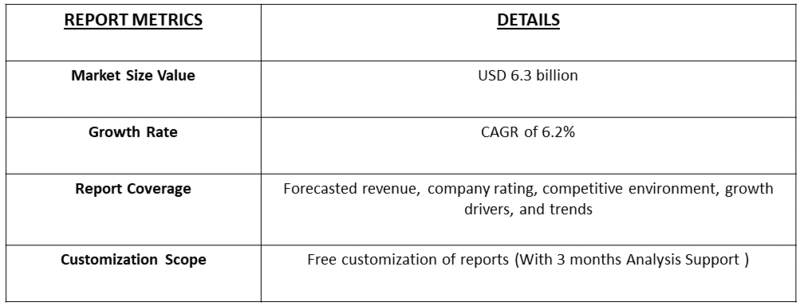
- The Global Myelodysplastic Syndromes (MDS) Treatment Market is projected to grow from USD 4.2 billion in 2025 to USD 6.3 billion by 2032, at a CAGR of 6.2% from 2025-2032.
Get Complete Analysis Of The Report - Download Updated Free Sample PDF
The Global Myelodysplastic Syndromes (MDS) Treatment Market comprises therapies and healthcare services aimed at managing myelodysplastic syndromes, a group of bone marrow disorders characterized by ineffective blood cell production. The market includes chemotherapy agents, immunomodulatory drugs, growth factors, and stem cell transplantation. Growth is driven by rising disease prevalence, aging populations, advances in targeted therapies, and improved diagnostic awareness. Pharmaceutical companies, hospitals, and specialty clinics play key roles, while regulatory approvals and ongoing clinical research shape market development worldwide.
Myelodysplastic Syndromes (MDS) Treatment Market Latest Trends
The global myelodysplastic syndromes (MDS) treatment market is evolving with increasing adoption of targeted therapies and hypomethylating agents to improve patient outcomes. Advances in molecular diagnostics have enabled risk-based treatment selection and personalized care. Growing use of combination therapies and supportive care, including growth factors and transfusions, continues to shape clinical practice. Research focus on novel agents, such as immune-modulating and gene-targeted drugs, is expanding the treatment pipeline.
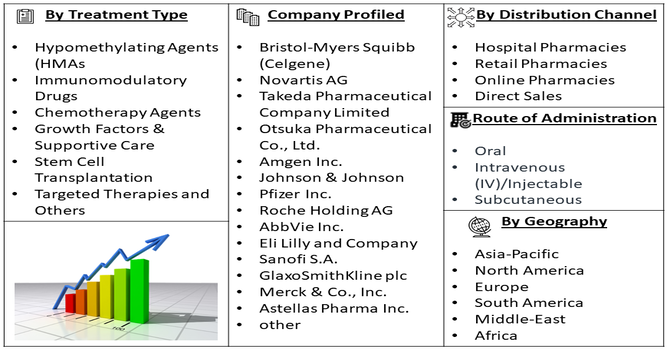
Segmentation: The Global Myelodysplastic Syndromes (MDS) Treatment Market is segmented by Treatment Type (Hypomethylating Agents (HMAs), Immunomodulatory Drugs, Chemotherapy Agents, Growth Factors & Supportive Care, Stem Cell Transplantation, Targeted Therapies and Others), Route of Administration (Oral, Intravenous (IV)/Injectable and Subcutaneous), Patient Type (Low-Risk MDS, Intermediate-Risk MDS, and High-Risk MDS), Distribution Channel (Hospital Pharmacies, Retail Pharmacies, Online Pharmacies and Direct Sales), and Geography (North America, Europe, Asia-Pacific, Middle East and Africa, and South America). The report provides the value (in USD million) for the above segments.
For Detailed Market Segmentation - Get a Free Sample PDF
Market Drivers:
- Rising Prevalence of MDS and Aging Population
The increasing prevalence of myelodysplastic syndromes, particularly among older adults, has been a major driver of market growth. MDS primarily affects individuals aged 60 and above, and the global rise in the geriatric population has led to higher diagnosis rates. Improved awareness, better diagnostic tools, and routine blood testing have enabled earlier detection of MDS cases. As life expectancy increases worldwide, the burden of age-related hematologic disorders continues to grow. This demographic trend has significantly increased demand for effective treatment options, supportive care therapies, and long-term disease management solutions in hospitals and specialty clinics.
- Advancements in Targeted and Novel Therapies
Continuous advancements in targeted therapies and novel drug development have strongly driven the MDS treatment market. Innovations such as hypomethylating agents, immunomodulatory drugs, and emerging gene-targeted therapies have improved patient outcomes and survival rates. Personalized treatment approaches based on genetic profiling and risk stratification have enhanced therapeutic effectiveness. Pharmaceutical companies are actively investing in research and clinical trials to expand treatment options, including combination therapies. Regulatory approvals of new agents and expanded indications for existing drugs have further strengthened adoption. These innovations have increased physician confidence and broadened treatment availability across diverse MDS patient populations globally.
Market Restraints:
- High Treatment Costs and Limited Accessibility
High treatment costs remain a significant restraint in the global MDS treatment market. Advanced therapies, prolonged treatment durations, frequent hospital visits, and supportive care requirements impose substantial financial burdens on patients and healthcare systems. In low- and middle-income regions, limited access to specialized hematology centers and advanced diagnostics restricts timely treatment. Additionally, stem cell transplantation, the only curative option, is expensive and suitable for a limited patient population. Reimbursement challenges and unequal healthcare coverage further hinder widespread adoption, limiting market growth despite increasing disease prevalence and therapeutic advancements.
Socioeconomic Impact on Myelodysplastic Syndromes (MDS) Treatment Market
The MDS treatment market has a significant socioeconomic impact due to the chronic nature of the disease and its prevalence among older populations. Effective treatments improve survival rates, reduce transfusion dependence, and enhance patients’ quality of life. However, high treatment costs and long-term care needs place financial pressure on healthcare systems and families. Increased access to advanced therapies can reduce hospitalization and disease complications, lowering overall healthcare burden. The market also supports employment in research, clinical care, and pharmaceutical manufacturing, while ongoing innovation contributes to better long-term health and productivity outcomes globally.
Segmental Analysis:
- Hypomethylating Agents (HMAs) segment is expected to witness the highest growth over the forecast period
The Hypomethylating Agents (HMAs) segment is expected to witness the highest growth over the forecast period due to their established clinical efficacy in managing both low- and high-risk MDS patients. HMAs such as azacitidine and decitabine improve survival, delay disease progression, and reduce transfusion dependence. Increasing physician preference for disease-modifying therapies, expanding treatment guidelines, and ongoing research into combination regimens have strengthened adoption. Regulatory approvals for expanded indications and growing availability of newer formulations have further accelerated demand, positioning HMAs as a cornerstone therapy driving market growth globally.
- Intravenous (IV)/Injectable segment is expected to witness the highest growth over the forecast period
The Intravenous (IV)/Injectable segment is expected to witness the highest growth as many frontline MDS therapies, including HMAs and supportive biologics, are primarily administered via injectable routes. IV delivery ensures precise dosing, rapid bioavailability, and consistent therapeutic outcomes, particularly for elderly and high-risk patients. Hospital-based administration supports close monitoring and management of adverse effects. Advances in injectable formulations and increased availability of outpatient infusion services have further boosted utilization. As treatment protocols continue to favor injectable therapies, this segment remains central to MDS clinical management worldwide.
- Intermediate-Risk MDs segment is expected to witness the highest growth over the forecast period
The Intermediate-Risk MDS segment is expected to witness the highest growth due to increasing emphasis on early intervention to prevent disease progression. Patients in this category benefit from active treatment strategies, including HMAs and combination therapies, rather than supportive care alone. Improved risk stratification tools and molecular diagnostics have enhanced identification of intermediate-risk patients, expanding the treated population. Growing clinical evidence supporting timely therapeutic intervention has driven physician adoption, while expanding treatment options have improved outcomes, making this segment a significant contributor to overall market expansion.
- Hospital Pharmacies segment is expected to witness highest growth over the forecast period
The Hospital Pharmacies segment is expected to witness the highest growth as MDS treatment is largely administered in hospital settings requiring specialized handling and monitoring. Hospital pharmacies play a critical role in dispensing injectable therapies, managing chemotherapy protocols, and supporting personalized dosing. Rising hospital admissions, increased use of IV treatments, and access to specialized hematology services have strengthened demand. Additionally, hospital pharmacies ensure compliance with safety, storage, and regulatory requirements, making them the preferred distribution channel for complex MDS therapies and supporting sustained market growth.
- North American Region is expected to witness highest growth over the forecast period
North America is expected to witness the highest growth over the forecast period due to high disease awareness, advanced diagnostic capabilities, and strong adoption of innovative therapies. The region benefits from well-established healthcare infrastructure, favorable reimbursement policies, and a high concentration of leading pharmaceutical companies.
In 2024, The FDA approval of ivosidenib strengthened North America’s MDS treatment market by expanding targeted therapy options for relapsed or refractory patients with IDH1 mutations. The decision supported precision medicine adoption, improved treatment outcomes, and increased demand for companion diagnostics, reinforcing the region’s leadership in advanced and personalized MDS care. Ongoing clinical trials, rapid regulatory approvals, and early adoption of targeted treatments have further fueled market expansion. An aging population and strong physician expertise continue to drive demand, positioning North America as the leading regional market for MDS treatment.
The North American MDS treatment market is poised for sustained growth, driven by continuous clinical innovations, expanding therapeutic options, and increasing awareness of personalized medicine. Advances in targeted therapies, supportive care, and diagnostic tools, combined with demographic trends and strong healthcare infrastructure, are shaping a dynamic market landscape worldwide.
To Learn More About This Report - Request a Free Sample Copy
Myelodysplastic Syndromes (MDS) Treatment Market Competitive Landscape
The competitive landscape of the MDS treatment market is moderately concentrated, with established pharmaceutical companies and emerging biotech firms actively developing innovative therapies. Key players compete through strong clinical pipelines, regulatory approvals, and strategic collaborations. Companies focus on expanding indications for existing drugs and advancing novel treatments through late-stage clinical trials. Market leaders benefit from established distribution networks and strong physician adoption, while smaller firms target niche patient segments with differentiated therapies. Mergers, acquisitions, and licensing agreements play a critical role in strengthening portfolios and expanding global presence in this specialized hematology market.
The major players for above market are:
- Bristol-Myers Squibb (Celgene)
- Novartis AG
- Takeda Pharmaceutical Company Limited
- Otsuka Pharmaceutical Co., Ltd.
- Amgen Inc.
- Johnson & Johnson
- Pfizer Inc.
- Roche Holding AG
- AbbVie Inc.
- Eli Lilly and Company
- Sanofi S.A.
- GlaxoSmithKline plc
- Merck & Co., Inc.
- Astellas Pharma Inc.
- Jazz Pharmaceuticals plc
- Daiichi Sankyo Company, Limited
- AstraZeneca plc
- Onconova Therapeutics, Inc.
- Geron Corporation
- BeiGene Ltd.
Recent Development
- In June 2025, AbbVie’s Phase 3 VERONA trial results highlighted challenges in advancing combination therapies for higher-risk MDS, as venetoclax with azacitidine did not improve overall survival. The outcome underscored the complexity of MDS treatment development, reinforced the need for continued innovation, and maintained reliance on existing standard-of-care therapies in the global MDS treatment market.
- In October 2023, The FDA approval of Tibsovo marked a major advancement in the global MDS treatment market by introducing the first targeted therapy for relapsed or refractory patients with IDH1 mutations. This milestone accelerated precision medicine adoption, expanded treatment options, and reinforced the role of companion diagnostics in personalized MDS care worldwide.
Frequently Asked Questions (FAQ) :
Q1. What are the main growth-driving factors for this market?
The market is primarily driven by the rising global elderly population, as MDS is most commonly diagnosed in patients over 65. Advances in genomic sequencing are allowing for more precise diagnosis and targeted therapies. Additionally, increased government funding for cancer research and a robust pipeline of new drugs in clinical trials are accelerating market expansion.
Q2. What are the main restraining factors for this market?
Growth is hindered by the high cost of specialized treatments, such as bone marrow transplants and high-end biologics, which are often unaffordable in developing regions. Many treatments also carry a high risk of severe side effects, leading to poor patient compliance. Furthermore, the complexity of the disease makes it difficult to develop a one-size-fits-all cure.
Q3. Which segment is expected to witness high growth?
The Hypomethylating Agents (HMAs) segment is expected to witness the highest growth. These drugs are the standard of care for high-risk MDS patients who are not eligible for intensive chemotherapy or transplants. Because they help restore normal cell growth and improve survival rates with manageable toxicity, their adoption remains high across global oncology clinics.
Q4. Who are the top major players for this market?
The market is led by global pharmaceutical giants with strong oncology portfolios. Key players include Bristol-Myers Squibb (Celgene), Novartis, Takeda Pharmaceutical, AbbVie, and Jazz Pharmaceuticals. These companies dominate by holding patents for key therapeutic drugs and investing heavily in combination therapies that aim to delay the progression of MDS to acute leukemia.
Q5. Which country is the largest player?
The United States is the largest player in the MDS treatment market. This is due to its high healthcare expenditure, advanced diagnostic capabilities, and early access to FDA-approved orphan drugs. A strong presence of leading cancer research centers and a high prevalence of diagnosed cases among the aging American population keep the U.S. at the forefront.
List of Figures
Figure 1: Global Myelodysplastic Syndromes (MDS) Treatment Market Revenue Breakdown (USD Billion, %) by Region, 2019 & 2027
Figure 2: Global Myelodysplastic Syndromes (MDS) Treatment Market Value Share (%), By Segment 1, 2019 & 2027
Figure 3: Global Myelodysplastic Syndromes (MDS) Treatment Market Forecast (USD Billion), by Sub-Segment 1, 2016-2027
Figure 4: Global Myelodysplastic Syndromes (MDS) Treatment Market Forecast (USD Billion), by Sub-Segment 2, 2016-2027
Figure 5: Global Myelodysplastic Syndromes (MDS) Treatment Market Value Share (%), By Segment 2, 2019 & 2027
Figure 6: Global Myelodysplastic Syndromes (MDS) Treatment Market Forecast (USD Billion), by Sub-Segment 1, 2016-2027
Figure 7: Global Myelodysplastic Syndromes (MDS) Treatment Market Forecast (USD Billion), by Sub-Segment 2, 2016-2027
Figure 8: Global Myelodysplastic Syndromes (MDS) Treatment Market Forecast (USD Billion), by Sub-Segment 3, 2016-2027
Figure 9: Global Myelodysplastic Syndromes (MDS) Treatment Market Forecast (USD Billion), by Others, 2016-2027
Figure 10: Global Myelodysplastic Syndromes (MDS) Treatment Market Value Share (%), By Segment 3, 2019 & 2027
Figure 11: Global Myelodysplastic Syndromes (MDS) Treatment Market Forecast (USD Billion), by Sub-Segment 1, 2016-2027
Figure 12: Global Myelodysplastic Syndromes (MDS) Treatment Market Forecast (USD Billion), by Sub-Segment 2, 2016-2027
Figure 13: Global Myelodysplastic Syndromes (MDS) Treatment Market Forecast (USD Billion), by Sub-Segment 3, 2016-2027
Figure 14: Global Myelodysplastic Syndromes (MDS) Treatment Market Forecast (USD Billion), by Others, 2016-2027
Figure 15: Global Myelodysplastic Syndromes (MDS) Treatment Market Value (USD Billion), by Region, 2019 & 2027
Figure 16: North America Myelodysplastic Syndromes (MDS) Treatment Market Value Share (%), By Segment 1, 2019 & 2027
Figure 17: North America Myelodysplastic Syndromes (MDS) Treatment Market Forecast (USD Billion), by Sub-Segment 1, 2016-2027
Figure 18: North America Myelodysplastic Syndromes (MDS) Treatment Market Forecast (USD Billion), by Sub-Segment 2, 2016-2027
Figure 19: North America Myelodysplastic Syndromes (MDS) Treatment Market Value Share (%), By Segment 2, 2019 & 2027
Figure 20: North America Myelodysplastic Syndromes (MDS) Treatment Market Forecast (USD Billion), by Sub-Segment 1, 2016-2027
Figure 21: North America Myelodysplastic Syndromes (MDS) Treatment Market Forecast (USD Billion), by Sub-Segment 2, 2016-2027
Figure 22: North America Myelodysplastic Syndromes (MDS) Treatment Market Forecast (USD Billion), by Sub-Segment 3, 2016-2027
Figure 23: North America Myelodysplastic Syndromes (MDS) Treatment Market Forecast (USD Billion), by Others, 2016-2027
Figure 24: North America Myelodysplastic Syndromes (MDS) Treatment Market Value Share (%), By Segment 3, 2019 & 2027
Figure 25: North America Myelodysplastic Syndromes (MDS) Treatment Market Forecast (USD Billion), by Sub-Segment 1, 2016-2027
Figure 26: North America Myelodysplastic Syndromes (MDS) Treatment Market Forecast (USD Billion), by Sub-Segment 2, 2016-2027
Figure 27: North America Myelodysplastic Syndromes (MDS) Treatment Market Forecast (USD Billion), by Sub-Segment 3, 2016-2027
Figure 28: North America Myelodysplastic Syndromes (MDS) Treatment Market Forecast (USD Billion), by Others, 2016-2027
Figure 29: North America Myelodysplastic Syndromes (MDS) Treatment Market Forecast (USD Billion), by U.S., 2016-2027
Figure 30: North America Myelodysplastic Syndromes (MDS) Treatment Market Forecast (USD Billion), by Canada, 2016-2027
Figure 31: Latin America Myelodysplastic Syndromes (MDS) Treatment Market Value Share (%), By Segment 1, 2019 & 2027
Figure 32: Latin America Myelodysplastic Syndromes (MDS) Treatment Market Forecast (USD Billion), by Sub-Segment 1, 2016-2027
Figure 33: Latin America Myelodysplastic Syndromes (MDS) Treatment Market Forecast (USD Billion), by Sub-Segment 2, 2016-2027
Figure 34: Latin America Myelodysplastic Syndromes (MDS) Treatment Market Value Share (%), By Segment 2, 2019 & 2027
Figure 35: Latin America Myelodysplastic Syndromes (MDS) Treatment Market Forecast (USD Billion), by Sub-Segment 1, 2016-2027
Figure 36: Latin America Myelodysplastic Syndromes (MDS) Treatment Market Forecast (USD Billion), by Sub-Segment 2, 2016-2027
Figure 37: Latin America Myelodysplastic Syndromes (MDS) Treatment Market Forecast (USD Billion), by Sub-Segment 3, 2016-2027
Figure 38: Latin America Myelodysplastic Syndromes (MDS) Treatment Market Forecast (USD Billion), by Others, 2016-2027
Figure 39: Latin America Myelodysplastic Syndromes (MDS) Treatment Market Value Share (%), By Segment 3, 2019 & 2027
Figure 40: Latin America Myelodysplastic Syndromes (MDS) Treatment Market Forecast (USD Billion), by Sub-Segment 1, 2016-2027
Figure 41: Latin America Myelodysplastic Syndromes (MDS) Treatment Market Forecast (USD Billion), by Sub-Segment 2, 2016-2027
Figure 42: Latin America Myelodysplastic Syndromes (MDS) Treatment Market Forecast (USD Billion), by Sub-Segment 3, 2016-2027
Figure 43: Latin America Myelodysplastic Syndromes (MDS) Treatment Market Forecast (USD Billion), by Others, 2016-2027
Figure 44: Latin America Myelodysplastic Syndromes (MDS) Treatment Market Forecast (USD Billion), by Brazil, 2016-2027
Figure 45: Latin America Myelodysplastic Syndromes (MDS) Treatment Market Forecast (USD Billion), by Mexico, 2016-2027
Figure 46: Latin America Myelodysplastic Syndromes (MDS) Treatment Market Forecast (USD Billion), by Rest of Latin America, 2016-2027
Figure 47: Europe Myelodysplastic Syndromes (MDS) Treatment Market Value Share (%), By Segment 1, 2019 & 2027
Figure 48: Europe Myelodysplastic Syndromes (MDS) Treatment Market Forecast (USD Billion), by Sub-Segment 1, 2016-2027
Figure 49: Europe Myelodysplastic Syndromes (MDS) Treatment Market Forecast (USD Billion), by Sub-Segment 2, 2016-2027
Figure 50: Europe Myelodysplastic Syndromes (MDS) Treatment Market Value Share (%), By Segment 2, 2019 & 2027
Figure 51: Europe Myelodysplastic Syndromes (MDS) Treatment Market Forecast (USD Billion), by Sub-Segment 1, 2016-2027
Figure 52: Europe Myelodysplastic Syndromes (MDS) Treatment Market Forecast (USD Billion), by Sub-Segment 2, 2016-2027
Figure 53: Europe Myelodysplastic Syndromes (MDS) Treatment Market Forecast (USD Billion), by Sub-Segment 3, 2016-2027
Figure 54: Europe Myelodysplastic Syndromes (MDS) Treatment Market Forecast (USD Billion), by Others, 2016-2027
Figure 55: Europe Myelodysplastic Syndromes (MDS) Treatment Market Value Share (%), By Segment 3, 2019 & 2027
Figure 56: Europe Myelodysplastic Syndromes (MDS) Treatment Market Forecast (USD Billion), by Sub-Segment 1, 2016-2027
Figure 57: Europe Myelodysplastic Syndromes (MDS) Treatment Market Forecast (USD Billion), by Sub-Segment 2, 2016-2027
Figure 58: Europe Myelodysplastic Syndromes (MDS) Treatment Market Forecast (USD Billion), by Sub-Segment 3, 2016-2027
Figure 59: Europe Myelodysplastic Syndromes (MDS) Treatment Market Forecast (USD Billion), by Others, 2016-2027
Figure 60: Europe Myelodysplastic Syndromes (MDS) Treatment Market Forecast (USD Billion), by U.K., 2016-2027
Figure 61: Europe Myelodysplastic Syndromes (MDS) Treatment Market Forecast (USD Billion), by Germany, 2016-2027
Figure 62: Europe Myelodysplastic Syndromes (MDS) Treatment Market Forecast (USD Billion), by France, 2016-2027
Figure 63: Europe Myelodysplastic Syndromes (MDS) Treatment Market Forecast (USD Billion), by Italy, 2016-2027
Figure 64: Europe Myelodysplastic Syndromes (MDS) Treatment Market Forecast (USD Billion), by Spain, 2016-2027
Figure 65: Europe Myelodysplastic Syndromes (MDS) Treatment Market Forecast (USD Billion), by Russia, 2016-2027
Figure 66: Europe Myelodysplastic Syndromes (MDS) Treatment Market Forecast (USD Billion), by Rest of Europe, 2016-2027
Figure 67: Asia Pacific Myelodysplastic Syndromes (MDS) Treatment Market Value Share (%), By Segment 1, 2019 & 2027
Figure 68: Asia Pacific Myelodysplastic Syndromes (MDS) Treatment Market Forecast (USD Billion), by Sub-Segment 1, 2016-2027
Figure 69: Asia Pacific Myelodysplastic Syndromes (MDS) Treatment Market Forecast (USD Billion), by Sub-Segment 2, 2016-2027
Figure 70: Asia Pacific Myelodysplastic Syndromes (MDS) Treatment Market Value Share (%), By Segment 2, 2019 & 2027
Figure 71: Asia Pacific Myelodysplastic Syndromes (MDS) Treatment Market Forecast (USD Billion), by Sub-Segment 1, 2016-2027
Figure 72: Asia Pacific Myelodysplastic Syndromes (MDS) Treatment Market Forecast (USD Billion), by Sub-Segment 2, 2016-2027
Figure 73: Asia Pacific Myelodysplastic Syndromes (MDS) Treatment Market Forecast (USD Billion), by Sub-Segment 3, 2016-2027
Figure 74: Asia Pacific Myelodysplastic Syndromes (MDS) Treatment Market Forecast (USD Billion), by Others, 2016-2027
Figure 75: Asia Pacific Myelodysplastic Syndromes (MDS) Treatment Market Value Share (%), By Segment 3, 2019 & 2027
Figure 76: Asia Pacific Myelodysplastic Syndromes (MDS) Treatment Market Forecast (USD Billion), by Sub-Segment 1, 2016-2027
Figure 77: Asia Pacific Myelodysplastic Syndromes (MDS) Treatment Market Forecast (USD Billion), by Sub-Segment 2, 2016-2027
Figure 78: Asia Pacific Myelodysplastic Syndromes (MDS) Treatment Market Forecast (USD Billion), by Sub-Segment 3, 2016-2027
Figure 79: Asia Pacific Myelodysplastic Syndromes (MDS) Treatment Market Forecast (USD Billion), by Others, 2016-2027
Figure 80: Asia Pacific Myelodysplastic Syndromes (MDS) Treatment Market Forecast (USD Billion), by China, 2016-2027
Figure 81: Asia Pacific Myelodysplastic Syndromes (MDS) Treatment Market Forecast (USD Billion), by India, 2016-2027
Figure 82: Asia Pacific Myelodysplastic Syndromes (MDS) Treatment Market Forecast (USD Billion), by Japan, 2016-2027
Figure 83: Asia Pacific Myelodysplastic Syndromes (MDS) Treatment Market Forecast (USD Billion), by Australia, 2016-2027
Figure 84: Asia Pacific Myelodysplastic Syndromes (MDS) Treatment Market Forecast (USD Billion), by Southeast Asia, 2016-2027
Figure 85: Asia Pacific Myelodysplastic Syndromes (MDS) Treatment Market Forecast (USD Billion), by Rest of Asia Pacific, 2016-2027
Figure 86: Middle East & Africa Myelodysplastic Syndromes (MDS) Treatment Market Value Share (%), By Segment 1, 2019 & 2027
Figure 87: Middle East & Africa Myelodysplastic Syndromes (MDS) Treatment Market Forecast (USD Billion), by Sub-Segment 1, 2016-2027
Figure 88: Middle East & Africa Myelodysplastic Syndromes (MDS) Treatment Market Forecast (USD Billion), by Sub-Segment 2, 2016-2027
Figure 89: Middle East & Africa Myelodysplastic Syndromes (MDS) Treatment Market Value Share (%), By Segment 2, 2019 & 2027
Figure 90: Middle East & Africa Myelodysplastic Syndromes (MDS) Treatment Market Forecast (USD Billion), by Sub-Segment 1, 2016-2027
Figure 91: Middle East & Africa Myelodysplastic Syndromes (MDS) Treatment Market Forecast (USD Billion), by Sub-Segment 2, 2016-2027
Figure 92: Middle East & Africa Myelodysplastic Syndromes (MDS) Treatment Market Forecast (USD Billion), by Sub-Segment 3, 2016-2027
Figure 93: Middle East & Africa Myelodysplastic Syndromes (MDS) Treatment Market Forecast (USD Billion), by Others, 2016-2027
Figure 94: Middle East & Africa Myelodysplastic Syndromes (MDS) Treatment Market Value Share (%), By Segment 3, 2019 & 2027
Figure 95: Middle East & Africa Myelodysplastic Syndromes (MDS) Treatment Market Forecast (USD Billion), by Sub-Segment 1, 2016-2027
Figure 96: Middle East & Africa Myelodysplastic Syndromes (MDS) Treatment Market Forecast (USD Billion), by Sub-Segment 2, 2016-2027
Figure 97: Middle East & Africa Myelodysplastic Syndromes (MDS) Treatment Market Forecast (USD Billion), by Sub-Segment 3, 2016-2027
Figure 98: Middle East & Africa Myelodysplastic Syndromes (MDS) Treatment Market Forecast (USD Billion), by Others, 2016-2027
Figure 99: Middle East & Africa Myelodysplastic Syndromes (MDS) Treatment Market Forecast (USD Billion), by GCC, 2016-2027
Figure 100: Middle East & Africa Myelodysplastic Syndromes (MDS) Treatment Market Forecast (USD Billion), by South Africa, 2016-2027
Figure 101: Middle East & Africa Myelodysplastic Syndromes (MDS) Treatment Market Forecast (USD Billion), by Rest of Middle East & Africa, 2016-2027
List of Tables
Table 1: Global Myelodysplastic Syndromes (MDS) Treatment Market Revenue (USD Billion) Forecast, by Segment 1, 2016-2027
Table 2: Global Myelodysplastic Syndromes (MDS) Treatment Market Revenue (USD Billion) Forecast, by Segment 2, 2016-2027
Table 3: Global Myelodysplastic Syndromes (MDS) Treatment Market Revenue (USD Billion) Forecast, by Segment 3, 2016-2027
Table 4: Global Myelodysplastic Syndromes (MDS) Treatment Market Revenue (USD Billion) Forecast, by Region, 2016-2027
Table 5: North America Myelodysplastic Syndromes (MDS) Treatment Market Revenue (USD Billion) Forecast, by Segment 1, 2016-2027
Table 6: North America Myelodysplastic Syndromes (MDS) Treatment Market Revenue (USD Billion) Forecast, by Segment 2, 2016-2027
Table 7: North America Myelodysplastic Syndromes (MDS) Treatment Market Revenue (USD Billion) Forecast, by Segment 3, 2016-2027
Table 8: North America Myelodysplastic Syndromes (MDS) Treatment Market Revenue (USD Billion) Forecast, by Country, 2016-2027
Table 9: Europe Myelodysplastic Syndromes (MDS) Treatment Market Revenue (USD Billion) Forecast, by Segment 1, 2016-2027
Table 10: Europe Myelodysplastic Syndromes (MDS) Treatment Market Revenue (USD Billion) Forecast, by Segment 2, 2016-2027
Table 11: Europe Myelodysplastic Syndromes (MDS) Treatment Market Revenue (USD Billion) Forecast, by Segment 3, 2016-2027
Table 12: Europe Myelodysplastic Syndromes (MDS) Treatment Market Revenue (USD Billion) Forecast, by Country, 2016-2027
Table 13: Latin America Myelodysplastic Syndromes (MDS) Treatment Market Revenue (USD Billion) Forecast, by Segment 1, 2016-2027
Table 14: Latin America Myelodysplastic Syndromes (MDS) Treatment Market Revenue (USD Billion) Forecast, by Segment 2, 2016-2027
Table 15: Latin America Myelodysplastic Syndromes (MDS) Treatment Market Revenue (USD Billion) Forecast, by Segment 3, 2016-2027
Table 16: Latin America Myelodysplastic Syndromes (MDS) Treatment Market Revenue (USD Billion) Forecast, by Country, 2016-2027
Table 17: Asia Pacific Myelodysplastic Syndromes (MDS) Treatment Market Revenue (USD Billion) Forecast, by Segment 1, 2016-2027
Table 18: Asia Pacific Myelodysplastic Syndromes (MDS) Treatment Market Revenue (USD Billion) Forecast, by Segment 2, 2016-2027
Table 19: Asia Pacific Myelodysplastic Syndromes (MDS) Treatment Market Revenue (USD Billion) Forecast, by Segment 3, 2016-2027
Table 20: Asia Pacific Myelodysplastic Syndromes (MDS) Treatment Market Revenue (USD Billion) Forecast, by Country, 2016-2027
Table 21: Middle East & Africa Myelodysplastic Syndromes (MDS) Treatment Market Revenue (USD Billion) Forecast, by Segment 1, 2016-2027
Table 22: Middle East & Africa Myelodysplastic Syndromes (MDS) Treatment Market Revenue (USD Billion) Forecast, by Segment 2, 2016-2027
Table 23: Middle East & Africa Myelodysplastic Syndromes (MDS) Treatment Market Revenue (USD Billion) Forecast, by Segment 3, 2016-2027
Table 24: Middle East & Africa Myelodysplastic Syndromes (MDS) Treatment Market Revenue (USD Billion) Forecast, by Country, 2016-2027
Research Process
Data Library Research are conducted by industry experts who offer insight on
industry structure, market segmentations technology assessment and competitive landscape (CL), and penetration, as well as on emerging trends. Their analysis is based on primary interviews (~ 80%) and secondary research (~ 20%) as well as years of professional expertise in their respective industries. Adding to this, by analysing historical trends and current market positions, our analysts predict where the market will be headed for the next five years. Furthermore, the varying trends of segment & categories geographically presented are also studied and the estimated based on the primary & secondary research.
In this particular report from the supply side Data Library Research has conducted primary surveys (interviews) with the key level executives (VP, CEO’s, Marketing Director, Business Development Manager
and SOFT) of the companies that active & prominent as well as the midsized organization
FIGURE 1: DLR RESEARH PROCESS
![research-methodology1]()
Primary Research
Extensive primary research was conducted to gain a deeper insight of the market and industry performance. The analysis is based on both primary and secondary research as well as years of professional expertise in the respective industries.
In addition to analysing current and historical trends, our analysts predict where the market is headed over the next five years.
It varies by segment for these categories geographically presented in the list of market tables. Speaking about this particular report we have conducted primary surveys (interviews) with the key level executives (VP, CEO’s, Marketing Director, Business Development Manager and many more) of the major players active in the market.
Secondary Research
Secondary research was mainly used to collect and identify information useful for the extensive, technical, market-oriented, and Friend’s study of the Global Extra Neutral Alcohol. It was also used to obtain key information about major players, market classification and segmentation according to the industry trends, geographical markets, and developments related to the market and technology perspectives. For this study, analysts have gathered information from various credible sources, such as annual reports, sec filings, journals, white papers, SOFT presentations, and company web sites.
Market Size Estimation
Both, top-down and bottom-up approaches were used to estimate and validate the size of the Global market and to estimate the size of various other dependent submarkets in the overall Extra Neutral Alcohol. The key players in the market were identified through secondary research and their market contributions in the respective geographies were determined through primary and secondary research.
Forecast Model
![research-methodology2]()