Off-Site Construction Market Overview and Analysis
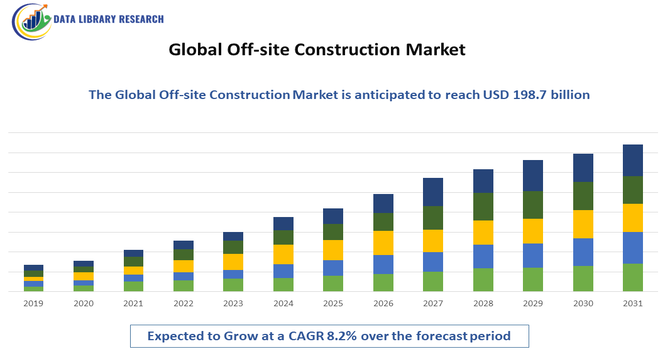
- The Global Off-site Construction Market is growing rapidly, valued at around USD 162.8 billion in 2025, with projected CAGRs of 8.2% through 2025-2032, reaching USD 198.7 billion in 2032.
Get Complete Analysis Of The Report - Download Updated Free Sample PDF
The growth of the Global Off-site Construction Market is primarily driven by the increasing demand for faster, cost-effective, and sustainable building solutions across residential, commercial, and infrastructure sectors. Off-site construction techniques, such as modular, prefabricated, and panelized construction, enable reduced project timelines, lower labor costs, and minimized material wastage, making them attractive for developers and contractors. The rising focus on urbanization, affordable housing, and green building practices further accelerates adoption.
Off-Site Construction Market Latest Trends
The Global Off-site Construction Market is witnessing several key trends driven by innovation, sustainability, and digital integration. There is a growing adoption of modular and prefabricated construction methods that allow for faster project completion and improved quality control. Integration of Building Information Modeling (BIM), digital twins, and automation technologies is enhancing design accuracy, project coordination, and on-site efficiency. Sustainability is also a major trend, with increasing use of recycled materials, energy-efficient designs, and low-carbon construction techniques. Additionally, the rise of smart and connected buildings, along with growing government support for affordable housing projects, is further shaping market dynamics.
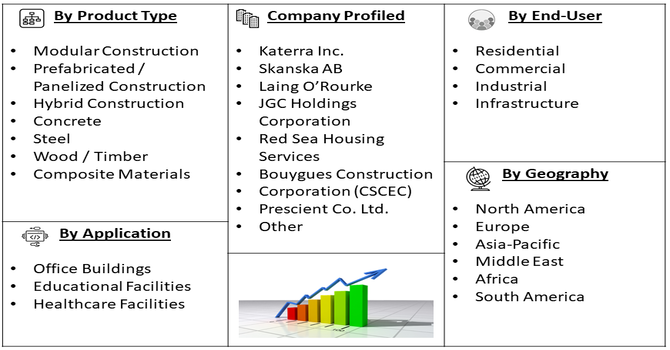
Segmentation: Global Off-site Construction Market is segmented By Construction Type (Modular Construction, Prefabricated / Panelized Construction, Hybrid Construction), Material Type (Concrete, Steel, Wood / Timber, Composite Materials), End-User (Residential, Commercial, Industrial, Infrastructure), Application (Office Buildings, Educational Facilities, Healthcare Facilities), and Geography (North America, Europe, Asia-Pacific, Middle East and Africa, and South America). The report provides the value (in USD million) for the above segments.
For Detailed Market Segmentation - Get a Free Sample PDF
Market Drivers:
- Increasing Demand for Faster and Cost-Efficient Construction
The primary drivers of the off-site construction market is the growing need for speedy project completion and cost savings. Off-site construction techniques, such as modular and prefabricated construction, allow for components to be manufactured in controlled factory environments while site preparation occurs simultaneously. This parallel workflow significantly reduces project timelines, minimizes labor costs, and lowers the risk of delays due to weather or on-site challenges. Developers and contractors are increasingly adopting these methods to optimize budgets, improve resource efficiency, and meet tight delivery schedules, especially in residential, commercial, and infrastructure projects.
- Rising Focus on Sustainability and Green Building Practices
Sustainability is another key driver supporting market growth. Off-site construction reduces material waste, energy consumption, and carbon footprint compared to traditional on-site methods. The use of recyclable and prefabricated materials, along with energy-efficient designs, aligns with global trends toward environmentally responsible construction. Governments and regulatory bodies in many regions are encouraging green building initiatives, offering incentives for energy-efficient and low-carbon construction practices. This increasing emphasis on sustainability is motivating developers and construction companies to adopt off-site construction solutions that are both environmentally friendly and economically viable.
Market Restraints:
- High Initial Capital Investment
A significant restraint for the off-site construction market is the high upfront investment required for establishing manufacturing facilities, acquiring specialized machinery, and developing modular components. Unlike traditional on-site construction, off-site methods demand advanced production setups, quality control systems, and transportation logistics for pre-fabricated modules. Small and medium-sized construction companies, particularly in developing regions, often find these costs prohibitive. This can limit market penetration and slow adoption, as the return on investment may take time to materialize despite long-term cost savings and efficiency gains.
Socioeconomic Impact on Off-site Construction Market
The global off-site construction market has had a significant socioeconomic impact by transforming traditional construction practices, reducing project timelines, and lowering labor and material costs. By enabling prefabrication and modular construction, it has increased efficiency, minimized on-site hazards, and reduced environmental pollution, contributing to safer and more sustainable urban development. The market has generated employment opportunities in manufacturing, logistics, and engineering while fostering technological innovation in design, automation, and building materials. Faster project delivery has accelerated infrastructure development, housing availability, and commercial expansion, improving living standards and economic productivity.
Segmental Analysis:
- ]Off-site Construction segment is expected to witness the highest growth over the forecast period
The Global Off-site Construction segment is expected to witness the highest growth over the forecast period, driven by the increasing demand for faster, cost-efficient, and high-quality building solutions. Off-site construction techniques, including modular and prefabricated methods, enable reduced project timelines, lower labor costs, and minimized material wastage, making them highly attractive across residential, commercial, and infrastructure projects. Rising urbanization, government initiatives for affordable housing, and growing emphasis on sustainable and energy-efficient construction practices are further supporting adoption. Additionally, advancements in digital design, automation, and standardized manufacturing processes are enhancing scalability and precision, fueling robust market expansion globally.
- Modular Construction segment is expected to witness the highest growth over the forecast period
Modular construction is a major driver in the off-site construction market due to its ability to accelerate project timelines, improve quality control, and reduce on-site labor requirements. Entire building modules are prefabricated in factories and assembled on-site, allowing simultaneous site preparation and module manufacturing. This method is particularly effective for residential complexes, hotels, and healthcare facilities where uniformity, speed, and cost efficiency are critical. The scalability and flexibility of modular construction make it a preferred choice for developers looking to optimize resources and meet tight project schedules.
- Steel segment is expected to witness the highest growth over the forecast period
Steel is widely used in off-site construction for its strength, durability, and versatility. It allows for lightweight, high-strength structural frameworks that can be easily fabricated in factory settings and transported to construction sites. Steel-based modular and prefabricated structures are increasingly adopted in commercial, industrial, and educational buildings due to their resistance to environmental stress, ease of assembly, and recyclability, aligning with sustainable building practices and long-term durability requirements.
- Residential segment is expected to witness the highest growth over the forecast period
The residential sector represents a key end-user for off-site construction solutions. Growing urbanization, housing shortages, and demand for affordable and high-quality homes are driving the adoption of modular and prefabricated housing solutions. Off-site construction allows residential developers to accelerate project delivery, minimize labor costs, and reduce material wastage, making it particularly appealing for large-scale housing projects, apartments, and multi-family dwellings.
- Healthcare Facilities segment is expected to witness the highest growth over the forecast period
Healthcare facilities increasingly rely on off-site construction due to the need for rapid deployment, standardized designs, and strict quality standards. Modular construction enables the creation of hospital wards, clinics, and diagnostic centers in a shorter timeframe, with minimal disruption to surrounding areas. Prefabricated components ensure adherence to regulatory and hygiene standards, supporting operational efficiency and patient safety while meeting the growing demand for healthcare infrastructure in urban and remote regions.
- North America region is expected to witness the highest growth over the forecast period
The North America region is expected to witness the highest growth over the forecast period in the off-site construction market, driven by increasing demand for faster, cost-effective, and sustainable building solutions. The region’s well-established construction infrastructure, high adoption of modular and prefabricated construction technologies, and strong focus on green building practices are key growth enablers. Additionally, government initiatives promoting affordable housing, urban development projects, and disaster-resilient structures, along with rising investments in digital construction technologies and automation, are further accelerating market adoption, making North America a leading hub for off-site construction solutions.
| Report Matrics |
Details |
| Market Size Value |
USD 198.7 billion |
| Growth Rate |
CAGR of 8.2 % |
| Forecast |
2026-2033 |
| Historical data |
2021-2024 |
| Base Year |
2025 |
| Report Coverage |
Forecasted revenue, company rating, competitive environment, growth drivers, and trends |
| Segment Coverage |
Type, Application, End-User, Geography |
| Regional Scope |
North America, Europe, Asia Pacific, Middle East |
| Customized scope |
Free customization of reports (With 3 months Analysis Support ) |
| To Learn More About This Report |
Request a Free Sample Copy |
Off-site Construction Market Competitive Landscape
The competitive landscape of the Global Off-site Construction Market is characterized by the presence of leading modular and prefabricated construction companies, technology-driven solution providers, and innovative construction firms focusing on quality, speed, and sustainability. Companies compete on project execution efficiency, customization capabilities, material innovation, and integration of digital technologies such as BIM and automated manufacturing. Strategic partnerships with real estate developers, investments in modular manufacturing facilities, and expansion into emerging markets are key strategies for gaining market share. The market is moderately consolidated, with several global players dominating the supply of off-site construction solutions.
Key Players:
- Katerra Inc.
- Skanska AB
- Laing O’Rourke
- JGC Holdings Corporation
- Red Sea Housing Services
- Bouygues Construction
- Larsen & Toubro Limited
- China State Construction Engineering Corporation (CSCEC)
- Prescient Co. Ltd.
- Clark Pacific
- Guerdon Modular Buildings
- Modular Building Institute (MBI) Member Companies
- Algeco Scotsman
- Sekisui House Ltd.
- CBI Off-Site Ltd.
- Wernick Group
- Premier Modular
- WillScot Corporation
- Contech Engineered Solutions
- Hickman Group
Recent Development:
- In January 2025, research published by Journal of Construction Engineering and Management, reported that multiskilled labor had addressed workforce shortages and enhanced productivity in the global off-site construction market. By improving efficiency, reducing costs, and accelerating project completion, multiskilling supported wider adoption of off-site construction. However, challenges such as training, resource management, and manufacturing dependence influenced implementation, emphasizing the need for strategic planning and workforce development.
- In Janaury 2025, research published by Department for Engineering and Built Environment, Birmingham City University, stated that integrating Digital Twin (DT) technology and AI-driven decision models had improved cost estimation, material efficiency, and sustainability in modular housing projects, positively impacting the global off-site construction market. By enabling data-driven cost optimization, real-time decision-making, and reduced lifecycle cost variability, this approach supported faster, more efficient, and economically viable off-site construction delivery.
Frequently Asked Questions (FAQ) :
Q1. What are the main growth-driving factors for this market?
The key drivers include rapid global urbanization and the urgent demand for faster, more affordable housing and infrastructure. Off-site construction significantly reduces on-site labor and project time. Furthermore, increasing government focus on green building concepts and achieving higher quality standards also boosts adoption.
Q2. What are the main restraining factors for this market?
The primary restraints are the high initial capital investment needed to establish manufacturing facilities and the complex logistics of transporting large prefabricated modules. Additionally, resistance from traditional construction labor unions and a shortage of personnel skilled in modular techniques can impede widespread growth.
Q3. Which segment is expected to witness high growth?
The Residential application segment is anticipated to witness the highest growth. This is driven by the severe global shortage of housing units and the necessity for scalable, cost-effective solutions. By material, the Steel segment is also projected to hold a dominant and fast-growing position due to its stability.
Q4. Who are the top major players for this market?
The global market features key players who focus on modular and prefabricated solutions. Top companies include ATCO, Skanska AB, Lendlease Corporation, SG Blocks Inc, and Honomobo Corporation. These firms are often leveraging partnerships and technological advancements like BIM to expand their service offerings.
Q5. Which country is the largest player?
North America, primarily the United States, is currently the largest player in terms of market revenue, driven by established infrastructure and high construction demand. However, the Asia-Pacific region, led by China and India, is forecast to exhibit the fastest growth rate due to massive industrialization and urbanization projects.
List of Figures
Figure 1: Global Off-site Construction Market Revenue Breakdown (USD Billion, %) by Region, 2022 & 2029
Figure 2: Global Off-site Construction Market Value Share (%), By Segment 1, 2022 & 2029
Figure 3: Global Off-site Construction Market Forecast (USD Billion), by Sub-Segment 1, 2018-2029
Figure 4: Global Off-site Construction Market Forecast (USD Billion), by Sub-Segment 2, 2018-2029
Figure 5: Global Off-site Construction Market Value Share (%), By Segment 2, 2022 & 2029
Figure 6: Global Off-site Construction Market Forecast (USD Billion), by Sub-Segment 1, 2018-2029
Figure 7: Global Off-site Construction Market Forecast (USD Billion), by Sub-Segment 2, 2018-2029
Figure 8: Global Off-site Construction Market Forecast (USD Billion), by Sub-Segment 3, 2018-2029
Figure 9: Global Off-site Construction Market Forecast (USD Billion), by Others, 2018-2029
Figure 10: Global Off-site Construction Market Value Share (%), By Segment 3, 2022 & 2029
Figure 11: Global Off-site Construction Market Forecast (USD Billion), by Sub-Segment 1, 2018-2029
Figure 12: Global Off-site Construction Market Forecast (USD Billion), by Sub-Segment 2, 2018-2029
Figure 13: Global Off-site Construction Market Forecast (USD Billion), by Sub-Segment 3, 2018-2029
Figure 14: Global Off-site Construction Market Forecast (USD Billion), by Others, 2018-2029
Figure 15: Global Off-site Construction Market Value (USD Billion), by Region, 2022 & 2029
Figure 16: North America Off-site Construction Market Value Share (%), By Segment 1, 2022 & 2029
Figure 17: North America Off-site Construction Market Forecast (USD Billion), by Sub-Segment 1, 2018-2029
Figure 18: North America Off-site Construction Market Forecast (USD Billion), by Sub-Segment 2, 2018-2029
Figure 19: North America Off-site Construction Market Value Share (%), By Segment 2, 2022 & 2029
Figure 20: North America Off-site Construction Market Forecast (USD Billion), by Sub-Segment 1, 2018-2029
Figure 21: North America Off-site Construction Market Forecast (USD Billion), by Sub-Segment 2, 2018-2029
Figure 22: North America Off-site Construction Market Forecast (USD Billion), by Sub-Segment 3, 2018-2029
Figure 23: North America Off-site Construction Market Forecast (USD Billion), by Others, 2018-2029
Figure 24: North America Off-site Construction Market Value Share (%), By Segment 3, 2022 & 2029
Figure 25: North America Off-site Construction Market Forecast (USD Billion), by Sub-Segment 1, 2018-2029
Figure 26: North America Off-site Construction Market Forecast (USD Billion), by Sub-Segment 2, 2018-2029
Figure 27: North America Off-site Construction Market Forecast (USD Billion), by Sub-Segment 3, 2018-2029
Figure 28: North America Off-site Construction Market Forecast (USD Billion), by Others, 2018-2029
Figure 29: North America Off-site Construction Market Forecast (USD Billion), by U.S., 2018-2029
Figure 30: North America Off-site Construction Market Forecast (USD Billion), by Canada, 2018-2029
Figure 31: Latin America Off-site Construction Market Value Share (%), By Segment 1, 2022 & 2029
Figure 32: Latin America Off-site Construction Market Forecast (USD Billion), by Sub-Segment 1, 2018-2029
Figure 33: Latin America Off-site Construction Market Forecast (USD Billion), by Sub-Segment 2, 2018-2029
Figure 34: Latin America Off-site Construction Market Value Share (%), By Segment 2, 2022 & 2029
Figure 35: Latin America Off-site Construction Market Forecast (USD Billion), by Sub-Segment 1, 2018-2029
Figure 36: Latin America Off-site Construction Market Forecast (USD Billion), by Sub-Segment 2, 2018-2029
Figure 37: Latin America Off-site Construction Market Forecast (USD Billion), by Sub-Segment 3, 2018-2029
Figure 38: Latin America Off-site Construction Market Forecast (USD Billion), by Others, 2018-2029
Figure 39: Latin America Off-site Construction Market Value Share (%), By Segment 3, 2022 & 2029
Figure 40: Latin America Off-site Construction Market Forecast (USD Billion), by Sub-Segment 1, 2018-2029
Figure 41: Latin America Off-site Construction Market Forecast (USD Billion), by Sub-Segment 2, 2018-2029
Figure 42: Latin America Off-site Construction Market Forecast (USD Billion), by Sub-Segment 3, 2018-2029
Figure 43: Latin America Off-site Construction Market Forecast (USD Billion), by Others, 2018-2029
Figure 44: Latin America Off-site Construction Market Forecast (USD Billion), by Brazil, 2018-2029
Figure 45: Latin America Off-site Construction Market Forecast (USD Billion), by Mexico, 2018-2029
Figure 46: Latin America Off-site Construction Market Forecast (USD Billion), by Rest of Latin America, 2018-2029
Figure 47: Europe Off-site Construction Market Value Share (%), By Segment 1, 2022 & 2029
Figure 48: Europe Off-site Construction Market Forecast (USD Billion), by Sub-Segment 1, 2018-2029
Figure 49: Europe Off-site Construction Market Forecast (USD Billion), by Sub-Segment 2, 2018-2029
Figure 50: Europe Off-site Construction Market Value Share (%), By Segment 2, 2022 & 2029
Figure 51: Europe Off-site Construction Market Forecast (USD Billion), by Sub-Segment 1, 2018-2029
Figure 52: Europe Off-site Construction Market Forecast (USD Billion), by Sub-Segment 2, 2018-2029
Figure 53: Europe Off-site Construction Market Forecast (USD Billion), by Sub-Segment 3, 2018-2029
Figure 54: Europe Off-site Construction Market Forecast (USD Billion), by Others, 2018-2029
Figure 55: Europe Off-site Construction Market Value Share (%), By Segment 3, 2022 & 2029
Figure 56: Europe Off-site Construction Market Forecast (USD Billion), by Sub-Segment 1, 2018-2029
Figure 57: Europe Off-site Construction Market Forecast (USD Billion), by Sub-Segment 2, 2018-2029
Figure 58: Europe Off-site Construction Market Forecast (USD Billion), by Sub-Segment 3, 2018-2029
Figure 59: Europe Off-site Construction Market Forecast (USD Billion), by Others, 2018-2029
Figure 60: Europe Off-site Construction Market Forecast (USD Billion), by U.K., 2018-2029
Figure 61: Europe Off-site Construction Market Forecast (USD Billion), by Germany, 2018-2029
Figure 62: Europe Off-site Construction Market Forecast (USD Billion), by France, 2018-2029
Figure 63: Europe Off-site Construction Market Forecast (USD Billion), by Italy, 2018-2029
Figure 64: Europe Off-site Construction Market Forecast (USD Billion), by Spain, 2018-2029
Figure 65: Europe Off-site Construction Market Forecast (USD Billion), by Russia, 2018-2029
Figure 66: Europe Off-site Construction Market Forecast (USD Billion), by Rest of Europe, 2018-2029
Figure 67: Asia Pacific Off-site Construction Market Value Share (%), By Segment 1, 2022 & 2029
Figure 68: Asia Pacific Off-site Construction Market Forecast (USD Billion), by Sub-Segment 1, 2018-2029
Figure 69: Asia Pacific Off-site Construction Market Forecast (USD Billion), by Sub-Segment 2, 2018-2029
Figure 70: Asia Pacific Off-site Construction Market Value Share (%), By Segment 2, 2022 & 2029
Figure 71: Asia Pacific Off-site Construction Market Forecast (USD Billion), by Sub-Segment 1, 2018-2029
Figure 72: Asia Pacific Off-site Construction Market Forecast (USD Billion), by Sub-Segment 2, 2018-2029
Figure 73: Asia Pacific Off-site Construction Market Forecast (USD Billion), by Sub-Segment 3, 2018-2029
Figure 74: Asia Pacific Off-site Construction Market Forecast (USD Billion), by Others, 2018-2029
Figure 75: Asia Pacific Off-site Construction Market Value Share (%), By Segment 3, 2022 & 2029
Figure 76: Asia Pacific Off-site Construction Market Forecast (USD Billion), by Sub-Segment 1, 2018-2029
Figure 77: Asia Pacific Off-site Construction Market Forecast (USD Billion), by Sub-Segment 2, 2018-2029
Figure 78: Asia Pacific Off-site Construction Market Forecast (USD Billion), by Sub-Segment 3, 2018-2029
Figure 79: Asia Pacific Off-site Construction Market Forecast (USD Billion), by Others, 2018-2029
Figure 80: Asia Pacific Off-site Construction Market Forecast (USD Billion), by China, 2018-2029
Figure 81: Asia Pacific Off-site Construction Market Forecast (USD Billion), by India, 2018-2029
Figure 82: Asia Pacific Off-site Construction Market Forecast (USD Billion), by Japan, 2018-2029
Figure 83: Asia Pacific Off-site Construction Market Forecast (USD Billion), by Australia, 2018-2029
Figure 84: Asia Pacific Off-site Construction Market Forecast (USD Billion), by Southeast Asia, 2018-2029
Figure 85: Asia Pacific Off-site Construction Market Forecast (USD Billion), by Rest of Asia Pacific, 2018-2029
Figure 86: Middle East & Africa Off-site Construction Market Value Share (%), By Segment 1, 2022 & 2029
Figure 87: Middle East & Africa Off-site Construction Market Forecast (USD Billion), by Sub-Segment 1, 2018-2029
Figure 88: Middle East & Africa Off-site Construction Market Forecast (USD Billion), by Sub-Segment 2, 2018-2029
Figure 89: Middle East & Africa Off-site Construction Market Value Share (%), By Segment 2, 2022 & 2029
Figure 90: Middle East & Africa Off-site Construction Market Forecast (USD Billion), by Sub-Segment 1, 2018-2029
Figure 91: Middle East & Africa Off-site Construction Market Forecast (USD Billion), by Sub-Segment 2, 2018-2029
Figure 92: Middle East & Africa Off-site Construction Market Forecast (USD Billion), by Sub-Segment 3, 2018-2029
Figure 93: Middle East & Africa Off-site Construction Market Forecast (USD Billion), by Others, 2018-2029
Figure 94: Middle East & Africa Off-site Construction Market Value Share (%), By Segment 3, 2022 & 2029
Figure 95: Middle East & Africa Off-site Construction Market Forecast (USD Billion), by Sub-Segment 1, 2018-2029
Figure 96: Middle East & Africa Off-site Construction Market Forecast (USD Billion), by Sub-Segment 2, 2018-2029
Figure 97: Middle East & Africa Off-site Construction Market Forecast (USD Billion), by Sub-Segment 3, 2018-2029
Figure 98: Middle East & Africa Off-site Construction Market Forecast (USD Billion), by Others, 2018-2029
Figure 99: Middle East & Africa Off-site Construction Market Forecast (USD Billion), by GCC, 2018-2029
Figure 100: Middle East & Africa Off-site Construction Market Forecast (USD Billion), by South Africa, 2018-2029
Figure 101: Middle East & Africa Off-site Construction Market Forecast (USD Billion), by Rest of Middle East & Africa, 2018-2029
List of Tables
Table 1: Global Off-site Construction Market Revenue (USD Billion) Forecast, by Segment 1, 2018-2029
Table 2: Global Off-site Construction Market Revenue (USD Billion) Forecast, by Segment 2, 2018-2029
Table 3: Global Off-site Construction Market Revenue (USD Billion) Forecast, by Segment 3, 2018-2029
Table 4: Global Off-site Construction Market Revenue (USD Billion) Forecast, by Region, 2018-2029
Table 5: North America Off-site Construction Market Revenue (USD Billion) Forecast, by Segment 1, 2018-2029
Table 6: North America Off-site Construction Market Revenue (USD Billion) Forecast, by Segment 2, 2018-2029
Table 7: North America Off-site Construction Market Revenue (USD Billion) Forecast, by Segment 3, 2018-2029
Table 8: North America Off-site Construction Market Revenue (USD Billion) Forecast, by Country, 2018-2029
Table 9: Europe Off-site Construction Market Revenue (USD Billion) Forecast, by Segment 1, 2018-2029
Table 10: Europe Off-site Construction Market Revenue (USD Billion) Forecast, by Segment 2, 2018-2029
Table 11: Europe Off-site Construction Market Revenue (USD Billion) Forecast, by Segment 3, 2018-2029
Table 12: Europe Off-site Construction Market Revenue (USD Billion) Forecast, by Country, 2018-2029
Table 13: Latin America Off-site Construction Market Revenue (USD Billion) Forecast, by Segment 1, 2018-2029
Table 14: Latin America Off-site Construction Market Revenue (USD Billion) Forecast, by Segment 2, 2018-2029
Table 15: Latin America Off-site Construction Market Revenue (USD Billion) Forecast, by Segment 3, 2018-2029
Table 16: Latin America Off-site Construction Market Revenue (USD Billion) Forecast, by Country, 2018-2029
Table 17: Asia Pacific Off-site Construction Market Revenue (USD Billion) Forecast, by Segment 1, 2018-2029
Table 18: Asia Pacific Off-site Construction Market Revenue (USD Billion) Forecast, by Segment 2, 2018-2029
Table 19: Asia Pacific Off-site Construction Market Revenue (USD Billion) Forecast, by Segment 3, 2018-2029
Table 20: Asia Pacific Off-site Construction Market Revenue (USD Billion) Forecast, by Country, 2018-2029
Table 21: Middle East & Africa Off-site Construction Market Revenue (USD Billion) Forecast, by Segment 1, 2018-2029
Table 22: Middle East & Africa Off-site Construction Market Revenue (USD Billion) Forecast, by Segment 2, 2018-2029
Table 23: Middle East & Africa Off-site Construction Market Revenue (USD Billion) Forecast, by Segment 3, 2018-2029
Table 24: Middle East & Africa Off-site Construction Market Revenue (USD Billion) Forecast, by Country, 2018-2029
Research Process
Data Library Research are conducted by industry experts who offer insight on
industry structure, market segmentations technology assessment and competitive landscape (CL), and penetration, as well as on emerging trends. Their analysis is based on primary interviews (~ 80%) and secondary research (~ 20%) as well as years of professional expertise in their respective industries. Adding to this, by analysing historical trends and current market positions, our analysts predict where the market will be headed for the next five years. Furthermore, the varying trends of segment & categories geographically presented are also studied and the estimated based on the primary & secondary research.
In this particular report from the supply side Data Library Research has conducted primary surveys (interviews) with the key level executives (VP, CEO’s, Marketing Director, Business Development Manager
and SOFT) of the companies that active & prominent as well as the midsized organization
FIGURE 1: DLR RESEARH PROCESS
![research-methodology1]()
Primary Research
Extensive primary research was conducted to gain a deeper insight of the market and industry performance. The analysis is based on both primary and secondary research as well as years of professional expertise in the respective industries.
In addition to analysing current and historical trends, our analysts predict where the market is headed over the next five years.
It varies by segment for these categories geographically presented in the list of market tables. Speaking about this particular report we have conducted primary surveys (interviews) with the key level executives (VP, CEO’s, Marketing Director, Business Development Manager and many more) of the major players active in the market.
Secondary Research
Secondary research was mainly used to collect and identify information useful for the extensive, technical, market-oriented, and Friend’s study of the Global Extra Neutral Alcohol. It was also used to obtain key information about major players, market classification and segmentation according to the industry trends, geographical markets, and developments related to the market and technology perspectives. For this study, analysts have gathered information from various credible sources, such as annual reports, sec filings, journals, white papers, SOFT presentations, and company web sites.
Market Size Estimation
Both, top-down and bottom-up approaches were used to estimate and validate the size of the Global market and to estimate the size of various other dependent submarkets in the overall Extra Neutral Alcohol. The key players in the market were identified through secondary research and their market contributions in the respective geographies were determined through primary and secondary research.
Forecast Model
![research-methodology2]()