Offshore Drilling Engineering Services Market Overview and Analysis
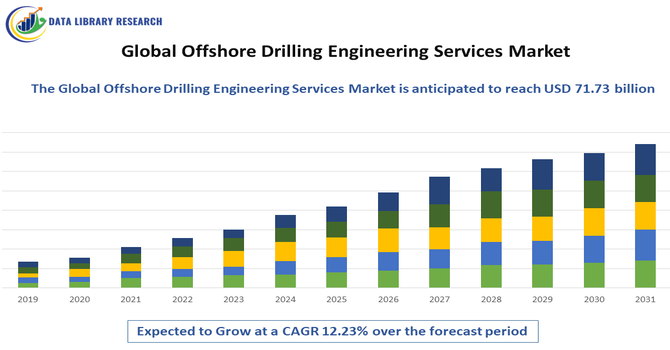
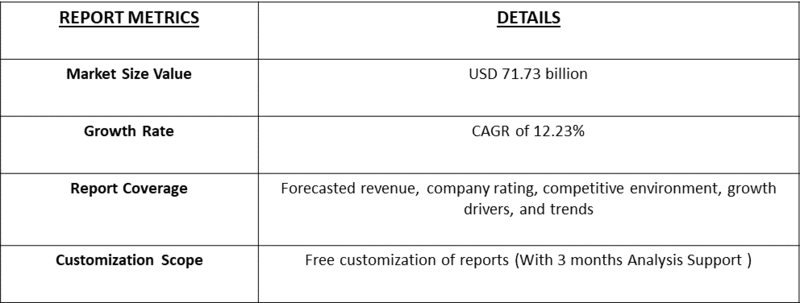
- The Global Offshore Drilling Engineering Services Market size was valued at USD 43.78 billion in 2026, and this market is projected to be worth USD 71.73 billion in 2033, growing with a CAGR of 12.23% from 2026-2033.
Get Complete Analysis Of The Report - Download Updated Free Sample PDF
The Global Offshore Drilling Engineering Services Market comprises specialized technical and engineering services that support offshore oil and gas drilling operations. These services include well design, drilling optimization, project management, feasibility studies, risk assessment, and compliance with environmental and safety regulations. The growth is driven by rising energy demand, exploration of complex offshore reserves, and advancements in drilling technologies. Further, the increasing investments in offshore exploration, coupled with the need for sustainable and safe operations, continue to shape market expansion worldwide.
Offshore Drilling Engineering Services Market Latest Trends
The global offshore drilling engineering services market is being shaped by a notable shift toward deepwater and ultra-deepwater exploration as onshore reserves deplete and companies pursue untapped offshore resources. Adoption of digital technologies—such as AI, data analytics, and remote monitoring—is enhancing drilling precision and operational efficiency, while modular engineering designs reduce project timelines and costs. Sustainability initiatives have gained traction, with firms implementing greener drilling practices and emission-reducing technologies. Collaboration between service providers and oil majors supports technology transfer and integrated solutions.
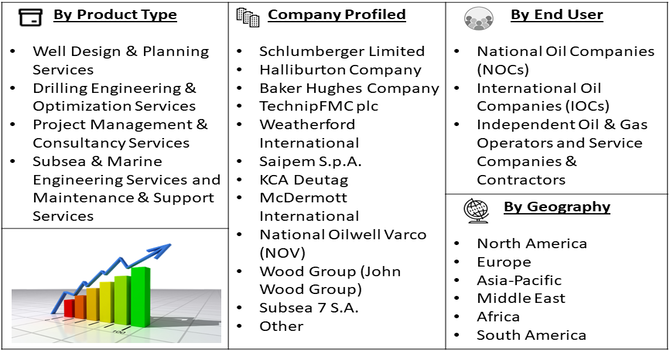
Segmentation: The Global Offshore Drilling Engineering Services Market is segmented by Service Type (Well Design & Planning Services, Drilling Engineering & Optimization Services, Project Management & Consultancy Services, Subsea & Marine Engineering Services and Maintenance & Support Services), Drilling Type (Shallow Water Drilling, Deepwater Drilling and Ultra-Deepwater Drilling), End-User (National Oil Companies (NOCs), International Oil Companies (IOCs), Independent Oil & Gas Operators and Service Companies & Contractors), and Geography (North America, Europe, Asia-Pacific, Middle East and Africa, and South America). The report provides the value (in USD million) for the above segments.
For Detailed Market Segmentation - Get a Free Sample PDF
Market Drivers:
- Growing Demand for Energy and Offshore Hydrocarbon Exploration
Rising global energy demand and the gradual depletion of easily accessible onshore reserves are driving increased investment in offshore hydrocarbon exploration. Oil and gas companies are expanding drilling activities in deepwater and ultra-deepwater regions to secure long-term energy supplies. Offshore drilling engineering services play a critical role in well planning, drilling optimization, risk assessment, and project execution in complex marine environments. Advanced engineering expertise helps reduce operational uncertainties, improve drilling efficiency, and manage high-pressure, high-temperature conditions. As energy consumption continues to rise, particularly in developing economies, demand for specialized offshore drilling engineering services is expected to grow steadily.
- Technological Advancements in Offshore Drilling Operations
Technological advancements are significantly driving the offshore drilling engineering services market by improving safety, efficiency, and cost-effectiveness. The adoption of digital tools such as real-time data analytics, artificial intelligence, and automated drilling systems enables better decision-making and enhanced well control. Innovations in drilling equipment, subsea systems, and remote monitoring reduce non-productive time and operational risks.
In 2025, The leadership appointments at Adura by Equinor and Shell reinforced technological advancement in offshore drilling operations, driving innovation and operational excellence. This strengthened the global offshore drilling engineering services market by emphasizing efficient, well-governed, and technologically advanced project execution. Engineering service providers are increasingly offering integrated solutions that combine design, simulation, and execution support. These technological improvements allow operators to undertake complex offshore projects with greater confidence, supporting market growth while meeting stringent environmental and safety requirements.
Market Restraints:
- High Operational Costs and Environmental Regulations
High operational costs and stringent environmental regulations act as major restraints on the offshore drilling engineering services market. Offshore drilling projects require significant capital investment for equipment, specialized vessels, skilled personnel, and advanced engineering solutions. Additionally, compliance with strict environmental regulations related to emissions, waste disposal, and marine ecosystem protection increases project complexity and costs. Regulatory delays and approval challenges can also extend project timelines, affecting profitability. These financial and regulatory pressures may discourage smaller operators and limit offshore exploration activities, particularly in volatile oil price environments, thereby restraining the overall growth of the market.
Socioeconomic Impact on Offshore Drilling Engineering Services Market
The offshore drilling engineering services market has significant socioeconomic impacts, driving employment, infrastructure investment, and technological development. It creates jobs for engineers, technicians, and support personnel, particularly in regions with major offshore projects, boosting local economies. Enhanced drilling efficiency and safety help secure energy supplies, which is vital for industrial growth and economic stability. Furthermore, investments in offshore projects stimulate ancillary sectors such as marine construction, logistics, and manufacturing. However, the sector also faces challenges, including environmental concerns and workforce shortages in remote locations, which require careful policy and educational support. Thus, the market contributes to economic activity while highlighting the need for sustainable practices.
Segmental Analysis:
- Drilling Engineering & Optimization Services segment is expected to witness highest growth over the forecast period
The drilling engineering and optimization services segment is expected to witness the highest growth over the forecast period due to increasing emphasis on cost efficiency, operational safety, and enhanced well performance. Oil and gas operators are adopting advanced drilling optimization techniques, including real-time data analytics, automation, and predictive modeling, to minimize non-productive time and drilling risks. These services enable improved rate of penetration, better wellbore stability, and optimized drilling parameters. As offshore projects become more complex and capital-intensive, demand for specialized engineering expertise that improves drilling efficiency and reduces overall project costs continues to rise, driving strong growth in this segment.
- Shallow Water Drilling segment is expected to witness highest growth over the forecast period
The shallow water drilling segment is expected to experience the highest growth due to its lower operational costs, reduced technical complexity, and quicker project execution compared to deepwater operations. Many oil and gas companies are prioritizing shallow water developments to achieve faster returns on investment while mitigating financial and operational risks. Technological advancements have also improved recovery rates and drilling efficiency in shallow water fields, making them economically attractive. Additionally, redevelopment of mature offshore fields and brownfield projects in regions such as North America, the Middle East, and Asia Pacific is boosting demand for engineering services tailored to shallow water drilling activities.
- Independent Oil & Gas Operators segment is expected to witness highest growth over the forecast period
Independent oil and gas operators are expected to witness the highest growth in demand for offshore drilling engineering services as they increasingly outsource specialized technical expertise. These operators often lack in-house engineering capabilities for complex offshore projects and rely on external service providers for well planning, drilling optimization, and project management. Rising offshore exploration activity by independent companies, particularly in shallow and mid-depth waters, is fueling demand. Outsourcing allows these operators to reduce capital investment, improve operational efficiency, and manage risks effectively. As independents expand offshore portfolios, their dependence on engineering service providers continues to grow.
- North American Region is expected to witness highest growth over the forecast period
North America is expected to witness the highest growth in the offshore drilling engineering services market, driven by increased exploration and production activities in the Gulf of Mexico.
Continued investment in offshore infrastructure, redevelopment of mature fields, and technological advancements in drilling engineering support market expansion. For instance, in 2025, The ADNOC Drilling contract award highlighted growing global demand for integrated drilling services and advanced engineering capabilities, influencing North America’s offshore drilling engineering services market. The large-scale, multi-service scope underscored the importance of bundled engineering solutions, extended-reach drilling, and reservoir optimization. North American service providers were encouraged to enhance technical integration, digital capabilities, and service efficiency to remain competitive in an increasingly globalized offshore drilling services landscape.
The presence of major oilfield service companies and advanced engineering capabilities further strengthens regional growth. Additionally, supportive regulatory frameworks, improved safety standards, and rising energy demand contribute to increased offshore drilling activities. As operators focus on efficiency and cost optimization, demand for specialized engineering services in North America is projected to grow steadily over the forecast period.
To Learn More About This Report - Request a Free Sample Copy
Offshore Drilling Engineering Services Market Competitive Landscape
The competitive landscape of the offshore drilling engineering services market is moderately consolidated, with major players holding significant shares through technological innovation and broad service offerings. Leading companies like Schlumberger, Halliburton, Baker Hughes, TechnipFMC, and Saipem compete on global presence, engineering capabilities, and digital integration, focusing on AI, automation, and efficiency improvements in high-risk offshore environments. Strategic mergers, acquisitions, and partnerships enhance service portfolios and geographic reach, while smaller specialist firms carve niches with flexible, cost-effective solutions.
The major players for above market are:
- Schlumberger Limited
- Halliburton Company
- Baker Hughes Company
- TechnipFMC plc
- Weatherford International
- Saipem S.p.A.
- KCA Deutag
- McDermott International
- National Oilwell Varco (NOV)
- Wood Group (John Wood Group)
- Subsea 7 S.A.
- Aker Solutions ASA
- Petrofac Limited
- Transocean Ltd.
- Diamond Offshore Drilling
- Noble Corporation
- Oceaneering International
- DeepOcean Group
- COSL (China Oilfield Services Limited)
- ADNOC Drilling
Recent Development
- In May 2024, Thailand’s PTTEP Energy Development Company and Saudi Arabia’s ADES Holding Company entered into an agreement for offshore drilling services valued at 354 million Saudi riyals, equivalent to approximately USD 94.39 million. The contract reflected growing cross-regional collaboration and investment in offshore energy development activities.
- In May 2024, an Indian shipyard launched a pair of vessels intended for offshore oil field operations. The two boats were launched at the San Marine yard in Kakinada, with the event officially confirmed by the Indian Register of Shipping (IRS), the country’s ship classification agency.
Frequently Asked Questions (FAQ) :
Q1. What are the main growth-driving factors for this market?
Increasing global demand for energy and the depletion of onshore reserves are pushing exploration into deeper waters. Technological advancements in subsea engineering and ultra-deepwater drilling have made previously inaccessible reserves economically viable. Furthermore, a renewed focus on energy security is prompting nations to accelerate offshore production to ensure stable supply chains.
Q2. What are the main restraining factors for this market?
The primary restraints include high capital expenditure and the inherent environmental risks associated with offshore operations. Stringent regulatory frameworks following historical oil spills increase compliance costs. Additionally, the global transition toward renewable energy sources and volatile crude oil prices can lead to the postponement or cancellation of expensive long-term drilling projects.
Q3. Which segment is expected to witness high growth?
The Deepwater and Ultra-Deepwater segment is expected to see the highest growth. As shallow-water assets mature, operators are moving toward complex high-pressure, high-temperature (HPHT) environments. Engineering services specializing in automated drilling systems and sophisticated well intervention for deepwater environments are becoming essential for maximizing recovery rates in these frontiers.
Q4. Who are the top major players for this market?
The market is led by diversified oilfield service giants including Schlumberger (SLB), Halliburton, and Baker Hughes. Other significant players include Transocean, Noble Corporation, and Fluor Corporation. These companies provide end-to-end engineering solutions, ranging from initial well design and project management to complex subsea construction and decommissioning services.
Q5. Which country is the largest player?
The United States is currently the largest player, driven primarily by extensive activities in the Gulf of Mexico. The region benefits from a highly developed infrastructure, advanced technological expertise, and a robust regulatory environment. While Brazil and Norway are significant contenders, the U.S. remains the central hub for offshore engineering innovation.
List of Figures
Figure 1: Global Offshore Drilling Engineering Services Market Revenue Breakdown (USD Billion, %) by Region, 2022 & 2029
Figure 2: Global Offshore Drilling Engineering Services Market Value Share (%), By Segment 1, 2022 & 2029
Figure 3: Global Offshore Drilling Engineering Services Market Forecast (USD Billion), by Sub-Segment 1, 2018-2029
Figure 4: Global Offshore Drilling Engineering Services Market Forecast (USD Billion), by Sub-Segment 2, 2018-2029
Figure 5: Global Offshore Drilling Engineering Services Market Value Share (%), By Segment 2, 2022 & 2029
Figure 6: Global Offshore Drilling Engineering Services Market Forecast (USD Billion), by Sub-Segment 1, 2018-2029
Figure 7: Global Offshore Drilling Engineering Services Market Forecast (USD Billion), by Sub-Segment 2, 2018-2029
Figure 8: Global Offshore Drilling Engineering Services Market Forecast (USD Billion), by Sub-Segment 3, 2018-2029
Figure 9: Global Offshore Drilling Engineering Services Market Forecast (USD Billion), by Others, 2018-2029
Figure 10: Global Offshore Drilling Engineering Services Market Value Share (%), By Segment 3, 2022 & 2029
Figure 11: Global Offshore Drilling Engineering Services Market Forecast (USD Billion), by Sub-Segment 1, 2018-2029
Figure 12: Global Offshore Drilling Engineering Services Market Forecast (USD Billion), by Sub-Segment 2, 2018-2029
Figure 13: Global Offshore Drilling Engineering Services Market Forecast (USD Billion), by Sub-Segment 3, 2018-2029
Figure 14: Global Offshore Drilling Engineering Services Market Forecast (USD Billion), by Others, 2018-2029
Figure 15: Global Offshore Drilling Engineering Services Market Value (USD Billion), by Region, 2022 & 2029
Figure 16: North America Offshore Drilling Engineering Services Market Value Share (%), By Segment 1, 2022 & 2029
Figure 17: North America Offshore Drilling Engineering Services Market Forecast (USD Billion), by Sub-Segment 1, 2018-2029
Figure 18: North America Offshore Drilling Engineering Services Market Forecast (USD Billion), by Sub-Segment 2, 2018-2029
Figure 19: North America Offshore Drilling Engineering Services Market Value Share (%), By Segment 2, 2022 & 2029
Figure 20: North America Offshore Drilling Engineering Services Market Forecast (USD Billion), by Sub-Segment 1, 2018-2029
Figure 21: North America Offshore Drilling Engineering Services Market Forecast (USD Billion), by Sub-Segment 2, 2018-2029
Figure 22: North America Offshore Drilling Engineering Services Market Forecast (USD Billion), by Sub-Segment 3, 2018-2029
Figure 23: North America Offshore Drilling Engineering Services Market Forecast (USD Billion), by Others, 2018-2029
Figure 24: North America Offshore Drilling Engineering Services Market Value Share (%), By Segment 3, 2022 & 2029
Figure 25: North America Offshore Drilling Engineering Services Market Forecast (USD Billion), by Sub-Segment 1, 2018-2029
Figure 26: North America Offshore Drilling Engineering Services Market Forecast (USD Billion), by Sub-Segment 2, 2018-2029
Figure 27: North America Offshore Drilling Engineering Services Market Forecast (USD Billion), by Sub-Segment 3, 2018-2029
Figure 28: North America Offshore Drilling Engineering Services Market Forecast (USD Billion), by Others, 2018-2029
Figure 29: North America Offshore Drilling Engineering Services Market Forecast (USD Billion), by U.S., 2018-2029
Figure 30: North America Offshore Drilling Engineering Services Market Forecast (USD Billion), by Canada, 2018-2029
Figure 31: Latin America Offshore Drilling Engineering Services Market Value Share (%), By Segment 1, 2022 & 2029
Figure 32: Latin America Offshore Drilling Engineering Services Market Forecast (USD Billion), by Sub-Segment 1, 2018-2029
Figure 33: Latin America Offshore Drilling Engineering Services Market Forecast (USD Billion), by Sub-Segment 2, 2018-2029
Figure 34: Latin America Offshore Drilling Engineering Services Market Value Share (%), By Segment 2, 2022 & 2029
Figure 35: Latin America Offshore Drilling Engineering Services Market Forecast (USD Billion), by Sub-Segment 1, 2018-2029
Figure 36: Latin America Offshore Drilling Engineering Services Market Forecast (USD Billion), by Sub-Segment 2, 2018-2029
Figure 37: Latin America Offshore Drilling Engineering Services Market Forecast (USD Billion), by Sub-Segment 3, 2018-2029
Figure 38: Latin America Offshore Drilling Engineering Services Market Forecast (USD Billion), by Others, 2018-2029
Figure 39: Latin America Offshore Drilling Engineering Services Market Value Share (%), By Segment 3, 2022 & 2029
Figure 40: Latin America Offshore Drilling Engineering Services Market Forecast (USD Billion), by Sub-Segment 1, 2018-2029
Figure 41: Latin America Offshore Drilling Engineering Services Market Forecast (USD Billion), by Sub-Segment 2, 2018-2029
Figure 42: Latin America Offshore Drilling Engineering Services Market Forecast (USD Billion), by Sub-Segment 3, 2018-2029
Figure 43: Latin America Offshore Drilling Engineering Services Market Forecast (USD Billion), by Others, 2018-2029
Figure 44: Latin America Offshore Drilling Engineering Services Market Forecast (USD Billion), by Brazil, 2018-2029
Figure 45: Latin America Offshore Drilling Engineering Services Market Forecast (USD Billion), by Mexico, 2018-2029
Figure 46: Latin America Offshore Drilling Engineering Services Market Forecast (USD Billion), by Rest of Latin America, 2018-2029
Figure 47: Europe Offshore Drilling Engineering Services Market Value Share (%), By Segment 1, 2022 & 2029
Figure 48: Europe Offshore Drilling Engineering Services Market Forecast (USD Billion), by Sub-Segment 1, 2018-2029
Figure 49: Europe Offshore Drilling Engineering Services Market Forecast (USD Billion), by Sub-Segment 2, 2018-2029
Figure 50: Europe Offshore Drilling Engineering Services Market Value Share (%), By Segment 2, 2022 & 2029
Figure 51: Europe Offshore Drilling Engineering Services Market Forecast (USD Billion), by Sub-Segment 1, 2018-2029
Figure 52: Europe Offshore Drilling Engineering Services Market Forecast (USD Billion), by Sub-Segment 2, 2018-2029
Figure 53: Europe Offshore Drilling Engineering Services Market Forecast (USD Billion), by Sub-Segment 3, 2018-2029
Figure 54: Europe Offshore Drilling Engineering Services Market Forecast (USD Billion), by Others, 2018-2029
Figure 55: Europe Offshore Drilling Engineering Services Market Value Share (%), By Segment 3, 2022 & 2029
Figure 56: Europe Offshore Drilling Engineering Services Market Forecast (USD Billion), by Sub-Segment 1, 2018-2029
Figure 57: Europe Offshore Drilling Engineering Services Market Forecast (USD Billion), by Sub-Segment 2, 2018-2029
Figure 58: Europe Offshore Drilling Engineering Services Market Forecast (USD Billion), by Sub-Segment 3, 2018-2029
Figure 59: Europe Offshore Drilling Engineering Services Market Forecast (USD Billion), by Others, 2018-2029
Figure 60: Europe Offshore Drilling Engineering Services Market Forecast (USD Billion), by U.K., 2018-2029
Figure 61: Europe Offshore Drilling Engineering Services Market Forecast (USD Billion), by Germany, 2018-2029
Figure 62: Europe Offshore Drilling Engineering Services Market Forecast (USD Billion), by France, 2018-2029
Figure 63: Europe Offshore Drilling Engineering Services Market Forecast (USD Billion), by Italy, 2018-2029
Figure 64: Europe Offshore Drilling Engineering Services Market Forecast (USD Billion), by Spain, 2018-2029
Figure 65: Europe Offshore Drilling Engineering Services Market Forecast (USD Billion), by Russia, 2018-2029
Figure 66: Europe Offshore Drilling Engineering Services Market Forecast (USD Billion), by Rest of Europe, 2018-2029
Figure 67: Asia Pacific Offshore Drilling Engineering Services Market Value Share (%), By Segment 1, 2022 & 2029
Figure 68: Asia Pacific Offshore Drilling Engineering Services Market Forecast (USD Billion), by Sub-Segment 1, 2018-2029
Figure 69: Asia Pacific Offshore Drilling Engineering Services Market Forecast (USD Billion), by Sub-Segment 2, 2018-2029
Figure 70: Asia Pacific Offshore Drilling Engineering Services Market Value Share (%), By Segment 2, 2022 & 2029
Figure 71: Asia Pacific Offshore Drilling Engineering Services Market Forecast (USD Billion), by Sub-Segment 1, 2018-2029
Figure 72: Asia Pacific Offshore Drilling Engineering Services Market Forecast (USD Billion), by Sub-Segment 2, 2018-2029
Figure 73: Asia Pacific Offshore Drilling Engineering Services Market Forecast (USD Billion), by Sub-Segment 3, 2018-2029
Figure 74: Asia Pacific Offshore Drilling Engineering Services Market Forecast (USD Billion), by Others, 2018-2029
Figure 75: Asia Pacific Offshore Drilling Engineering Services Market Value Share (%), By Segment 3, 2022 & 2029
Figure 76: Asia Pacific Offshore Drilling Engineering Services Market Forecast (USD Billion), by Sub-Segment 1, 2018-2029
Figure 77: Asia Pacific Offshore Drilling Engineering Services Market Forecast (USD Billion), by Sub-Segment 2, 2018-2029
Figure 78: Asia Pacific Offshore Drilling Engineering Services Market Forecast (USD Billion), by Sub-Segment 3, 2018-2029
Figure 79: Asia Pacific Offshore Drilling Engineering Services Market Forecast (USD Billion), by Others, 2018-2029
Figure 80: Asia Pacific Offshore Drilling Engineering Services Market Forecast (USD Billion), by China, 2018-2029
Figure 81: Asia Pacific Offshore Drilling Engineering Services Market Forecast (USD Billion), by India, 2018-2029
Figure 82: Asia Pacific Offshore Drilling Engineering Services Market Forecast (USD Billion), by Japan, 2018-2029
Figure 83: Asia Pacific Offshore Drilling Engineering Services Market Forecast (USD Billion), by Australia, 2018-2029
Figure 84: Asia Pacific Offshore Drilling Engineering Services Market Forecast (USD Billion), by Southeast Asia, 2018-2029
Figure 85: Asia Pacific Offshore Drilling Engineering Services Market Forecast (USD Billion), by Rest of Asia Pacific, 2018-2029
Figure 86: Middle East & Africa Offshore Drilling Engineering Services Market Value Share (%), By Segment 1, 2022 & 2029
Figure 87: Middle East & Africa Offshore Drilling Engineering Services Market Forecast (USD Billion), by Sub-Segment 1, 2018-2029
Figure 88: Middle East & Africa Offshore Drilling Engineering Services Market Forecast (USD Billion), by Sub-Segment 2, 2018-2029
Figure 89: Middle East & Africa Offshore Drilling Engineering Services Market Value Share (%), By Segment 2, 2022 & 2029
Figure 90: Middle East & Africa Offshore Drilling Engineering Services Market Forecast (USD Billion), by Sub-Segment 1, 2018-2029
Figure 91: Middle East & Africa Offshore Drilling Engineering Services Market Forecast (USD Billion), by Sub-Segment 2, 2018-2029
Figure 92: Middle East & Africa Offshore Drilling Engineering Services Market Forecast (USD Billion), by Sub-Segment 3, 2018-2029
Figure 93: Middle East & Africa Offshore Drilling Engineering Services Market Forecast (USD Billion), by Others, 2018-2029
Figure 94: Middle East & Africa Offshore Drilling Engineering Services Market Value Share (%), By Segment 3, 2022 & 2029
Figure 95: Middle East & Africa Offshore Drilling Engineering Services Market Forecast (USD Billion), by Sub-Segment 1, 2018-2029
Figure 96: Middle East & Africa Offshore Drilling Engineering Services Market Forecast (USD Billion), by Sub-Segment 2, 2018-2029
Figure 97: Middle East & Africa Offshore Drilling Engineering Services Market Forecast (USD Billion), by Sub-Segment 3, 2018-2029
Figure 98: Middle East & Africa Offshore Drilling Engineering Services Market Forecast (USD Billion), by Others, 2018-2029
Figure 99: Middle East & Africa Offshore Drilling Engineering Services Market Forecast (USD Billion), by GCC, 2018-2029
Figure 100: Middle East & Africa Offshore Drilling Engineering Services Market Forecast (USD Billion), by South Africa, 2018-2029
Figure 101: Middle East & Africa Offshore Drilling Engineering Services Market Forecast (USD Billion), by Rest of Middle East & Africa, 2018-2029
List of Tables
Table 1: Global Offshore Drilling Engineering Services Market Revenue (USD Billion) Forecast, by Segment 1, 2018-2029
Table 2: Global Offshore Drilling Engineering Services Market Revenue (USD Billion) Forecast, by Segment 2, 2018-2029
Table 3: Global Offshore Drilling Engineering Services Market Revenue (USD Billion) Forecast, by Segment 3, 2018-2029
Table 4: Global Offshore Drilling Engineering Services Market Revenue (USD Billion) Forecast, by Region, 2018-2029
Table 5: North America Offshore Drilling Engineering Services Market Revenue (USD Billion) Forecast, by Segment 1, 2018-2029
Table 6: North America Offshore Drilling Engineering Services Market Revenue (USD Billion) Forecast, by Segment 2, 2018-2029
Table 7: North America Offshore Drilling Engineering Services Market Revenue (USD Billion) Forecast, by Segment 3, 2018-2029
Table 8: North America Offshore Drilling Engineering Services Market Revenue (USD Billion) Forecast, by Country, 2018-2029
Table 9: Europe Offshore Drilling Engineering Services Market Revenue (USD Billion) Forecast, by Segment 1, 2018-2029
Table 10: Europe Offshore Drilling Engineering Services Market Revenue (USD Billion) Forecast, by Segment 2, 2018-2029
Table 11: Europe Offshore Drilling Engineering Services Market Revenue (USD Billion) Forecast, by Segment 3, 2018-2029
Table 12: Europe Offshore Drilling Engineering Services Market Revenue (USD Billion) Forecast, by Country, 2018-2029
Table 13: Latin America Offshore Drilling Engineering Services Market Revenue (USD Billion) Forecast, by Segment 1, 2018-2029
Table 14: Latin America Offshore Drilling Engineering Services Market Revenue (USD Billion) Forecast, by Segment 2, 2018-2029
Table 15: Latin America Offshore Drilling Engineering Services Market Revenue (USD Billion) Forecast, by Segment 3, 2018-2029
Table 16: Latin America Offshore Drilling Engineering Services Market Revenue (USD Billion) Forecast, by Country, 2018-2029
Table 17: Asia Pacific Offshore Drilling Engineering Services Market Revenue (USD Billion) Forecast, by Segment 1, 2018-2029
Table 18: Asia Pacific Offshore Drilling Engineering Services Market Revenue (USD Billion) Forecast, by Segment 2, 2018-2029
Table 19: Asia Pacific Offshore Drilling Engineering Services Market Revenue (USD Billion) Forecast, by Segment 3, 2018-2029
Table 20: Asia Pacific Offshore Drilling Engineering Services Market Revenue (USD Billion) Forecast, by Country, 2018-2029
Table 21: Middle East & Africa Offshore Drilling Engineering Services Market Revenue (USD Billion) Forecast, by Segment 1, 2018-2029
Table 22: Middle East & Africa Offshore Drilling Engineering Services Market Revenue (USD Billion) Forecast, by Segment 2, 2018-2029
Table 23: Middle East & Africa Offshore Drilling Engineering Services Market Revenue (USD Billion) Forecast, by Segment 3, 2018-2029
Table 24: Middle East & Africa Offshore Drilling Engineering Services Market Revenue (USD Billion) Forecast, by Country, 2018-2029
Research Process
Data Library Research are conducted by industry experts who offer insight on
industry structure, market segmentations technology assessment and competitive landscape (CL), and penetration, as well as on emerging trends. Their analysis is based on primary interviews (~ 80%) and secondary research (~ 20%) as well as years of professional expertise in their respective industries. Adding to this, by analysing historical trends and current market positions, our analysts predict where the market will be headed for the next five years. Furthermore, the varying trends of segment & categories geographically presented are also studied and the estimated based on the primary & secondary research.
In this particular report from the supply side Data Library Research has conducted primary surveys (interviews) with the key level executives (VP, CEO’s, Marketing Director, Business Development Manager
and SOFT) of the companies that active & prominent as well as the midsized organization
FIGURE 1: DLR RESEARH PROCESS
![research-methodology1]()
Primary Research
Extensive primary research was conducted to gain a deeper insight of the market and industry performance. The analysis is based on both primary and secondary research as well as years of professional expertise in the respective industries.
In addition to analysing current and historical trends, our analysts predict where the market is headed over the next five years.
It varies by segment for these categories geographically presented in the list of market tables. Speaking about this particular report we have conducted primary surveys (interviews) with the key level executives (VP, CEO’s, Marketing Director, Business Development Manager and many more) of the major players active in the market.
Secondary Research
Secondary research was mainly used to collect and identify information useful for the extensive, technical, market-oriented, and Friend’s study of the Global Extra Neutral Alcohol. It was also used to obtain key information about major players, market classification and segmentation according to the industry trends, geographical markets, and developments related to the market and technology perspectives. For this study, analysts have gathered information from various credible sources, such as annual reports, sec filings, journals, white papers, SOFT presentations, and company web sites.
Market Size Estimation
Both, top-down and bottom-up approaches were used to estimate and validate the size of the Global market and to estimate the size of various other dependent submarkets in the overall Extra Neutral Alcohol. The key players in the market were identified through secondary research and their market contributions in the respective geographies were determined through primary and secondary research.
Forecast Model
![research-methodology2]()