Pharmaceutical Stability Testing Service Market Overview and Analysis
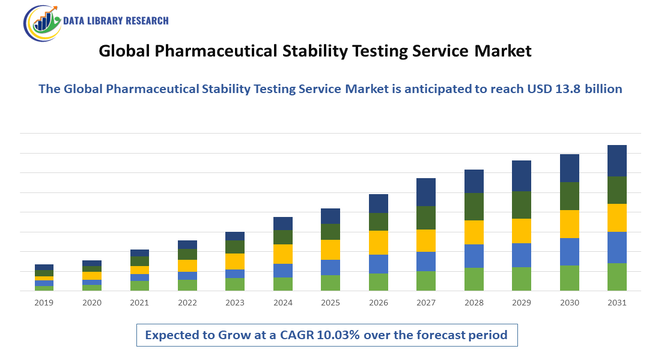
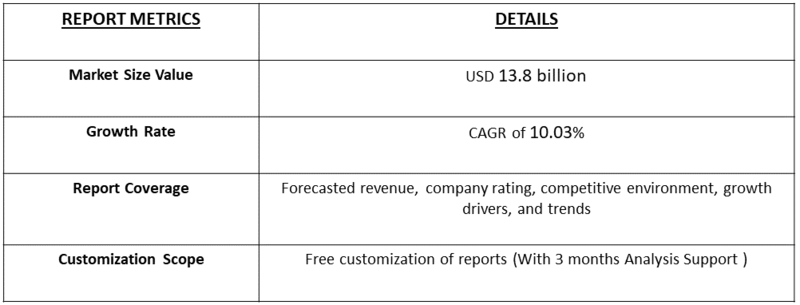
The Global Pharmaceutical Stability Testing Service Market was valued at around USD 7.2 billion in 2025 and is projected to grow to USD 13.8 billion by 2032, at a CAGR of approximately 10.03% from 2025-2032.
Get Complete Analysis Of The Report - Download Updated Free Sample PDF
The Global Pharmaceutical Stability Testing Service Market refers to the industry segment that provides specialized testing services to assess the stability and shelf-life of pharmaceutical products under various environmental conditions such as temperature, humidity, and light. These services ensure that drugs maintain their safety, efficacy, and quality throughout their intended shelf life, complying with regulatory standards worldwide. The market includes contract research organizations (CROs) and laboratories offering stability testing for new drug formulations, generic drugs, biologics, and over-the-counter medicines, driven by increasing pharmaceutical R&D activities, stringent regulatory requirements, and growing demand for high-quality medications.
Pharmaceutical Stability Testing Service Market Latest Trends
The Global Pharmaceutical Stability Testing Service Market is experiencing significant growth, driven by several key trends. The increasing complexity of drug formulations, including biologics and novel delivery systems, has heightened the demand for advanced stability testing methods to ensure product safety and efficacy. Regulatory agencies worldwide, such as the U.S. FDA and EMA, have implemented stringent guidelines, necessitating comprehensive stability testing throughout a drug's lifecycle. This regulatory pressure has led to a surge in outsourcing stability testing services to specialized contract research organizations (CROs), enabling pharmaceutical companies to focus on core competencies while ensuring compliance.
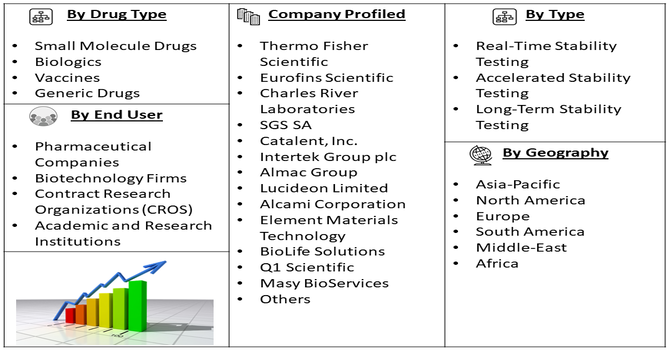
Segmentation: The Global Pharmaceutical Stability Testing Service Market is Segmented by Service Type (Real-Time Stability Testing, Accelerated Stability Testing, and Long-Term Stability Testing), Drug Type (Small Molecule Drugs, Biologics, Vaccines, and Generic Drugs), End-User (Pharmaceutical Companies, Biotechnology Firms, Contract Research Organizations (CROS), and Academic and Research Institutions and Geography (North America, Europe, Asia-Pacific, Latin America, Middle East & Africa). The report provides the value (in USD million) for the segments listed above.
For Detailed Market Segmentation - Get a Free Sample PDF
Market Drivers:
- Increasing Regulatory Compliance Requirements
The pharmaceutical industry faces stringent regulatory requirements from agencies like the FDA, EMA, and ICH, mandating rigorous stability testing throughout a drug’s lifecycle. These regulations ensure that pharmaceutical products maintain safety, efficacy, and quality under various environmental conditions. Compliance requires comprehensive stability data for new drug applications, post-approval changes, and generic drug approvals, driving demand for advanced stability testing services. Pharmaceutical companies often outsource these complex and resource-intensive tests to specialized contract research organizations (CROs) with the expertise and infrastructure to meet regulatory standards efficiently. This regulatory pressure continues to be a significant growth driver, pushing the market toward more sophisticated, reliable, and compliant stability testing solutions globally.
- Growth of Biologics and Complex Drug Formulations
The rise of biologics, including monoclonal antibodies, gene therapies, and vaccines, has created a surge in demand for specialized stability testing services. Biologics are highly sensitive to environmental factors such as temperature and light, requiring advanced testing protocols to ensure product stability and efficacy. Additionally, novel drug delivery systems and combination therapies add complexity to stability assessment. This complexity necessitates sophisticated analytical techniques and controlled storage environments, expanding the market for stability testing providers. As biopharmaceutical R&D accelerates worldwide, the need for robust stability testing solutions tailored to these complex molecules significantly propels market growth, especially in regions with strong biologics development pipelines.
Market Restraints:
- High Costs and Resource Intensity
The extensive infrastructure, advanced technology, and skilled expertise required for comprehensive stability testing make it a costly and resource-intensive process, limiting adoption for smaller pharmaceutical firms. Additionally, the need for highly trained personnel to conduct complex testing protocols and ensure regulatory compliance further increases operational costs. These high costs can be prohibitive, especially for small and mid-sized pharmaceutical companies and startups, limiting their ability to perform in-house stability testing. As a result, many such companies may face delays in drug development or increased reliance on outsourcing, which can add to their overall expenses and impact time-to-market. This financial burden acts as a significant restraint on market growth, particularly in emerging economies and among smaller industry players.
Social Economic Impact on Pharmaceutical Stability Testing Service Market
The Pharmaceutical Stability Testing Service Market has a profound socio-economic impact by serving as a critical gatekeeper for public health and drug accessibility. Societally, it is indispensable for patient safety and efficacy, as rigorous stability testing ensures medicines maintain their quality, potency, and safety throughout their labeled shelf life, preventing harm from degraded or ineffective treatments and upholding consumer trust. Economically, the market facilitates innovation and global commerce by allowing pharmaceutical companies, especially smaller biotechs, to outsource capital-intensive and time-consuming testing, which reduces operational costs, mitigates the risk of costly product recalls, and accelerates the time-to-market for new drugs and life-saving biologics. Furthermore, the market's growth, particularly in Asia-Pacific, drives investment in advanced analytical technologies and creates highly-skilled jobs in a globally regulated, high-value sector, ultimately supporting a more efficient and compliant global supply chain for therapeutics.
Segmental Analysis:
- Accelerated Stability Testing Segment is Expected to Witness High Growth Over the Forecasted Period
The accelerated stability testing segment is anticipated to experience significant growth due to its ability to rapidly predict a pharmaceutical product’s shelf life by exposing it to elevated stress conditions such as high temperature and humidity. This testing method helps reduce the time and cost associated with traditional long-term stability studies, enabling faster product development and market approval. Pharmaceutical companies increasingly rely on accelerated stability testing to meet stringent regulatory requirements and expedite the launch of new drugs. Additionally, the growing complexity of drug formulations, including biologics and combination products, demands more rigorous and efficient stability testing approaches, further propelling the demand for accelerated testing services worldwide.
- Biologics Segment is Expected to Witness High Growth Over the Forecasted Period
The biologics segment is expected to witness robust growth owing to the rising development and commercialization of biologic drugs, including monoclonal antibodies, vaccines, and gene therapies. Biologics are highly sensitive to environmental conditions, making stability testing critical to ensure their efficacy and safety throughout their shelf life. Increasing investments in biopharmaceutical R&D and a surge in approvals of novel biologics are driving the demand for specialized stability testing services. Moreover, regulatory agencies emphasize rigorous stability data for biologics due to their complex nature, encouraging pharmaceutical companies to outsource these services to experts. The trend toward personalized medicine and biosimilars is also expanding the biologics market, which in turn boosts the stability testing segment.
- Pharmaceutical Companies Segment is Expected to Witness High Growth Over the Forecasted Period
Pharmaceutical companies constitute the largest end-user segment in the stability testing service market and are projected to grow steadily. These companies rely heavily on stability testing to ensure that their drug products maintain quality, safety, and efficacy over time, fulfilling regulatory requirements globally. The increasing number of new drug launches, rising generic drug approvals, and a surge in complex formulations necessitate extensive stability testing services. Outsourcing stability testing to specialized laboratories enables pharmaceutical companies to reduce operational costs, enhance efficiency, and focus on core R&D activities. The growing trend of stringent regulatory compliance and expanding global pharmaceutical markets further propel the demand for stability testing services among pharmaceutical manufacturers.
- North America Region is Expected to Witness High Growth Over the Forecasted Period
North America is projected to dominate the pharmaceutical stability testing service market due to its well-established pharmaceutical industry, presence of leading contract research organizations (CROs), and stringent regulatory frameworks like those enforced by the FDA. The region benefits from substantial investment in pharmaceutical R&D, increasing drug approvals, and a strong focus on innovation and quality assurance.
Additionally, the rise of biologics, biosimilars, and complex drug formulations requires advanced stability testing capabilities readily available in North America. For instance, in July 2024, Cambrex announced the growth of its stability storage division, Q1 Scientific, which provides environmentally-controlled stability storage solutions for the pharmaceutical, medical device, and life sciences sectors. This expansion enhances service capacity and supports increasing demand for reliable stability testing and storage in the US market.
Moreover, the increasing outsourcing of stability testing services to specialized CROs to reduce time-to-market and costs further drives market growth. The expanding healthcare infrastructure and growing awareness about drug safety also contribute to the region’s leadership in this market. For instance, in December 2022, Almac Group finalized the initial phase of its GMP API facility expansion, boosting its manufacturing and storage capabilities. This development strengthens the company’s ability to serve the US pharmaceutical industry, meeting rising regulatory requirements and accelerating drug development timelines.
Thus, ihese expansions by key players like Cambrex and Almac are driving the US pharmaceutical stability testing market by improving infrastructure and capacity, enabling faster, more compliant drug development and storage solutions to meet growing industry demands.
To Learn More About This Report - Request a Free Sample Copy
Pharmaceutical Stability Testing Service Market Competitive Landscape
The Global Pharmaceutical Stability Testing Service Market features a moderately fragmented competitive landscape, dominated by a mix of large, multinational contract research organizations (CROs) and contract development and manufacturing organizations (CDMOs), alongside specialized analytical testing laboratories. Key global players like Eurofins Scientific, Charles River Laboratories, Catalent Inc., and Intertek Group PLC leverage extensive global footprints, regulatory expertise, and comprehensive service portfolios, often expanding through strategic acquisitions to broaden their capabilities, especially in complex areas like biologics and biosimilars stability. Competition is primarily driven by the need for stringent regulatory compliance (ICH, FDA, EMA), technical differentiation through advanced analytical methodologies, and the ability to offer integrated stability and storage solutions.
The 20 major major players for this market are:
- Thermo Fisher Scientific
- Eurofins Scientific
- Charles River Laboratories
- SGS SA
- Catalent, Inc.
- Intertek Group plc
- Almac Group
- Lucideon Limited
- Alcami Corporation
- Element Materials Technology
- BioLife Solutions
- Q1 Scientific
- Masy BioServices
- Roylance Stability Storage Limited
- Reading Scientific Services Ltd.
- ALS Ltd.
- Auriga Research Private Limited
- Q Laboratories
- Precision Stability Storage
- Covance Inc.
Recent Developments
- In January 2024, Alcami Corporation launched a new Pharma Storage and Services facility in California as part of its strategy to strengthen its pharma storage and service capabilities. This new location aims to better support biotech and pharmaceutical clients by gradually introducing stability storage, aliquoting services, and cold storage solutions.
- In April 2023, Alcami Corporation completed the Phase III expansion of its cGMP bio storage facility in Amherst, New Hampshire. The enhanced capacity is now fully operational, enabling the company to accommodate a wide range of cGMP client storage needs.
Frequently Asked Questions (FAQ) :
Q1. What are the main growth driving factors for this market?
The primary drivers are stringent global regulatory compliance, particularly ICH guidelines, and the significant surge in pharmaceutical R&D, especially for complex biologics, biosimilars, and advanced therapies. The increasing trend of outsourcing specialized testing services by drug manufacturers also fuels expansion.
Q2. What are the main restraining factors for this market?
Restraints include the high initial investment and maintenance costs associated with acquiring specialized stability testing chambers and advanced monitoring systems. Additionally, the need for scientific expertise, complex drug formulations, and prolonged testing timelines pose operational challenges for service providers.
Q3. Which segment is expected to witness high growth?
The Storage Services segment is anticipated to register the fastest growth rate (CAGR), driven by the increasing demand for specialized cold chain logistics and cryogenic storage solutions for temperature-sensitive large molecules and cell and gene therapies in global supply chains.
Q4. Who are the top major players for this market?
Key market players are major contract research organizations (CROs) and analytical testing specialists. Top companies include Eurofins Scientific, SGS SA, Charles River Laboratories, Intertek Group plc, and Pace Analytical Services, which offer comprehensive stability study portfolios.
Q5. Which country is the largest player?
North America, specifically the United States, is the largest regional player dominating the market revenue share. This is attributed to the presence of a vast biopharmaceutical industry, massive R&D investments, and the rigorous regulatory environment set by the FDA.
List of Figures
Figure 1: Global Pharmaceutical Stability Testing Service Market Revenue Breakdown (USD Billion, %) by Region, 2023 & 2029
Figure 2: Global Pharmaceutical Stability Testing Service Market Value Share (%), By Segment 1, 2023 & 2029
Figure 3: Global Pharmaceutical Stability Testing Service Market Forecast (USD Billion), by Sub-Segment 1, 2018-2029
Figure 4: Global Pharmaceutical Stability Testing Service Market Forecast (USD Billion), by Sub-Segment 2, 2018-2029
Figure 5: Global Pharmaceutical Stability Testing Service Market Value Share (%), By Segment 2, 2023 & 2029
Figure 6: Global Pharmaceutical Stability Testing Service Market Forecast (USD Billion), by Sub-Segment 1, 2018-2029
Figure 7: Global Pharmaceutical Stability Testing Service Market Forecast (USD Billion), by Sub-Segment 2, 2018-2029
Figure 8: Global Pharmaceutical Stability Testing Service Market Forecast (USD Billion), by Sub-Segment 3, 2018-2029
Figure 9: Global Pharmaceutical Stability Testing Service Market Forecast (USD Billion), by Others, 2018-2029
Figure 10: Global Pharmaceutical Stability Testing Service Market Value Share (%), By Segment 3, 2023 & 2029
Figure 11: Global Pharmaceutical Stability Testing Service Market Forecast (USD Billion), by Sub-Segment 1, 2018-2029
Figure 12: Global Pharmaceutical Stability Testing Service Market Forecast (USD Billion), by Sub-Segment 2, 2018-2029
Figure 13: Global Pharmaceutical Stability Testing Service Market Forecast (USD Billion), by Sub-Segment 3, 2018-2029
Figure 14: Global Pharmaceutical Stability Testing Service Market Forecast (USD Billion), by Others, 2018-2029
Figure 15: Global Pharmaceutical Stability Testing Service Market Value (USD Billion), by Region, 2023 & 2029
Figure 16: North America Pharmaceutical Stability Testing Service Market Value Share (%), By Segment 1, 2023 & 2029
Figure 17: North America Pharmaceutical Stability Testing Service Market Forecast (USD Billion), by Sub-Segment 1, 2018-2029
Figure 18: North America Pharmaceutical Stability Testing Service Market Forecast (USD Billion), by Sub-Segment 2, 2018-2029
Figure 19: North America Pharmaceutical Stability Testing Service Market Value Share (%), By Segment 2, 2023 & 2029
Figure 20: North America Pharmaceutical Stability Testing Service Market Forecast (USD Billion), by Sub-Segment 1, 2018-2029
Figure 21: North America Pharmaceutical Stability Testing Service Market Forecast (USD Billion), by Sub-Segment 2, 2018-2029
Figure 22: North America Pharmaceutical Stability Testing Service Market Forecast (USD Billion), by Sub-Segment 3, 2018-2029
Figure 23: North America Pharmaceutical Stability Testing Service Market Forecast (USD Billion), by Others, 2018-2029
Figure 24: North America Pharmaceutical Stability Testing Service Market Value Share (%), By Segment 3, 2023 & 2029
Figure 25: North America Pharmaceutical Stability Testing Service Market Forecast (USD Billion), by Sub-Segment 1, 2018-2029
Figure 26: North America Pharmaceutical Stability Testing Service Market Forecast (USD Billion), by Sub-Segment 2, 2018-2029
Figure 27: North America Pharmaceutical Stability Testing Service Market Forecast (USD Billion), by Sub-Segment 3, 2018-2029
Figure 28: North America Pharmaceutical Stability Testing Service Market Forecast (USD Billion), by Others, 2018-2029
Figure 29: North America Pharmaceutical Stability Testing Service Market Forecast (USD Billion), by U.S., 2018-2029
Figure 30: North America Pharmaceutical Stability Testing Service Market Forecast (USD Billion), by Canada, 2018-2029
Figure 31: Latin America Pharmaceutical Stability Testing Service Market Value Share (%), By Segment 1, 2023 & 2029
Figure 32: Latin America Pharmaceutical Stability Testing Service Market Forecast (USD Billion), by Sub-Segment 1, 2018-2029
Figure 33: Latin America Pharmaceutical Stability Testing Service Market Forecast (USD Billion), by Sub-Segment 2, 2018-2029
Figure 34: Latin America Pharmaceutical Stability Testing Service Market Value Share (%), By Segment 2, 2023 & 2029
Figure 35: Latin America Pharmaceutical Stability Testing Service Market Forecast (USD Billion), by Sub-Segment 1, 2018-2029
Figure 36: Latin America Pharmaceutical Stability Testing Service Market Forecast (USD Billion), by Sub-Segment 2, 2018-2029
Figure 37: Latin America Pharmaceutical Stability Testing Service Market Forecast (USD Billion), by Sub-Segment 3, 2018-2029
Figure 38: Latin America Pharmaceutical Stability Testing Service Market Forecast (USD Billion), by Others, 2018-2029
Figure 39: Latin America Pharmaceutical Stability Testing Service Market Value Share (%), By Segment 3, 2023 & 2029
Figure 40: Latin America Pharmaceutical Stability Testing Service Market Forecast (USD Billion), by Sub-Segment 1, 2018-2029
Figure 41: Latin America Pharmaceutical Stability Testing Service Market Forecast (USD Billion), by Sub-Segment 2, 2018-2029
Figure 42: Latin America Pharmaceutical Stability Testing Service Market Forecast (USD Billion), by Sub-Segment 3, 2018-2029
Figure 43: Latin America Pharmaceutical Stability Testing Service Market Forecast (USD Billion), by Others, 2018-2029
Figure 44: Latin America Pharmaceutical Stability Testing Service Market Forecast (USD Billion), by Brazil, 2018-2029
Figure 45: Latin America Pharmaceutical Stability Testing Service Market Forecast (USD Billion), by Mexico, 2018-2029
Figure 46: Latin America Pharmaceutical Stability Testing Service Market Forecast (USD Billion), by Rest of Latin America, 2018-2029
Figure 47: Europe Pharmaceutical Stability Testing Service Market Value Share (%), By Segment 1, 2023 & 2029
Figure 48: Europe Pharmaceutical Stability Testing Service Market Forecast (USD Billion), by Sub-Segment 1, 2018-2029
Figure 49: Europe Pharmaceutical Stability Testing Service Market Forecast (USD Billion), by Sub-Segment 2, 2018-2029
Figure 50: Europe Pharmaceutical Stability Testing Service Market Value Share (%), By Segment 2, 2023 & 2029
Figure 51: Europe Pharmaceutical Stability Testing Service Market Forecast (USD Billion), by Sub-Segment 1, 2018-2029
Figure 52: Europe Pharmaceutical Stability Testing Service Market Forecast (USD Billion), by Sub-Segment 2, 2018-2029
Figure 53: Europe Pharmaceutical Stability Testing Service Market Forecast (USD Billion), by Sub-Segment 3, 2018-2029
Figure 54: Europe Pharmaceutical Stability Testing Service Market Forecast (USD Billion), by Others, 2018-2029
Figure 55: Europe Pharmaceutical Stability Testing Service Market Value Share (%), By Segment 3, 2023 & 2029
Figure 56: Europe Pharmaceutical Stability Testing Service Market Forecast (USD Billion), by Sub-Segment 1, 2018-2029
Figure 57: Europe Pharmaceutical Stability Testing Service Market Forecast (USD Billion), by Sub-Segment 2, 2018-2029
Figure 58: Europe Pharmaceutical Stability Testing Service Market Forecast (USD Billion), by Sub-Segment 3, 2018-2029
Figure 59: Europe Pharmaceutical Stability Testing Service Market Forecast (USD Billion), by Others, 2018-2029
Figure 60: Europe Pharmaceutical Stability Testing Service Market Forecast (USD Billion), by U.K., 2018-2029
Figure 61: Europe Pharmaceutical Stability Testing Service Market Forecast (USD Billion), by Germany, 2018-2029
Figure 62: Europe Pharmaceutical Stability Testing Service Market Forecast (USD Billion), by France, 2018-2029
Figure 63: Europe Pharmaceutical Stability Testing Service Market Forecast (USD Billion), by Italy, 2018-2029
Figure 64: Europe Pharmaceutical Stability Testing Service Market Forecast (USD Billion), by Spain, 2018-2029
Figure 65: Europe Pharmaceutical Stability Testing Service Market Forecast (USD Billion), by Russia, 2018-2029
Figure 66: Europe Pharmaceutical Stability Testing Service Market Forecast (USD Billion), by Rest of Europe, 2018-2029
Figure 67: Asia Pacific Pharmaceutical Stability Testing Service Market Value Share (%), By Segment 1, 2023 & 2029
Figure 68: Asia Pacific Pharmaceutical Stability Testing Service Market Forecast (USD Billion), by Sub-Segment 1, 2018-2029
Figure 69: Asia Pacific Pharmaceutical Stability Testing Service Market Forecast (USD Billion), by Sub-Segment 2, 2018-2029
Figure 70: Asia Pacific Pharmaceutical Stability Testing Service Market Value Share (%), By Segment 2, 2023 & 2029
Figure 71: Asia Pacific Pharmaceutical Stability Testing Service Market Forecast (USD Billion), by Sub-Segment 1, 2018-2029
Figure 72: Asia Pacific Pharmaceutical Stability Testing Service Market Forecast (USD Billion), by Sub-Segment 2, 2018-2029
Figure 73: Asia Pacific Pharmaceutical Stability Testing Service Market Forecast (USD Billion), by Sub-Segment 3, 2018-2029
Figure 74: Asia Pacific Pharmaceutical Stability Testing Service Market Forecast (USD Billion), by Others, 2018-2029
Figure 75: Asia Pacific Pharmaceutical Stability Testing Service Market Value Share (%), By Segment 3, 2023 & 2029
Figure 76: Asia Pacific Pharmaceutical Stability Testing Service Market Forecast (USD Billion), by Sub-Segment 1, 2018-2029
Figure 77: Asia Pacific Pharmaceutical Stability Testing Service Market Forecast (USD Billion), by Sub-Segment 2, 2018-2029
Figure 78: Asia Pacific Pharmaceutical Stability Testing Service Market Forecast (USD Billion), by Sub-Segment 3, 2018-2029
Figure 79: Asia Pacific Pharmaceutical Stability Testing Service Market Forecast (USD Billion), by Others, 2018-2029
Figure 80: Asia Pacific Pharmaceutical Stability Testing Service Market Forecast (USD Billion), by China, 2018-2029
Figure 81: Asia Pacific Pharmaceutical Stability Testing Service Market Forecast (USD Billion), by India, 2018-2029
Figure 82: Asia Pacific Pharmaceutical Stability Testing Service Market Forecast (USD Billion), by Japan, 2018-2029
Figure 83: Asia Pacific Pharmaceutical Stability Testing Service Market Forecast (USD Billion), by Australia, 2018-2029
Figure 84: Asia Pacific Pharmaceutical Stability Testing Service Market Forecast (USD Billion), by Southeast Asia, 2018-2029
Figure 85: Asia Pacific Pharmaceutical Stability Testing Service Market Forecast (USD Billion), by Rest of Asia Pacific, 2018-2029
Figure 86: Middle East & Africa Pharmaceutical Stability Testing Service Market Value Share (%), By Segment 1, 2023 & 2029
Figure 87: Middle East & Africa Pharmaceutical Stability Testing Service Market Forecast (USD Billion), by Sub-Segment 1, 2018-2029
Figure 88: Middle East & Africa Pharmaceutical Stability Testing Service Market Forecast (USD Billion), by Sub-Segment 2, 2018-2029
Figure 89: Middle East & Africa Pharmaceutical Stability Testing Service Market Value Share (%), By Segment 2, 2023 & 2029
Figure 90: Middle East & Africa Pharmaceutical Stability Testing Service Market Forecast (USD Billion), by Sub-Segment 1, 2018-2029
Figure 91: Middle East & Africa Pharmaceutical Stability Testing Service Market Forecast (USD Billion), by Sub-Segment 2, 2018-2029
Figure 92: Middle East & Africa Pharmaceutical Stability Testing Service Market Forecast (USD Billion), by Sub-Segment 3, 2018-2029
Figure 93: Middle East & Africa Pharmaceutical Stability Testing Service Market Forecast (USD Billion), by Others, 2018-2029
Figure 94: Middle East & Africa Pharmaceutical Stability Testing Service Market Value Share (%), By Segment 3, 2023 & 2029
Figure 95: Middle East & Africa Pharmaceutical Stability Testing Service Market Forecast (USD Billion), by Sub-Segment 1, 2018-2029
Figure 96: Middle East & Africa Pharmaceutical Stability Testing Service Market Forecast (USD Billion), by Sub-Segment 2, 2018-2029
Figure 97: Middle East & Africa Pharmaceutical Stability Testing Service Market Forecast (USD Billion), by Sub-Segment 3, 2018-2029
Figure 98: Middle East & Africa Pharmaceutical Stability Testing Service Market Forecast (USD Billion), by Others, 2018-2029
Figure 99: Middle East & Africa Pharmaceutical Stability Testing Service Market Forecast (USD Billion), by GCC, 2018-2029
Figure 100: Middle East & Africa Pharmaceutical Stability Testing Service Market Forecast (USD Billion), by South Africa, 2018-2029
Figure 101: Middle East & Africa Pharmaceutical Stability Testing Service Market Forecast (USD Billion), by Rest of Middle East & Africa, 2018-2029
List of Tables
Table 1: Global Pharmaceutical Stability Testing Service Market Revenue (USD Billion) Forecast, by Segment 1, 2018-2029
Table 2: Global Pharmaceutical Stability Testing Service Market Revenue (USD Billion) Forecast, by Segment 2, 2018-2029
Table 3: Global Pharmaceutical Stability Testing Service Market Revenue (USD Billion) Forecast, by Segment 3, 2018-2029
Table 4: Global Pharmaceutical Stability Testing Service Market Revenue (USD Billion) Forecast, by Region, 2018-2029
Table 5: North America Pharmaceutical Stability Testing Service Market Revenue (USD Billion) Forecast, by Segment 1, 2018-2029
Table 6: North America Pharmaceutical Stability Testing Service Market Revenue (USD Billion) Forecast, by Segment 2, 2018-2029
Table 7: North America Pharmaceutical Stability Testing Service Market Revenue (USD Billion) Forecast, by Segment 3, 2018-2029
Table 8: North America Pharmaceutical Stability Testing Service Market Revenue (USD Billion) Forecast, by Country, 2018-2029
Table 9: Europe Pharmaceutical Stability Testing Service Market Revenue (USD Billion) Forecast, by Segment 1, 2018-2029
Table 10: Europe Pharmaceutical Stability Testing Service Market Revenue (USD Billion) Forecast, by Segment 2, 2018-2029
Table 11: Europe Pharmaceutical Stability Testing Service Market Revenue (USD Billion) Forecast, by Segment 3, 2018-2029
Table 12: Europe Pharmaceutical Stability Testing Service Market Revenue (USD Billion) Forecast, by Country, 2018-2029
Table 13: Latin America Pharmaceutical Stability Testing Service Market Revenue (USD Billion) Forecast, by Segment 1, 2018-2029
Table 14: Latin America Pharmaceutical Stability Testing Service Market Revenue (USD Billion) Forecast, by Segment 2, 2018-2029
Table 15: Latin America Pharmaceutical Stability Testing Service Market Revenue (USD Billion) Forecast, by Segment 3, 2018-2029
Table 16: Latin America Pharmaceutical Stability Testing Service Market Revenue (USD Billion) Forecast, by Country, 2018-2029
Table 17: Asia Pacific Pharmaceutical Stability Testing Service Market Revenue (USD Billion) Forecast, by Segment 1, 2018-2029
Table 18: Asia Pacific Pharmaceutical Stability Testing Service Market Revenue (USD Billion) Forecast, by Segment 2, 2018-2029
Table 19: Asia Pacific Pharmaceutical Stability Testing Service Market Revenue (USD Billion) Forecast, by Segment 3, 2018-2029
Table 20: Asia Pacific Pharmaceutical Stability Testing Service Market Revenue (USD Billion) Forecast, by Country, 2018-2029
Table 21: Middle East & Africa Pharmaceutical Stability Testing Service Market Revenue (USD Billion) Forecast, by Segment 1, 2018-2029
Table 22: Middle East & Africa Pharmaceutical Stability Testing Service Market Revenue (USD Billion) Forecast, by Segment 2, 2018-2029
Table 23: Middle East & Africa Pharmaceutical Stability Testing Service Market Revenue (USD Billion) Forecast, by Segment 3, 2018-2029
Table 24: Middle East & Africa Pharmaceutical Stability Testing Service Market Revenue (USD Billion) Forecast, by Country, 2018-2029
Research Process
Data Library Research are conducted by industry experts who offer insight on
industry structure, market segmentations technology assessment and competitive landscape (CL), and penetration, as well as on emerging trends. Their analysis is based on primary interviews (~ 80%) and secondary research (~ 20%) as well as years of professional expertise in their respective industries. Adding to this, by analysing historical trends and current market positions, our analysts predict where the market will be headed for the next five years. Furthermore, the varying trends of segment & categories geographically presented are also studied and the estimated based on the primary & secondary research.
In this particular report from the supply side Data Library Research has conducted primary surveys (interviews) with the key level executives (VP, CEO’s, Marketing Director, Business Development Manager
and SOFT) of the companies that active & prominent as well as the midsized organization
FIGURE 1: DLR RESEARH PROCESS
![research-methodology1]()
Primary Research
Extensive primary research was conducted to gain a deeper insight of the market and industry performance. The analysis is based on both primary and secondary research as well as years of professional expertise in the respective industries.
In addition to analysing current and historical trends, our analysts predict where the market is headed over the next five years.
It varies by segment for these categories geographically presented in the list of market tables. Speaking about this particular report we have conducted primary surveys (interviews) with the key level executives (VP, CEO’s, Marketing Director, Business Development Manager and many more) of the major players active in the market.
Secondary Research
Secondary research was mainly used to collect and identify information useful for the extensive, technical, market-oriented, and Friend’s study of the Global Extra Neutral Alcohol. It was also used to obtain key information about major players, market classification and segmentation according to the industry trends, geographical markets, and developments related to the market and technology perspectives. For this study, analysts have gathered information from various credible sources, such as annual reports, sec filings, journals, white papers, SOFT presentations, and company web sites.
Market Size Estimation
Both, top-down and bottom-up approaches were used to estimate and validate the size of the Global market and to estimate the size of various other dependent submarkets in the overall Extra Neutral Alcohol. The key players in the market were identified through secondary research and their market contributions in the respective geographies were determined through primary and secondary research.
Forecast Model
![research-methodology2]()