Polyfluoroalkyl Substances (PFAS) Waste Management Market Overview and Analysis
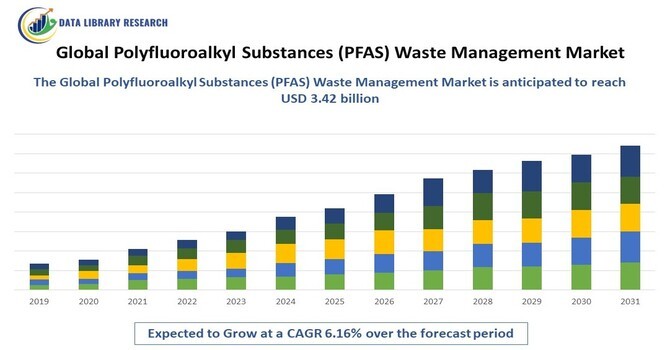
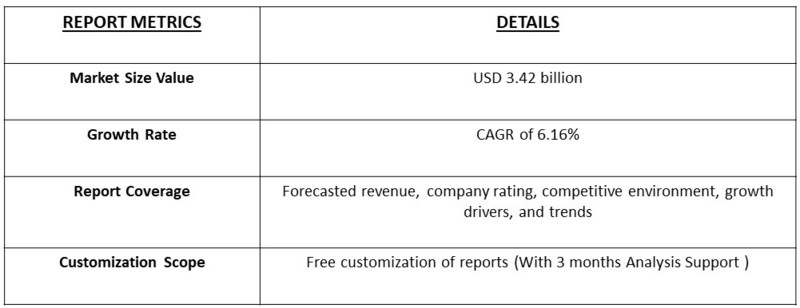
The global Polyfluoroalkyl substances (PFAS) waste management market was valued at USD 2.10 billion in 2023 and is expected to reach USD 3.42 billion by 2030, at a CAGR of 6.16%.
Get Complete Analysis Of The Report - Download Free Sample PDF
Polyfluoroalkyl substances (PFAS) are a group of man-made chemicals that have been widely used in various industries due to their unique properties, such as resistance to heat, water, and oil. Common applications include non-stick cookware, water-repellent clothing, firefighting foams, and food packaging. However, PFAS are persistent in the environment and have been linked to adverse health effects, leading to increased regulatory scrutiny and the need for effective waste management solutions.
Polyfluoroalkyl Substances (PFAS) Waste Management Market Report Scope
The Executive Summary provides a snapshot of key findings of the report. The introduction chapter includes research scope, market segmentation, research methodology, and definitions and assumptions. It involves extreme rigorous scientific methods, tools and techniques to estimate the market size. Exhaustive secondary research is being carried out to collect information related to the market, the parent market, and the peer market. Primary research is undertaken to validate the assumptions, findings, and sizing with the industry experts professionals across the value chain of the market. Both top-down and bottom-up approaches are employed to estimate the complete market size.
The chapter on market dynamics includes market drivers, restraints, and opportunities which helps familiarise with market potential and upcoming opportunities. The chapter on key insights includes emerging trends from major countries, latest technological advancement, regulatory landscape, SWOT analysis, and porters five forces analysis. This chapter provides detailed insights of the market which derives the market trends, changing phase of investments, scope of profit potential, and helps to take appropriate business decisions. The chapter on competitive analysis includes profiling of leading companies in the global market to map the leading companies and their focus of interest in the market.
After deriving the market size from the market size estimation process, the total market has been split into several segments and sub-segments. Data triangulation and market breakdown procedures are used to complete the overall market engineering process and arrive at the exact statistics for all segments and sub-segments. The data triangulation is carried out by studying various factors and trends from demand and supply perspectives.
Segmentation Analysis:
The global Polyfluoroalkyl Substances (PFAS) Waste Management market is segmented based on type, Application, and Region.
For Detailed Market Segmentation - Download Free Sample PDF
*All our reports are customizable as per customer requirements
This study forecasts revenue and volume growth at global, regional, and country levels from 2018 to 2029. The Global Polyfluoroalkyl Substances (PFAS) Waste Management market is distributed on the basis of the below-mentioned segments:
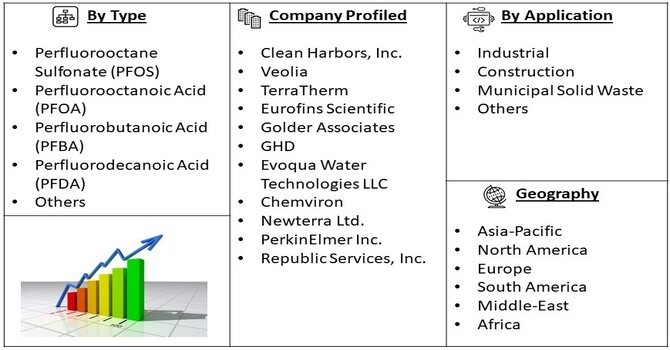
Global Polyfluoroalkyl Substances (PFAS) Waste Management Market, By Type:
- Perfluorooctane Sulfonate (PFOS)
- Perfluorooctanoic Acid (PFOA)
- Perfluorobutanoic Acid (PFBA)
- Perfluorodecanoic Acid (PFDA)
- Others
Global Polyfluoroalkyl Substances (PFAS) Waste Management Market, By Application:
- Industrial
- Construction
- Municipal Solid Waste
- Others
Global Polyfluoroalkyl Substances (PFAS) Waste Management Market, By Region:
- North America
- Europe
- UK
- Germany
- France
- Italy
- Spain
- Rest of Europe
- Asia-Pacific
- Japan
- China
- India
- Australia
- South Korea
- Rest of Asia-Pacific
- LAMEA
- Brazil
- Saudi Arabia
- UAE
- Rest of LAMEA
Get Complete Analysis Of The Report - Download Free Sample PDF
Global Polyfluoroalkyl Substances (PFAS) Waste Management Market Competitive Analysis
Key players in the Global Polyfluoroalkyl Substances (PFAS) Waste Management market are
-
Clean Harbors, Inc.
- Veolia
- TerraTherm
- Eurofins Scientific
- Golder Associates
- GHD
- Evoqua Water Technologies LLC
- Chemviron
- Newterra Ltd.
- PerkinElmer Inc.
- Republic Services, Inc.
List of Figures
Figure 1: Global Polyfluoroalkyl Substances (PFAS) Waste Management Market Revenue Breakdown (USD Billion, %) by Region, 2022 & 2029
Figure 2: Global Polyfluoroalkyl Substances (PFAS) Waste Management Market Value Share (%), By Segment 1, 2022 & 2029
Figure 3: Global Polyfluoroalkyl Substances (PFAS) Waste Management Market Forecast (USD Billion), by Sub-Segment 1, 2018-2029
Figure 4: Global Polyfluoroalkyl Substances (PFAS) Waste Management Market Forecast (USD Billion), by Sub-Segment 2, 2018-2029
Figure 5: Global Polyfluoroalkyl Substances (PFAS) Waste Management Market Value Share (%), By Segment 2, 2022 & 2029
Figure 6: Global Polyfluoroalkyl Substances (PFAS) Waste Management Market Forecast (USD Billion), by Sub-Segment 1, 2018-2029
Figure 7: Global Polyfluoroalkyl Substances (PFAS) Waste Management Market Forecast (USD Billion), by Sub-Segment 2, 2018-2029
Figure 8: Global Polyfluoroalkyl Substances (PFAS) Waste Management Market Forecast (USD Billion), by Sub-Segment 3, 2018-2029
Figure 9: Global Polyfluoroalkyl Substances (PFAS) Waste Management Market Forecast (USD Billion), by Others, 2018-2029
Figure 10: Global Polyfluoroalkyl Substances (PFAS) Waste Management Market Value Share (%), By Segment 3, 2022 & 2029
Figure 11: Global Polyfluoroalkyl Substances (PFAS) Waste Management Market Forecast (USD Billion), by Sub-Segment 1, 2018-2029
Figure 12: Global Polyfluoroalkyl Substances (PFAS) Waste Management Market Forecast (USD Billion), by Sub-Segment 2, 2018-2029
Figure 13: Global Polyfluoroalkyl Substances (PFAS) Waste Management Market Forecast (USD Billion), by Sub-Segment 3, 2018-2029
Figure 14: Global Polyfluoroalkyl Substances (PFAS) Waste Management Market Forecast (USD Billion), by Others, 2018-2029
Figure 15: Global Polyfluoroalkyl Substances (PFAS) Waste Management Market Value (USD Billion), by Region, 2022 & 2029
Figure 16: North America Polyfluoroalkyl Substances (PFAS) Waste Management Market Value Share (%), By Segment 1, 2022 & 2029
Figure 17: North America Polyfluoroalkyl Substances (PFAS) Waste Management Market Forecast (USD Billion), by Sub-Segment 1, 2018-2029
Figure 18: North America Polyfluoroalkyl Substances (PFAS) Waste Management Market Forecast (USD Billion), by Sub-Segment 2, 2018-2029
Figure 19: North America Polyfluoroalkyl Substances (PFAS) Waste Management Market Value Share (%), By Segment 2, 2022 & 2029
Figure 20: North America Polyfluoroalkyl Substances (PFAS) Waste Management Market Forecast (USD Billion), by Sub-Segment 1, 2018-2029
Figure 21: North America Polyfluoroalkyl Substances (PFAS) Waste Management Market Forecast (USD Billion), by Sub-Segment 2, 2018-2029
Figure 22: North America Polyfluoroalkyl Substances (PFAS) Waste Management Market Forecast (USD Billion), by Sub-Segment 3, 2018-2029
Figure 23: North America Polyfluoroalkyl Substances (PFAS) Waste Management Market Forecast (USD Billion), by Others, 2018-2029
Figure 24: North America Polyfluoroalkyl Substances (PFAS) Waste Management Market Value Share (%), By Segment 3, 2022 & 2029
Figure 25: North America Polyfluoroalkyl Substances (PFAS) Waste Management Market Forecast (USD Billion), by Sub-Segment 1, 2018-2029
Figure 26: North America Polyfluoroalkyl Substances (PFAS) Waste Management Market Forecast (USD Billion), by Sub-Segment 2, 2018-2029
Figure 27: North America Polyfluoroalkyl Substances (PFAS) Waste Management Market Forecast (USD Billion), by Sub-Segment 3, 2018-2029
Figure 28: North America Polyfluoroalkyl Substances (PFAS) Waste Management Market Forecast (USD Billion), by Others, 2018-2029
Figure 29: North America Polyfluoroalkyl Substances (PFAS) Waste Management Market Forecast (USD Billion), by U.S., 2018-2029
Figure 30: North America Polyfluoroalkyl Substances (PFAS) Waste Management Market Forecast (USD Billion), by Canada, 2018-2029
Figure 31: Latin America Polyfluoroalkyl Substances (PFAS) Waste Management Market Value Share (%), By Segment 1, 2022 & 2029
Figure 32: Latin America Polyfluoroalkyl Substances (PFAS) Waste Management Market Forecast (USD Billion), by Sub-Segment 1, 2018-2029
Figure 33: Latin America Polyfluoroalkyl Substances (PFAS) Waste Management Market Forecast (USD Billion), by Sub-Segment 2, 2018-2029
Figure 34: Latin America Polyfluoroalkyl Substances (PFAS) Waste Management Market Value Share (%), By Segment 2, 2022 & 2029
Figure 35: Latin America Polyfluoroalkyl Substances (PFAS) Waste Management Market Forecast (USD Billion), by Sub-Segment 1, 2018-2029
Figure 36: Latin America Polyfluoroalkyl Substances (PFAS) Waste Management Market Forecast (USD Billion), by Sub-Segment 2, 2018-2029
Figure 37: Latin America Polyfluoroalkyl Substances (PFAS) Waste Management Market Forecast (USD Billion), by Sub-Segment 3, 2018-2029
Figure 38: Latin America Polyfluoroalkyl Substances (PFAS) Waste Management Market Forecast (USD Billion), by Others, 2018-2029
Figure 39: Latin America Polyfluoroalkyl Substances (PFAS) Waste Management Market Value Share (%), By Segment 3, 2022 & 2029
Figure 40: Latin America Polyfluoroalkyl Substances (PFAS) Waste Management Market Forecast (USD Billion), by Sub-Segment 1, 2018-2029
Figure 41: Latin America Polyfluoroalkyl Substances (PFAS) Waste Management Market Forecast (USD Billion), by Sub-Segment 2, 2018-2029
Figure 42: Latin America Polyfluoroalkyl Substances (PFAS) Waste Management Market Forecast (USD Billion), by Sub-Segment 3, 2018-2029
Figure 43: Latin America Polyfluoroalkyl Substances (PFAS) Waste Management Market Forecast (USD Billion), by Others, 2018-2029
Figure 44: Latin America Polyfluoroalkyl Substances (PFAS) Waste Management Market Forecast (USD Billion), by Brazil, 2018-2029
Figure 45: Latin America Polyfluoroalkyl Substances (PFAS) Waste Management Market Forecast (USD Billion), by Mexico, 2018-2029
Figure 46: Latin America Polyfluoroalkyl Substances (PFAS) Waste Management Market Forecast (USD Billion), by Rest of Latin America, 2018-2029
Figure 47: Europe Polyfluoroalkyl Substances (PFAS) Waste Management Market Value Share (%), By Segment 1, 2022 & 2029
Figure 48: Europe Polyfluoroalkyl Substances (PFAS) Waste Management Market Forecast (USD Billion), by Sub-Segment 1, 2018-2029
Figure 49: Europe Polyfluoroalkyl Substances (PFAS) Waste Management Market Forecast (USD Billion), by Sub-Segment 2, 2018-2029
Figure 50: Europe Polyfluoroalkyl Substances (PFAS) Waste Management Market Value Share (%), By Segment 2, 2022 & 2029
Figure 51: Europe Polyfluoroalkyl Substances (PFAS) Waste Management Market Forecast (USD Billion), by Sub-Segment 1, 2018-2029
Figure 52: Europe Polyfluoroalkyl Substances (PFAS) Waste Management Market Forecast (USD Billion), by Sub-Segment 2, 2018-2029
Figure 53: Europe Polyfluoroalkyl Substances (PFAS) Waste Management Market Forecast (USD Billion), by Sub-Segment 3, 2018-2029
Figure 54: Europe Polyfluoroalkyl Substances (PFAS) Waste Management Market Forecast (USD Billion), by Others, 2018-2029
Figure 55: Europe Polyfluoroalkyl Substances (PFAS) Waste Management Market Value Share (%), By Segment 3, 2022 & 2029
Figure 56: Europe Polyfluoroalkyl Substances (PFAS) Waste Management Market Forecast (USD Billion), by Sub-Segment 1, 2018-2029
Figure 57: Europe Polyfluoroalkyl Substances (PFAS) Waste Management Market Forecast (USD Billion), by Sub-Segment 2, 2018-2029
Figure 58: Europe Polyfluoroalkyl Substances (PFAS) Waste Management Market Forecast (USD Billion), by Sub-Segment 3, 2018-2029
Figure 59: Europe Polyfluoroalkyl Substances (PFAS) Waste Management Market Forecast (USD Billion), by Others, 2018-2029
Figure 60: Europe Polyfluoroalkyl Substances (PFAS) Waste Management Market Forecast (USD Billion), by U.K., 2018-2029
Figure 61: Europe Polyfluoroalkyl Substances (PFAS) Waste Management Market Forecast (USD Billion), by Germany, 2018-2029
Figure 62: Europe Polyfluoroalkyl Substances (PFAS) Waste Management Market Forecast (USD Billion), by France, 2018-2029
Figure 63: Europe Polyfluoroalkyl Substances (PFAS) Waste Management Market Forecast (USD Billion), by Italy, 2018-2029
Figure 64: Europe Polyfluoroalkyl Substances (PFAS) Waste Management Market Forecast (USD Billion), by Spain, 2018-2029
Figure 65: Europe Polyfluoroalkyl Substances (PFAS) Waste Management Market Forecast (USD Billion), by Russia, 2018-2029
Figure 66: Europe Polyfluoroalkyl Substances (PFAS) Waste Management Market Forecast (USD Billion), by Rest of Europe, 2018-2029
Figure 67: Asia Pacific Polyfluoroalkyl Substances (PFAS) Waste Management Market Value Share (%), By Segment 1, 2022 & 2029
Figure 68: Asia Pacific Polyfluoroalkyl Substances (PFAS) Waste Management Market Forecast (USD Billion), by Sub-Segment 1, 2018-2029
Figure 69: Asia Pacific Polyfluoroalkyl Substances (PFAS) Waste Management Market Forecast (USD Billion), by Sub-Segment 2, 2018-2029
Figure 70: Asia Pacific Polyfluoroalkyl Substances (PFAS) Waste Management Market Value Share (%), By Segment 2, 2022 & 2029
Figure 71: Asia Pacific Polyfluoroalkyl Substances (PFAS) Waste Management Market Forecast (USD Billion), by Sub-Segment 1, 2018-2029
Figure 72: Asia Pacific Polyfluoroalkyl Substances (PFAS) Waste Management Market Forecast (USD Billion), by Sub-Segment 2, 2018-2029
Figure 73: Asia Pacific Polyfluoroalkyl Substances (PFAS) Waste Management Market Forecast (USD Billion), by Sub-Segment 3, 2018-2029
Figure 74: Asia Pacific Polyfluoroalkyl Substances (PFAS) Waste Management Market Forecast (USD Billion), by Others, 2018-2029
Figure 75: Asia Pacific Polyfluoroalkyl Substances (PFAS) Waste Management Market Value Share (%), By Segment 3, 2022 & 2029
Figure 76: Asia Pacific Polyfluoroalkyl Substances (PFAS) Waste Management Market Forecast (USD Billion), by Sub-Segment 1, 2018-2029
Figure 77: Asia Pacific Polyfluoroalkyl Substances (PFAS) Waste Management Market Forecast (USD Billion), by Sub-Segment 2, 2018-2029
Figure 78: Asia Pacific Polyfluoroalkyl Substances (PFAS) Waste Management Market Forecast (USD Billion), by Sub-Segment 3, 2018-2029
Figure 79: Asia Pacific Polyfluoroalkyl Substances (PFAS) Waste Management Market Forecast (USD Billion), by Others, 2018-2029
Figure 80: Asia Pacific Polyfluoroalkyl Substances (PFAS) Waste Management Market Forecast (USD Billion), by China, 2018-2029
Figure 81: Asia Pacific Polyfluoroalkyl Substances (PFAS) Waste Management Market Forecast (USD Billion), by India, 2018-2029
Figure 82: Asia Pacific Polyfluoroalkyl Substances (PFAS) Waste Management Market Forecast (USD Billion), by Japan, 2018-2029
Figure 83: Asia Pacific Polyfluoroalkyl Substances (PFAS) Waste Management Market Forecast (USD Billion), by Australia, 2018-2029
Figure 84: Asia Pacific Polyfluoroalkyl Substances (PFAS) Waste Management Market Forecast (USD Billion), by Southeast Asia, 2018-2029
Figure 85: Asia Pacific Polyfluoroalkyl Substances (PFAS) Waste Management Market Forecast (USD Billion), by Rest of Asia Pacific, 2018-2029
Figure 86: Middle East & Africa Polyfluoroalkyl Substances (PFAS) Waste Management Market Value Share (%), By Segment 1, 2022 & 2029
Figure 87: Middle East & Africa Polyfluoroalkyl Substances (PFAS) Waste Management Market Forecast (USD Billion), by Sub-Segment 1, 2018-2029
Figure 88: Middle East & Africa Polyfluoroalkyl Substances (PFAS) Waste Management Market Forecast (USD Billion), by Sub-Segment 2, 2018-2029
Figure 89: Middle East & Africa Polyfluoroalkyl Substances (PFAS) Waste Management Market Value Share (%), By Segment 2, 2022 & 2029
Figure 90: Middle East & Africa Polyfluoroalkyl Substances (PFAS) Waste Management Market Forecast (USD Billion), by Sub-Segment 1, 2018-2029
Figure 91: Middle East & Africa Polyfluoroalkyl Substances (PFAS) Waste Management Market Forecast (USD Billion), by Sub-Segment 2, 2018-2029
Figure 92: Middle East & Africa Polyfluoroalkyl Substances (PFAS) Waste Management Market Forecast (USD Billion), by Sub-Segment 3, 2018-2029
Figure 93: Middle East & Africa Polyfluoroalkyl Substances (PFAS) Waste Management Market Forecast (USD Billion), by Others, 2018-2029
Figure 94: Middle East & Africa Polyfluoroalkyl Substances (PFAS) Waste Management Market Value Share (%), By Segment 3, 2022 & 2029
Figure 95: Middle East & Africa Polyfluoroalkyl Substances (PFAS) Waste Management Market Forecast (USD Billion), by Sub-Segment 1, 2018-2029
Figure 96: Middle East & Africa Polyfluoroalkyl Substances (PFAS) Waste Management Market Forecast (USD Billion), by Sub-Segment 2, 2018-2029
Figure 97: Middle East & Africa Polyfluoroalkyl Substances (PFAS) Waste Management Market Forecast (USD Billion), by Sub-Segment 3, 2018-2029
Figure 98: Middle East & Africa Polyfluoroalkyl Substances (PFAS) Waste Management Market Forecast (USD Billion), by Others, 2018-2029
Figure 99: Middle East & Africa Polyfluoroalkyl Substances (PFAS) Waste Management Market Forecast (USD Billion), by GCC, 2018-2029
Figure 100: Middle East & Africa Polyfluoroalkyl Substances (PFAS) Waste Management Market Forecast (USD Billion), by South Africa, 2018-2029
Figure 101: Middle East & Africa Polyfluoroalkyl Substances (PFAS) Waste Management Market Forecast (USD Billion), by Rest of Middle East & Africa, 2018-2029
List of Tables
Table 1: Global Polyfluoroalkyl Substances (PFAS) Waste Management Market Revenue (USD Billion) Forecast, by Segment 1, 2018-2029
Table 2: Global Polyfluoroalkyl Substances (PFAS) Waste Management Market Revenue (USD Billion) Forecast, by Segment 2, 2018-2029
Table 3: Global Polyfluoroalkyl Substances (PFAS) Waste Management Market Revenue (USD Billion) Forecast, by Segment 3, 2018-2029
Table 4: Global Polyfluoroalkyl Substances (PFAS) Waste Management Market Revenue (USD Billion) Forecast, by Region, 2018-2029
Table 5: North America Polyfluoroalkyl Substances (PFAS) Waste Management Market Revenue (USD Billion) Forecast, by Segment 1, 2018-2029
Table 6: North America Polyfluoroalkyl Substances (PFAS) Waste Management Market Revenue (USD Billion) Forecast, by Segment 2, 2018-2029
Table 7: North America Polyfluoroalkyl Substances (PFAS) Waste Management Market Revenue (USD Billion) Forecast, by Segment 3, 2018-2029
Table 8: North America Polyfluoroalkyl Substances (PFAS) Waste Management Market Revenue (USD Billion) Forecast, by Country, 2018-2029
Table 9: Europe Polyfluoroalkyl Substances (PFAS) Waste Management Market Revenue (USD Billion) Forecast, by Segment 1, 2018-2029
Table 10: Europe Polyfluoroalkyl Substances (PFAS) Waste Management Market Revenue (USD Billion) Forecast, by Segment 2, 2018-2029
Table 11: Europe Polyfluoroalkyl Substances (PFAS) Waste Management Market Revenue (USD Billion) Forecast, by Segment 3, 2018-2029
Table 12: Europe Polyfluoroalkyl Substances (PFAS) Waste Management Market Revenue (USD Billion) Forecast, by Country, 2018-2029
Table 13: Latin America Polyfluoroalkyl Substances (PFAS) Waste Management Market Revenue (USD Billion) Forecast, by Segment 1, 2018-2029
Table 14: Latin America Polyfluoroalkyl Substances (PFAS) Waste Management Market Revenue (USD Billion) Forecast, by Segment 2, 2018-2029
Table 15: Latin America Polyfluoroalkyl Substances (PFAS) Waste Management Market Revenue (USD Billion) Forecast, by Segment 3, 2018-2029
Table 16: Latin America Polyfluoroalkyl Substances (PFAS) Waste Management Market Revenue (USD Billion) Forecast, by Country, 2018-2029
Table 17: Asia Pacific Polyfluoroalkyl Substances (PFAS) Waste Management Market Revenue (USD Billion) Forecast, by Segment 1, 2018-2029
Table 18: Asia Pacific Polyfluoroalkyl Substances (PFAS) Waste Management Market Revenue (USD Billion) Forecast, by Segment 2, 2018-2029
Table 19: Asia Pacific Polyfluoroalkyl Substances (PFAS) Waste Management Market Revenue (USD Billion) Forecast, by Segment 3, 2018-2029
Table 20: Asia Pacific Polyfluoroalkyl Substances (PFAS) Waste Management Market Revenue (USD Billion) Forecast, by Country, 2018-2029
Table 21: Middle East & Africa Polyfluoroalkyl Substances (PFAS) Waste Management Market Revenue (USD Billion) Forecast, by Segment 1, 2018-2029
Table 22: Middle East & Africa Polyfluoroalkyl Substances (PFAS) Waste Management Market Revenue (USD Billion) Forecast, by Segment 2, 2018-2029
Table 23: Middle East & Africa Polyfluoroalkyl Substances (PFAS) Waste Management Market Revenue (USD Billion) Forecast, by Segment 3, 2018-2029
Table 24: Middle East & Africa Polyfluoroalkyl Substances (PFAS) Waste Management Market Revenue (USD Billion) Forecast, by Country, 2018-2029
Research Process
Data Library Research are conducted by industry experts who offer insight on
industry structure, market segmentations technology assessment and competitive landscape (CL), and penetration, as well as on emerging trends. Their analysis is based on primary interviews (~ 80%) and secondary research (~ 20%) as well as years of professional expertise in their respective industries. Adding to this, by analysing historical trends and current market positions, our analysts predict where the market will be headed for the next five years. Furthermore, the varying trends of segment & categories geographically presented are also studied and the estimated based on the primary & secondary research.
In this particular report from the supply side Data Library Research has conducted primary surveys (interviews) with the key level executives (VP, CEO’s, Marketing Director, Business Development Manager
and SOFT) of the companies that active & prominent as well as the midsized organization
FIGURE 1: DLR RESEARH PROCESS
![research-methodology1]()
Primary Research
Extensive primary research was conducted to gain a deeper insight of the market and industry performance. The analysis is based on both primary and secondary research as well as years of professional expertise in the respective industries.
In addition to analysing current and historical trends, our analysts predict where the market is headed over the next five years.
It varies by segment for these categories geographically presented in the list of market tables. Speaking about this particular report we have conducted primary surveys (interviews) with the key level executives (VP, CEO’s, Marketing Director, Business Development Manager and many more) of the major players active in the market.
Secondary Research
Secondary research was mainly used to collect and identify information useful for the extensive, technical, market-oriented, and Friend’s study of the Global Extra Neutral Alcohol. It was also used to obtain key information about major players, market classification and segmentation according to the industry trends, geographical markets, and developments related to the market and technology perspectives. For this study, analysts have gathered information from various credible sources, such as annual reports, sec filings, journals, white papers, SOFT presentations, and company web sites.
Market Size Estimation
Both, top-down and bottom-up approaches were used to estimate and validate the size of the Global market and to estimate the size of various other dependent submarkets in the overall Extra Neutral Alcohol. The key players in the market were identified through secondary research and their market contributions in the respective geographies were determined through primary and secondary research.
Forecast Model
![research-methodology2]()