Vacuum Inert Gas Atomization (VIGA) Processing Technology Market Overview and Analysis
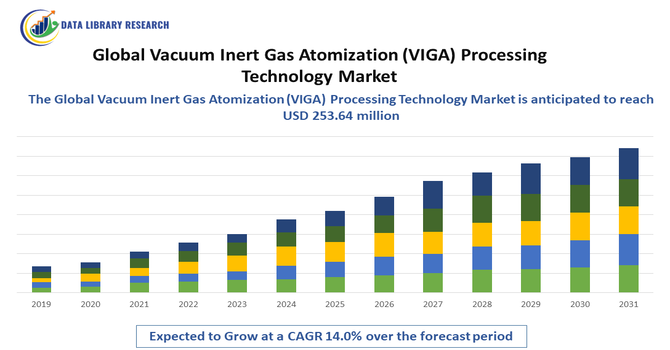
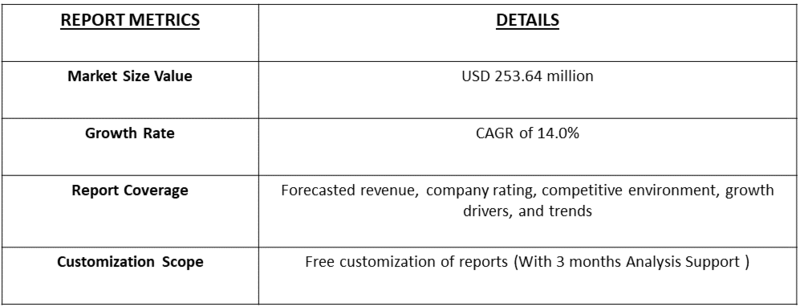
- The Global Vacuum Inert Gas Atomization (VIGA) Processing Technology Market was valued at approximately USD 87.8 million in 2024 and is projected to grow to about USD 253.64 million by 2033, with a compound annual growth rate (CAGR) of 14.0% between 2025 and 2033.
Get Complete Analysis Of The Report - Download Updated Free Sample PDF
The Global Vacuum Inert Gas Atomization (VIGA) Processing Technology Market refers to the worldwide industry focused on advanced manufacturing techniques that produce high-quality metal powders by melting metals in a vacuum and atomizing them with inert gas. This process creates fine, uniform metal powders used in applications like additive manufacturing, aerospace, automotive, and medical industries due to their superior purity and performance. The market is driven by increasing demand for lightweight, high-strength materials and precision parts, as well as advancements in metal 3D printing technologies. Growing adoption in various industrial sectors, along with ongoing research to improve efficiency and reduce costs, is expected to fuel the growth of the VIGA processing technology market globally.
Vacuum Inert Gas Atomization (VIGA) Processing Technology Market Latest Trends
- The vacuum inert gas atomization (VIGA) processing technology market is experiencing significant growth driven by increasing demand for high-quality metal powders in additive manufacturing, aerospace, and automotive industries. Key trends include advancements in atomization techniques to produce finer and more uniform powders, growing adoption of metal 3D printing for lightweight and complex parts, and rising investments in research to improve process efficiency and reduce costs.
- Additionally, the shift towards sustainable manufacturing practices and the development of new alloys for specialized applications are fueling innovation. Expansion in emerging markets and collaborations between technology providers and end-users are further accelerating market growth, making VIGA technology a critical component in the future of advanced manufacturing.
For Detailed Market Segmentation - Get a Free Sample PDF
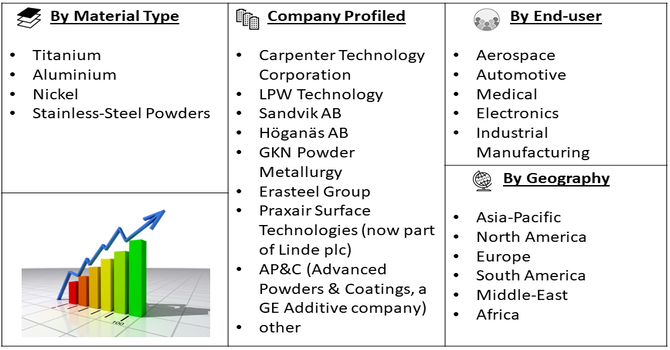
Segmentation: The Vacuum Inert Gas Atomization (VIGA) Processing Technology Market is Segmented by Material Type (Titanium, Aluminium, Nickel, and Stainless-Steel Powders), End-use Industries (Aerospace, Automotive, Medical, Electronics, and Industrial Manufacturing), and Region (North America, Europe, Asia-Pacific, Latin America, Middle East & Africa). The report provides the value (in USD million) for the above segments.
Market Drivers:
- Growing Demand for High-Quality Metal Powders in Additive Manufacturing
The primary drivers of the VIGA processing technology market is the rising demand for high-quality metal powders used in additive manufacturing (3D printing). Industries such as aerospace, automotive, and healthcare increasingly rely on metal 3D printing to produce lightweight, complex, and high-performance components that traditional manufacturing methods cannot easily achieve. VIGA technology produces uniform, pure, and fine metal powders, essential for ensuring the strength and reliability of printed parts. As additive manufacturing continues to grow rapidly due to its design flexibility and cost-efficiency, the demand for superior metal powders made through VIGA is also increasing. This trend is driving investments and innovation in VIGA processes worldwide.
- Advancements in Material Science and Alloy Development
Advances in material science and the development of specialized metal alloys are fueling growth in the VIGA processing technology market. As industries seek materials with enhanced properties such as higher strength, corrosion resistance, and lighter weight, VIGA enables the production of tailored powders with consistent quality and composition. These powders are critical for manufacturing components in aerospace, defense, and medical sectors, where performance and safety are paramount.
Moreover, ongoing research to produce new alloys and improve atomization efficiency is helping manufacturers reduce costs and improve scalability. For instance, in December 2023, Consarc inaugurated Europe’s largest VIGA facility in Sheffield, that marked a significant milestone in the market's growth. The facility was equipped with three 1,000 kg atomizers and had an annual production capacity of 2,200 tons, primarily focused on aerospace-grade nickel superalloy powders. This large-scale setup demonstrated the rising industrial demand for high-quality, high-performance metal powders, especially in the aerospace sector. The investment reflected strong confidence in VIGA technology and enhanced the region’s ability to meet global supply needs. By expanding production capacity and emphasizing advanced materials, the facility strengthened Europe’s role in additive manufacturing and powder metallurgy, contributing to the broader development and competitiveness of the global VIGA processing technology market. @@@@@ This continuous innovation expands the application range of VIGA technology and attracts more end-users, thus driving market expansion.
Market Restraints:
- High Capital and Operational Costs
A significant restraint for the VIGA processing technology market is the high initial capital investment and operational costs associated with setting up and maintaining vacuum inert gas atomization systems. The technology requires specialized equipment, vacuum chambers, and precise control systems, making the machinery expensive to acquire and operate. Additionally, skilled labor is necessary to manage complex processes and ensure product quality, further increasing operational expenses. These high costs can be a barrier for small and medium-sized manufacturers, especially in developing regions, limiting widespread adoption. Until technological advancements and economies of scale bring down these expenses, the market’s growth may face constraints due to affordability challenges.
Socio Economic Impact on Vacuum Inert Gas Atomization (VIGA) Processing Technology Market
The Global Vacuum Inert Gas Atomization (VIGA) Processing Technology Market significantly contributes to the economy by enabling the production of high-quality metal powders essential for advanced manufacturing industries such as aerospace, automotive, and medical devices. This technology supports the growth of metal additive manufacturing, which drives innovation, reduces material waste, and shortens production cycles, leading to cost savings and improved efficiency. The expansion of VIGA technology fosters investments in manufacturing infrastructure and skilled labor, boosting job creation and technological development. Additionally, by supporting lightweight and high-performance materials, the market aids industries in meeting regulatory standards and sustainability goals, further enhancing economic competitiveness and promoting long-term industrial growth globally.
Segmental Analysis:
- Aluminium Segment is Expected to Witness Significant Growth Over the Forecast Period
The aluminium segment in the Vacuum Inert Gas Atomization (VIGA) processing technology market is expected to experience significant growth over the forecast period due to aluminium’s lightweight, corrosion-resistant, and high-strength properties. Aluminium powders produced through VIGA technology are widely used in aerospace, automotive, and electronics industries where weight reduction is critical for fuel efficiency and performance. Additionally, the increasing demand for aluminium-based additive manufacturing components in lightweight vehicles and aircraft is driving market expansion. The superior purity and uniformity of aluminium powders made through VIGA ensure better quality and mechanical properties of finished products. Technological advancements and rising industrial applications of aluminium alloys are further fueling the growth of this segment globally.
- Industrial Manufacturing Segment is Expected to Witness Significant Growth Over the Forecast Period
The industrial manufacturing segment is projected to witness substantial growth in the VIGA processing technology market due to the increasing adoption of advanced metal powders for producing high-performance components. Industries such as automotive, aerospace, heavy machinery, and electronics are increasingly using VIGA-produced powders for additive manufacturing, enabling lighter, stronger, and more complex parts. The demand for improved efficiency, reduced waste, and shorter production cycles is pushing manufacturers to adopt vacuum inert gas atomization technology. Additionally, government initiatives promoting modernization and sustainability in manufacturing processes are encouraging the use of precision powders. As a result, the industrial manufacturing segment is set to be a key driver of market growth during the forecast period.
- North America Region is Expected to Witness Significant Growth Over the Forecast Period
North America is expected to experience significant growth in the Vacuum Inert Gas Atomization (VIGA) processing technology market due to the presence of advanced manufacturing industries and strong R&D infrastructure. The region has a large base of aerospace, automotive, and medical device manufacturers that demand high-quality metal powders for additive manufacturing and other precision applications. Increasing investments in advanced manufacturing technologies and supportive government policies aimed at promoting innovation and sustainability are further driving market expansion.
Moreover, North America’s adoption of Industry 4.0 and digital manufacturing solutions is boosting the demand for superior powders produced by VIGA technology. For instance, in March 2024, Topcast launched Research-X VIGA Lab, that is fueling market growth by introducing advanced precision and process control to metal powder production. The lab's 25 kg chamber and real-time in-line particle size distribution (PSD) analyzer enable rapid adjustments of the D₅₀ (median particle size) within ±2 µm during a 20-minute cycle. This high level of control ensures consistent powder quality, which is critical for applications in additive manufacturing, aerospace, and medical industries. By reducing trial-and-error, material waste, and production time, the system enhances efficiency and lowers operational costs. Such innovations increase manufacturer confidence in VIGA technology, encouraging wider adoption and investment, and thereby accelerating the overall growth of the vacuum inert gas atomization market.
These factors collectively contribute to the region’s leading position and expected growth in the market.
For Detailed Market Segmentation - Get a Free Sample PDF
Vacuum Inert Gas Atomization (VIGA) Processing Technology Market Competitive Landscape
The competitive landscape of the Vacuum Inert Gas Atomization (VIGA) Processing Technology Market is highly dynamic, featuring a mix of established industrial giants and innovative specialized firms focused on advancing metal powder production. Key players such as Carpenter Technology Corporation, LPW Technology, Sandvik AB, and Höganäs AB dominate the market by offering high-quality atomized powders and investing heavily in research and development to enhance process efficiency and powder performance. These companies often collaborate with aerospace, automotive, and medical industries to develop tailored solutions. Additionally, emerging players and startups are driving innovation by introducing new alloys and improving atomization techniques. Intense competition, coupled with continuous technological advancements and strategic partnerships, is pushing companies to expand their product portfolios and geographic presence to capture growing demand globally.
The 20 major players for this market are:
- Carpenter Technology Corporation
- LPW Technology
- Sandvik AB
- Höganäs AB
- GKN Powder Metallurgy
- Erasteel Group
- Praxair Surface Technologies (now part of Linde plc)
- AP&C (Advanced Powders & Coatings, a GE Additive company)
- TLS Technik GmbH & Co. Spezialpulver KG
- MIMETECH Powder Metallurgy
- Valimet Inc.
- PyroGenesis Canada Inc.
- Advanced Powders & Coatings (AP&C)
- Oerlikon Metco
- H.C. Starck GmbH (part of Sandvik)
- Outokumpu Group
- Hitachi Metals, Ltd.
- Metco Powder Systems
- H.C. Starck Solutions
Recent Development
- In April 2025, an article published by Beijing University of Technology, Beijing, China reported that, researchers successfully developed a high-strength Al-4.5Mg-0.7Er-0.5Zr-0.3Sc alloy powder for additive manufacturing using Vacuum Inert Gas Atomization (VIGA). By optimizing the atomizer design—specifically a 32° convergence angle and 5 mm tube extension—and setting precise parameters (800 °C melt temperature, 3.25 MPa pressure), they achieved fine, spherical powders with a high yield of 39.45%. These conditions improved melt flow, particle refinement, and powder uniformity. This study highlights how advanced atomizer design and process optimization can significantly enhance powder quality and yield. It strengthens the role of VIGA in producing high-performance alloy powders for critical industries like aerospace and automotive, driving further adoption in precision additive manufacturing.
- In February 2025, an article published by School of Materials Science and Engineering, University of Science and Technology Beijing, China, reported that study of vacuum inert gas atomization (VIGA) and electrode-induced gas atomization (EIGA) methods for producing Ni-based FGH4096 superalloy powders, researchers analyzed particle characteristics and mechanical performance. EIGA, a crucible-free method, produced powders with finer particle size and smoother surfaces, while VIGA powders had more satellite particles but resulted in slightly stronger as-HIPed (hot isostatic pressed) blanks. This study reinforces the strengths of VIGA in producing superalloy powders with superior mechanical performance after HIP processing, validating its continued use for critical applications requiring strength and reliability, such as aerospace components.
Frequently Asked Questions (FAQ) :
Q1. What the main growth driving factors for this market?
The main growth driver for the Vacuum Inert Gas Atomization (VIGA) market is the explosive demand from Additive Manufacturing (3D Printing). VIGA is superior at producing the high-purity, perfectly spherical metal powders—especially for superalloys—that 3D printers require. Additionally, the aerospace, defense, and medical industries are rapidly increasing their use of these VIGA-produced powders to manufacture mission-critical components. These sectors need lightweight, high-performance, and corrosion-resistant parts, which only VIGA's specialized process can reliably provide.
Q2. What are the main restraining factors for this market?
The primary restraining factor is the exceptionally high initial investment cost for VIGA equipment and the complexity of the process. Setting up a VIGA facility requires a significant financial outlay, making it unaffordable for smaller companies. Furthermore, the technology demands highly skilled operators for maintenance and quality control, creating a challenge in finding and retaining specialized labor. Finally, the availability of competing, lower-cost atomization methods sometimes limits VIGA adoption in applications where ultra-high purity is not strictly necessary.
Q3. Which segment is expected to witness high growth?
The highest growth is expected in the Aerospace and Additive Manufacturing (AM) Application segment. The aerospace sector constantly seeks materials with the best strength-to-weight ratio for parts like turbine blades and engine components, and VIGA-produced superalloys are the gold standard. Since VIGA powders are crucial for powder bed fusion (a key AM technique), the rapid expansion of industrial 3D printing is creating a huge, sustained need for VIGA systems and high-value, quality metal powders.
Q4. Who are the top major players for this market?
The VIGA market is dominated by global technology and equipment manufacturers specializing in vacuum metallurgy. Key players include ALD Vacuum Technologies, a major German firm known for its wide range of atomization systems, and Retech Systems LLC, a leading U.S.-based provider. Other significant players in the equipment and specialized powder supply chain are often referenced, such as Consarc and companies like Phoenix Scientific Industries (PSI), who focus on delivering complete processing solutions for high-performance alloy powders.
Q5. Which country is the largest player?
North America, primarily the United States, is the largest market player, holding the highest share of global VIGA equipment installations and production capacity. This leadership is driven by the region's massive aerospace and defense industry, which is the largest consumer of VIGA-produced superalloy powders for high-performance components. Additionally, the U.S. has a mature ecosystem of advanced manufacturing research and strong investment in industrial-scale metal additive manufacturing.
List of Figures
Figure 1: Global Vacuum Inert Gas Atomization (VIGA) Processing Technology Market Revenue Breakdown (USD Billion, %) by Region, 2023 & 2029
Figure 2: Global Vacuum Inert Gas Atomization (VIGA) Processing Technology Market Value Share (%), By Segment 1, 2023 & 2029
Figure 3: Global Vacuum Inert Gas Atomization (VIGA) Processing Technology Market Forecast (USD Billion), by Sub-Segment 1, 2018-2029
Figure 4: Global Vacuum Inert Gas Atomization (VIGA) Processing Technology Market Forecast (USD Billion), by Sub-Segment 2, 2018-2029
Figure 5: Global Vacuum Inert Gas Atomization (VIGA) Processing Technology Market Value Share (%), By Segment 2, 2023 & 2029
Figure 6: Global Vacuum Inert Gas Atomization (VIGA) Processing Technology Market Forecast (USD Billion), by Sub-Segment 1, 2018-2029
Figure 7: Global Vacuum Inert Gas Atomization (VIGA) Processing Technology Market Forecast (USD Billion), by Sub-Segment 2, 2018-2029
Figure 8: Global Vacuum Inert Gas Atomization (VIGA) Processing Technology Market Forecast (USD Billion), by Sub-Segment 3, 2018-2029
Figure 9: Global Vacuum Inert Gas Atomization (VIGA) Processing Technology Market Forecast (USD Billion), by Others, 2018-2029
Figure 10: Global Vacuum Inert Gas Atomization (VIGA) Processing Technology Market Value Share (%), By Segment 3, 2023 & 2029
Figure 11: Global Vacuum Inert Gas Atomization (VIGA) Processing Technology Market Forecast (USD Billion), by Sub-Segment 1, 2018-2029
Figure 12: Global Vacuum Inert Gas Atomization (VIGA) Processing Technology Market Forecast (USD Billion), by Sub-Segment 2, 2018-2029
Figure 13: Global Vacuum Inert Gas Atomization (VIGA) Processing Technology Market Forecast (USD Billion), by Sub-Segment 3, 2018-2029
Figure 14: Global Vacuum Inert Gas Atomization (VIGA) Processing Technology Market Forecast (USD Billion), by Others, 2018-2029
Figure 15: Global Vacuum Inert Gas Atomization (VIGA) Processing Technology Market Value (USD Billion), by Region, 2023 & 2029
Figure 16: North America Vacuum Inert Gas Atomization (VIGA) Processing Technology Market Value Share (%), By Segment 1, 2023 & 2029
Figure 17: North America Vacuum Inert Gas Atomization (VIGA) Processing Technology Market Forecast (USD Billion), by Sub-Segment 1, 2018-2029
Figure 18: North America Vacuum Inert Gas Atomization (VIGA) Processing Technology Market Forecast (USD Billion), by Sub-Segment 2, 2018-2029
Figure 19: North America Vacuum Inert Gas Atomization (VIGA) Processing Technology Market Value Share (%), By Segment 2, 2023 & 2029
Figure 20: North America Vacuum Inert Gas Atomization (VIGA) Processing Technology Market Forecast (USD Billion), by Sub-Segment 1, 2018-2029
Figure 21: North America Vacuum Inert Gas Atomization (VIGA) Processing Technology Market Forecast (USD Billion), by Sub-Segment 2, 2018-2029
Figure 22: North America Vacuum Inert Gas Atomization (VIGA) Processing Technology Market Forecast (USD Billion), by Sub-Segment 3, 2018-2029
Figure 23: North America Vacuum Inert Gas Atomization (VIGA) Processing Technology Market Forecast (USD Billion), by Others, 2018-2029
Figure 24: North America Vacuum Inert Gas Atomization (VIGA) Processing Technology Market Value Share (%), By Segment 3, 2023 & 2029
Figure 25: North America Vacuum Inert Gas Atomization (VIGA) Processing Technology Market Forecast (USD Billion), by Sub-Segment 1, 2018-2029
Figure 26: North America Vacuum Inert Gas Atomization (VIGA) Processing Technology Market Forecast (USD Billion), by Sub-Segment 2, 2018-2029
Figure 27: North America Vacuum Inert Gas Atomization (VIGA) Processing Technology Market Forecast (USD Billion), by Sub-Segment 3, 2018-2029
Figure 28: North America Vacuum Inert Gas Atomization (VIGA) Processing Technology Market Forecast (USD Billion), by Others, 2018-2029
Figure 29: North America Vacuum Inert Gas Atomization (VIGA) Processing Technology Market Forecast (USD Billion), by U.S., 2018-2029
Figure 30: North America Vacuum Inert Gas Atomization (VIGA) Processing Technology Market Forecast (USD Billion), by Canada, 2018-2029
Figure 31: Latin America Vacuum Inert Gas Atomization (VIGA) Processing Technology Market Value Share (%), By Segment 1, 2023 & 2029
Figure 32: Latin America Vacuum Inert Gas Atomization (VIGA) Processing Technology Market Forecast (USD Billion), by Sub-Segment 1, 2018-2029
Figure 33: Latin America Vacuum Inert Gas Atomization (VIGA) Processing Technology Market Forecast (USD Billion), by Sub-Segment 2, 2018-2029
Figure 34: Latin America Vacuum Inert Gas Atomization (VIGA) Processing Technology Market Value Share (%), By Segment 2, 2023 & 2029
Figure 35: Latin America Vacuum Inert Gas Atomization (VIGA) Processing Technology Market Forecast (USD Billion), by Sub-Segment 1, 2018-2029
Figure 36: Latin America Vacuum Inert Gas Atomization (VIGA) Processing Technology Market Forecast (USD Billion), by Sub-Segment 2, 2018-2029
Figure 37: Latin America Vacuum Inert Gas Atomization (VIGA) Processing Technology Market Forecast (USD Billion), by Sub-Segment 3, 2018-2029
Figure 38: Latin America Vacuum Inert Gas Atomization (VIGA) Processing Technology Market Forecast (USD Billion), by Others, 2018-2029
Figure 39: Latin America Vacuum Inert Gas Atomization (VIGA) Processing Technology Market Value Share (%), By Segment 3, 2023 & 2029
Figure 40: Latin America Vacuum Inert Gas Atomization (VIGA) Processing Technology Market Forecast (USD Billion), by Sub-Segment 1, 2018-2029
Figure 41: Latin America Vacuum Inert Gas Atomization (VIGA) Processing Technology Market Forecast (USD Billion), by Sub-Segment 2, 2018-2029
Figure 42: Latin America Vacuum Inert Gas Atomization (VIGA) Processing Technology Market Forecast (USD Billion), by Sub-Segment 3, 2018-2029
Figure 43: Latin America Vacuum Inert Gas Atomization (VIGA) Processing Technology Market Forecast (USD Billion), by Others, 2018-2029
Figure 44: Latin America Vacuum Inert Gas Atomization (VIGA) Processing Technology Market Forecast (USD Billion), by Brazil, 2018-2029
Figure 45: Latin America Vacuum Inert Gas Atomization (VIGA) Processing Technology Market Forecast (USD Billion), by Mexico, 2018-2029
Figure 46: Latin America Vacuum Inert Gas Atomization (VIGA) Processing Technology Market Forecast (USD Billion), by Rest of Latin America, 2018-2029
Figure 47: Europe Vacuum Inert Gas Atomization (VIGA) Processing Technology Market Value Share (%), By Segment 1, 2023 & 2029
Figure 48: Europe Vacuum Inert Gas Atomization (VIGA) Processing Technology Market Forecast (USD Billion), by Sub-Segment 1, 2018-2029
Figure 49: Europe Vacuum Inert Gas Atomization (VIGA) Processing Technology Market Forecast (USD Billion), by Sub-Segment 2, 2018-2029
Figure 50: Europe Vacuum Inert Gas Atomization (VIGA) Processing Technology Market Value Share (%), By Segment 2, 2023 & 2029
Figure 51: Europe Vacuum Inert Gas Atomization (VIGA) Processing Technology Market Forecast (USD Billion), by Sub-Segment 1, 2018-2029
Figure 52: Europe Vacuum Inert Gas Atomization (VIGA) Processing Technology Market Forecast (USD Billion), by Sub-Segment 2, 2018-2029
Figure 53: Europe Vacuum Inert Gas Atomization (VIGA) Processing Technology Market Forecast (USD Billion), by Sub-Segment 3, 2018-2029
Figure 54: Europe Vacuum Inert Gas Atomization (VIGA) Processing Technology Market Forecast (USD Billion), by Others, 2018-2029
Figure 55: Europe Vacuum Inert Gas Atomization (VIGA) Processing Technology Market Value Share (%), By Segment 3, 2023 & 2029
Figure 56: Europe Vacuum Inert Gas Atomization (VIGA) Processing Technology Market Forecast (USD Billion), by Sub-Segment 1, 2018-2029
Figure 57: Europe Vacuum Inert Gas Atomization (VIGA) Processing Technology Market Forecast (USD Billion), by Sub-Segment 2, 2018-2029
Figure 58: Europe Vacuum Inert Gas Atomization (VIGA) Processing Technology Market Forecast (USD Billion), by Sub-Segment 3, 2018-2029
Figure 59: Europe Vacuum Inert Gas Atomization (VIGA) Processing Technology Market Forecast (USD Billion), by Others, 2018-2029
Figure 60: Europe Vacuum Inert Gas Atomization (VIGA) Processing Technology Market Forecast (USD Billion), by U.K., 2018-2029
Figure 61: Europe Vacuum Inert Gas Atomization (VIGA) Processing Technology Market Forecast (USD Billion), by Germany, 2018-2029
Figure 62: Europe Vacuum Inert Gas Atomization (VIGA) Processing Technology Market Forecast (USD Billion), by France, 2018-2029
Figure 63: Europe Vacuum Inert Gas Atomization (VIGA) Processing Technology Market Forecast (USD Billion), by Italy, 2018-2029
Figure 64: Europe Vacuum Inert Gas Atomization (VIGA) Processing Technology Market Forecast (USD Billion), by Spain, 2018-2029
Figure 65: Europe Vacuum Inert Gas Atomization (VIGA) Processing Technology Market Forecast (USD Billion), by Russia, 2018-2029
Figure 66: Europe Vacuum Inert Gas Atomization (VIGA) Processing Technology Market Forecast (USD Billion), by Rest of Europe, 2018-2029
Figure 67: Asia Pacific Vacuum Inert Gas Atomization (VIGA) Processing Technology Market Value Share (%), By Segment 1, 2023 & 2029
Figure 68: Asia Pacific Vacuum Inert Gas Atomization (VIGA) Processing Technology Market Forecast (USD Billion), by Sub-Segment 1, 2018-2029
Figure 69: Asia Pacific Vacuum Inert Gas Atomization (VIGA) Processing Technology Market Forecast (USD Billion), by Sub-Segment 2, 2018-2029
Figure 70: Asia Pacific Vacuum Inert Gas Atomization (VIGA) Processing Technology Market Value Share (%), By Segment 2, 2023 & 2029
Figure 71: Asia Pacific Vacuum Inert Gas Atomization (VIGA) Processing Technology Market Forecast (USD Billion), by Sub-Segment 1, 2018-2029
Figure 72: Asia Pacific Vacuum Inert Gas Atomization (VIGA) Processing Technology Market Forecast (USD Billion), by Sub-Segment 2, 2018-2029
Figure 73: Asia Pacific Vacuum Inert Gas Atomization (VIGA) Processing Technology Market Forecast (USD Billion), by Sub-Segment 3, 2018-2029
Figure 74: Asia Pacific Vacuum Inert Gas Atomization (VIGA) Processing Technology Market Forecast (USD Billion), by Others, 2018-2029
Figure 75: Asia Pacific Vacuum Inert Gas Atomization (VIGA) Processing Technology Market Value Share (%), By Segment 3, 2023 & 2029
Figure 76: Asia Pacific Vacuum Inert Gas Atomization (VIGA) Processing Technology Market Forecast (USD Billion), by Sub-Segment 1, 2018-2029
Figure 77: Asia Pacific Vacuum Inert Gas Atomization (VIGA) Processing Technology Market Forecast (USD Billion), by Sub-Segment 2, 2018-2029
Figure 78: Asia Pacific Vacuum Inert Gas Atomization (VIGA) Processing Technology Market Forecast (USD Billion), by Sub-Segment 3, 2018-2029
Figure 79: Asia Pacific Vacuum Inert Gas Atomization (VIGA) Processing Technology Market Forecast (USD Billion), by Others, 2018-2029
Figure 80: Asia Pacific Vacuum Inert Gas Atomization (VIGA) Processing Technology Market Forecast (USD Billion), by China, 2018-2029
Figure 81: Asia Pacific Vacuum Inert Gas Atomization (VIGA) Processing Technology Market Forecast (USD Billion), by India, 2018-2029
Figure 82: Asia Pacific Vacuum Inert Gas Atomization (VIGA) Processing Technology Market Forecast (USD Billion), by Japan, 2018-2029
Figure 83: Asia Pacific Vacuum Inert Gas Atomization (VIGA) Processing Technology Market Forecast (USD Billion), by Australia, 2018-2029
Figure 84: Asia Pacific Vacuum Inert Gas Atomization (VIGA) Processing Technology Market Forecast (USD Billion), by Southeast Asia, 2018-2029
Figure 85: Asia Pacific Vacuum Inert Gas Atomization (VIGA) Processing Technology Market Forecast (USD Billion), by Rest of Asia Pacific, 2018-2029
Figure 86: Middle East & Africa Vacuum Inert Gas Atomization (VIGA) Processing Technology Market Value Share (%), By Segment 1, 2023 & 2029
Figure 87: Middle East & Africa Vacuum Inert Gas Atomization (VIGA) Processing Technology Market Forecast (USD Billion), by Sub-Segment 1, 2018-2029
Figure 88: Middle East & Africa Vacuum Inert Gas Atomization (VIGA) Processing Technology Market Forecast (USD Billion), by Sub-Segment 2, 2018-2029
Figure 89: Middle East & Africa Vacuum Inert Gas Atomization (VIGA) Processing Technology Market Value Share (%), By Segment 2, 2023 & 2029
Figure 90: Middle East & Africa Vacuum Inert Gas Atomization (VIGA) Processing Technology Market Forecast (USD Billion), by Sub-Segment 1, 2018-2029
Figure 91: Middle East & Africa Vacuum Inert Gas Atomization (VIGA) Processing Technology Market Forecast (USD Billion), by Sub-Segment 2, 2018-2029
Figure 92: Middle East & Africa Vacuum Inert Gas Atomization (VIGA) Processing Technology Market Forecast (USD Billion), by Sub-Segment 3, 2018-2029
Figure 93: Middle East & Africa Vacuum Inert Gas Atomization (VIGA) Processing Technology Market Forecast (USD Billion), by Others, 2018-2029
Figure 94: Middle East & Africa Vacuum Inert Gas Atomization (VIGA) Processing Technology Market Value Share (%), By Segment 3, 2023 & 2029
Figure 95: Middle East & Africa Vacuum Inert Gas Atomization (VIGA) Processing Technology Market Forecast (USD Billion), by Sub-Segment 1, 2018-2029
Figure 96: Middle East & Africa Vacuum Inert Gas Atomization (VIGA) Processing Technology Market Forecast (USD Billion), by Sub-Segment 2, 2018-2029
Figure 97: Middle East & Africa Vacuum Inert Gas Atomization (VIGA) Processing Technology Market Forecast (USD Billion), by Sub-Segment 3, 2018-2029
Figure 98: Middle East & Africa Vacuum Inert Gas Atomization (VIGA) Processing Technology Market Forecast (USD Billion), by Others, 2018-2029
Figure 99: Middle East & Africa Vacuum Inert Gas Atomization (VIGA) Processing Technology Market Forecast (USD Billion), by GCC, 2018-2029
Figure 100: Middle East & Africa Vacuum Inert Gas Atomization (VIGA) Processing Technology Market Forecast (USD Billion), by South Africa, 2018-2029
Figure 101: Middle East & Africa Vacuum Inert Gas Atomization (VIGA) Processing Technology Market Forecast (USD Billion), by Rest of Middle East & Africa, 2018-2029
List of Tables
Table 1: Global Vacuum Inert Gas Atomization (VIGA) Processing Technology Market Revenue (USD Billion) Forecast, by Segment 1, 2018-2029
Table 2: Global Vacuum Inert Gas Atomization (VIGA) Processing Technology Market Revenue (USD Billion) Forecast, by Segment 2, 2018-2029
Table 3: Global Vacuum Inert Gas Atomization (VIGA) Processing Technology Market Revenue (USD Billion) Forecast, by Segment 3, 2018-2029
Table 4: Global Vacuum Inert Gas Atomization (VIGA) Processing Technology Market Revenue (USD Billion) Forecast, by Region, 2018-2029
Table 5: North America Vacuum Inert Gas Atomization (VIGA) Processing Technology Market Revenue (USD Billion) Forecast, by Segment 1, 2018-2029
Table 6: North America Vacuum Inert Gas Atomization (VIGA) Processing Technology Market Revenue (USD Billion) Forecast, by Segment 2, 2018-2029
Table 7: North America Vacuum Inert Gas Atomization (VIGA) Processing Technology Market Revenue (USD Billion) Forecast, by Segment 3, 2018-2029
Table 8: North America Vacuum Inert Gas Atomization (VIGA) Processing Technology Market Revenue (USD Billion) Forecast, by Country, 2018-2029
Table 9: Europe Vacuum Inert Gas Atomization (VIGA) Processing Technology Market Revenue (USD Billion) Forecast, by Segment 1, 2018-2029
Table 10: Europe Vacuum Inert Gas Atomization (VIGA) Processing Technology Market Revenue (USD Billion) Forecast, by Segment 2, 2018-2029
Table 11: Europe Vacuum Inert Gas Atomization (VIGA) Processing Technology Market Revenue (USD Billion) Forecast, by Segment 3, 2018-2029
Table 12: Europe Vacuum Inert Gas Atomization (VIGA) Processing Technology Market Revenue (USD Billion) Forecast, by Country, 2018-2029
Table 13: Latin America Vacuum Inert Gas Atomization (VIGA) Processing Technology Market Revenue (USD Billion) Forecast, by Segment 1, 2018-2029
Table 14: Latin America Vacuum Inert Gas Atomization (VIGA) Processing Technology Market Revenue (USD Billion) Forecast, by Segment 2, 2018-2029
Table 15: Latin America Vacuum Inert Gas Atomization (VIGA) Processing Technology Market Revenue (USD Billion) Forecast, by Segment 3, 2018-2029
Table 16: Latin America Vacuum Inert Gas Atomization (VIGA) Processing Technology Market Revenue (USD Billion) Forecast, by Country, 2018-2029
Table 17: Asia Pacific Vacuum Inert Gas Atomization (VIGA) Processing Technology Market Revenue (USD Billion) Forecast, by Segment 1, 2018-2029
Table 18: Asia Pacific Vacuum Inert Gas Atomization (VIGA) Processing Technology Market Revenue (USD Billion) Forecast, by Segment 2, 2018-2029
Table 19: Asia Pacific Vacuum Inert Gas Atomization (VIGA) Processing Technology Market Revenue (USD Billion) Forecast, by Segment 3, 2018-2029
Table 20: Asia Pacific Vacuum Inert Gas Atomization (VIGA) Processing Technology Market Revenue (USD Billion) Forecast, by Country, 2018-2029
Table 21: Middle East & Africa Vacuum Inert Gas Atomization (VIGA) Processing Technology Market Revenue (USD Billion) Forecast, by Segment 1, 2018-2029
Table 22: Middle East & Africa Vacuum Inert Gas Atomization (VIGA) Processing Technology Market Revenue (USD Billion) Forecast, by Segment 2, 2018-2029
Table 23: Middle East & Africa Vacuum Inert Gas Atomization (VIGA) Processing Technology Market Revenue (USD Billion) Forecast, by Segment 3, 2018-2029
Table 24: Middle East & Africa Vacuum Inert Gas Atomization (VIGA) Processing Technology Market Revenue (USD Billion) Forecast, by Country, 2018-2029
Research Process
Data Library Research are conducted by industry experts who offer insight on
industry structure, market segmentations technology assessment and competitive landscape (CL), and penetration, as well as on emerging trends. Their analysis is based on primary interviews (~ 80%) and secondary research (~ 20%) as well as years of professional expertise in their respective industries. Adding to this, by analysing historical trends and current market positions, our analysts predict where the market will be headed for the next five years. Furthermore, the varying trends of segment & categories geographically presented are also studied and the estimated based on the primary & secondary research.
In this particular report from the supply side Data Library Research has conducted primary surveys (interviews) with the key level executives (VP, CEO’s, Marketing Director, Business Development Manager
and SOFT) of the companies that active & prominent as well as the midsized organization
FIGURE 1: DLR RESEARH PROCESS
![research-methodology1]()
Primary Research
Extensive primary research was conducted to gain a deeper insight of the market and industry performance. The analysis is based on both primary and secondary research as well as years of professional expertise in the respective industries.
In addition to analysing current and historical trends, our analysts predict where the market is headed over the next five years.
It varies by segment for these categories geographically presented in the list of market tables. Speaking about this particular report we have conducted primary surveys (interviews) with the key level executives (VP, CEO’s, Marketing Director, Business Development Manager and many more) of the major players active in the market.
Secondary Research
Secondary research was mainly used to collect and identify information useful for the extensive, technical, market-oriented, and Friend’s study of the Global Extra Neutral Alcohol. It was also used to obtain key information about major players, market classification and segmentation according to the industry trends, geographical markets, and developments related to the market and technology perspectives. For this study, analysts have gathered information from various credible sources, such as annual reports, sec filings, journals, white papers, SOFT presentations, and company web sites.
Market Size Estimation
Both, top-down and bottom-up approaches were used to estimate and validate the size of the Global market and to estimate the size of various other dependent submarkets in the overall Extra Neutral Alcohol. The key players in the market were identified through secondary research and their market contributions in the respective geographies were determined through primary and secondary research.
Forecast Model
![research-methodology2]()