Electricity Transmission and Distribution Market Overview and Analysis

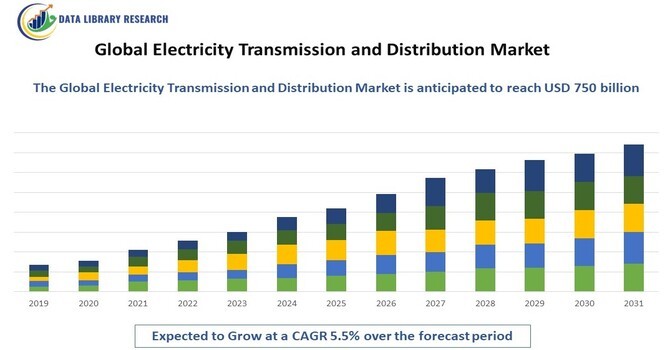
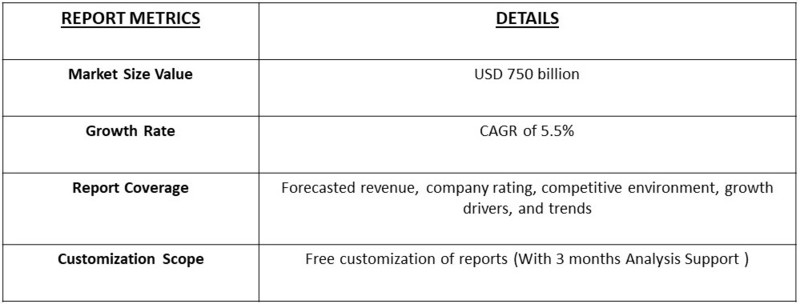
The global electricity transmission and distribution market was valued at approximately $500 billion in 2023 and is projected to reach around $750 billion by 2031, representing a compound annual growth rate (CAGR) of about 5.5% from 2023 to 2031.

Electricity Transmission and Distribution Market

Get Complete Analysis Of The Report - Download Free Sample PDF

The electricity transmission and distribution sector is a critical component of the overall energy system, comprising the networks and technologies essential for transporting electricity from generation sources, such as power plants and renewable energy facilities, to end-users, which include residential, commercial, and industrial consumers. This sector plays a vital role in ensuring reliable electricity supply and is increasingly becoming more complex due to several key factors.

One of the primary drivers of growth in this market is the increasing global demand for electricity. As populations grow and urban areas expand, the need for energy continues to rise. This demand is further fueled by the proliferation of digital devices, electric vehicles, and a general shift towards more energy-intensive lifestyles. Meeting this escalating demand requires significant investments in transmission and distribution infrastructure to enhance capacity and reliability.

Another major trend is the shift toward renewable energy sources. With a global push for sustainability and reduced carbon emissions, more power is being generated from renewable sources such as solar, wind, and hydroelectric systems. However, these energy sources are often intermittent and geographically dispersed, necessitating advancements in transmission systems to efficiently transport electricity from remote generation sites to urban centers. This transition demands the development of new transmission lines, substations, and grid interconnections, which can facilitate the integration of renewable energy into the existing grid.

Electricity Transmission and Distribution Market Trends

Key trends influencing the electricity transmission and distribution market include the increasing adoption of smart grid technologies, which enable real-time monitoring and management of electricity flows, enhancing system efficiency and reliability. The integration of renewable energy sources into the grid is also a major trend, leading to investments in new transmission lines and infrastructure upgrades. Additionally, energy storage solutions are gaining traction, allowing for better management of supply and demand fluctuations. Growing regulatory frameworks aimed at reducing greenhouse gas emissions are prompting utilities to explore more sustainable and efficient energy solutions. Collaborative efforts among stakeholders, including government agencies, utilities, and technology providers, are fostering innovation and investment in the sector.

Market Segmentation

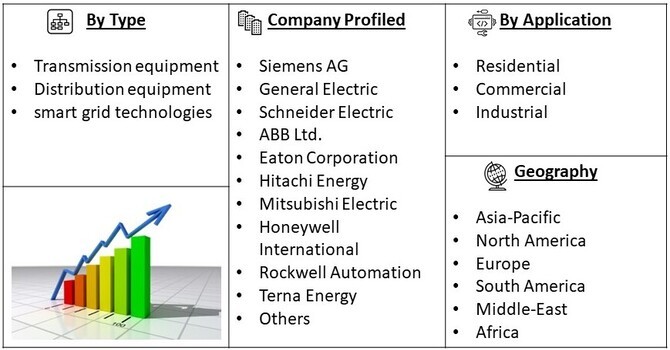
The global electricity transmission and distribution market is segmented by product type (transmission equipment, distribution equipment, and smart grid technologies), application (residential, commercial, and industrial), and geography (North America, Europe, Asia-Pacific, Latin America, and the Middle East and Africa). This segmentation provides insights into market dynamics, enabling stakeholders to identify opportunities for growth and development in specific areas.

Electricity Transmission and Distribution Market Segment

For Detailed Market Segmentation - Get a Free Sample PDF

Market Drivers

  • Rising Demand for Electricity

The escalating global demand for electricity is fundamentally reshaping the electric transmission and distribution market, primarily fueled by urbanization, population growth, and rapid economic development. As cities expand and more individuals transition from rural to urban living, the need for reliable and consistent electricity supply intensifies. This urban influx increases energy consumption in residential, commercial, and industrial sectors, necessitating the development of robust transmission and distribution networks. Industries are expanding their operations and adopting energy-intensive technologies, which further amplifies electricity demand. As manufacturing processes become more automated and advanced, the reliance on stable energy sources becomes critical to maintaining productivity and efficiency. Similarly, the rise of digital technologies and electric vehicles adds new layers of demand on the existing grid, requiring utilities to upgrade and expand their infrastructure. Moreover, as more households gain access to electricity—particularly in developing regions—the pressure on transmission and distribution networks increases significantly. This trend calls for substantial investments in infrastructure, such as new transmission lines, substations, and grid enhancements, to ensure that electricity can be delivered reliably and efficiently to all consumers. Utilities must focus on modernizing aging infrastructure while expanding capacity to accommodate future growth.

  • Integration of Renewable Energy

The transition to renewable energy sources is significantly transforming the electric transmission and distribution landscape. With an increasing share of solar and wind power being integrated into the grid, utilities face the challenge of managing the intermittent and variable nature of these energy sources. This necessitates enhancements in transmission capabilities to ensure that energy can be effectively delivered from generation sites, often located far from consumption centers. As a result, substantial investments in grid modernization are required to upgrade existing infrastructure, enabling smarter, more responsive systems that can handle fluctuating energy outputs. Additionally, energy storage solutions, such as batteries, play a vital role in stabilizing the grid by storing excess energy generated during peak production times for use when demand rises. This integration of renewables and advanced technologies not only supports a more sustainable energy ecosystem but also drives market growth by fostering innovations that enhance reliability, efficiency, and resilience. Overall, the shift toward renewable energy is paving the way for a more dynamic and robust electric transmission and distribution network, positioning utilities to meet future energy demands effectively.

Market Restraints

One significant restraint for the electricity transmission and distribution market is the high capital investment required for infrastructure development and modernization. Upgrading aging grid systems, implementing smart grid technologies, and integrating renewable energy sources necessitate substantial financial resources. This can be particularly challenging for utilities operating in regions with limited budgets or regulatory constraints, leading to delays in necessary upgrades and expansions. Additionally, the complexity of navigating regulatory approvals and permitting processes can further hinder investment and slow the pace of modernization, ultimately impacting the overall efficiency and reliability of electricity delivery systems.

COVID-19 Impact On Electricity Transmission and Distribution Market

The COVID-19 pandemic had a profound effect on the electric transmission and distribution market, causing significant project delays and supply chain disruptions that hindered the timely delivery of essential services. Many utility companies grappled with operational challenges, including workforce shortages and the need to implement stringent safety protocols, which impacted maintenance and development efforts. However, the pandemic also acted as a catalyst for digital transformation within the sector. Utilities increasingly turned to remote monitoring and management technologies to ensure uninterrupted service delivery and improve operational efficiency, enabling them to adapt to the new normal. As economies begin to recover, there is a renewed focus on infrastructure investment aimed at enhancing grid reliability and resilience. This strategic emphasis not only addresses the vulnerabilities exposed during the pandemic but also sets the stage for potential growth in the market, as stakeholders prioritize modernization and the integration of smart technologies to future-proof energy delivery systems. Ultimately, the lessons learned during this period may foster a more resilient and adaptive electric transmission and distribution landscape.

Segmental Analysis

  • Smart Grid Technologies Segment Holds Significant Share

The smart grid technologies segment is projected to capture a substantial share of the electric transmission and distribution market, fueled by the escalating demand for enhanced grid efficiency and reliability. These advanced technologies empower utilities to monitor, control, and optimize energy flows in real-time, leading to significant improvements in operational performance and a reduction in outages. By integrating smart grid solutions, utilities can leverage data analytics and automated systems to proactively manage energy distribution, which not only improves service reliability but also facilitates quicker responses to issues as they arise. The increasing deployment of advanced metering infrastructure (AMI) and demand response programs further underpins the growth of this segment, as they allow for more precise energy usage tracking and better consumer engagement. Additionally, as more utilities become aware of the potential for smart technologies to bolster grid resilience and sustainability, investments in these solutions are anticipated to rise. This growing focus on modernization and efficiency solidifies the smart grid segment's critical role in the future landscape of the electric transmission and distribution market, positioning it as a key driver for innovation and improved service delivery.

  • Utilities Segment Holds a Significant Share

The utilities segment is anticipated to occupy a substantial share of the electric transmission and distribution market, primarily due to its essential role in the delivery of electricity. Utilities are tasked with the crucial responsibilities of maintaining and upgrading the transmission and distribution infrastructure, ensuring a reliable power supply for residential, commercial, and industrial consumers. As global electricity demand escalates, utilities are making significant investments in modernizing their networks, which includes adopting smart technologies that enhance efficiency and responsiveness. This modernization effort often involves integrating renewable energy sources, enabling utilities to create a more resilient and sustainable energy grid. Moreover, the increasing complexity of energy demands—driven by factors such as urbanization, population growth, and the shift towards decentralized energy production—further underscores the need for robust utility infrastructure. As utilities focus on developing infrastructure that can accommodate these changes, their pivotal role becomes even more pronounced, positioning the utilities segment as a key driver of market growth. This commitment ensures that electricity remains accessible, reliable, and adaptable to future energy needs, reinforcing the importance of utilities in the overall transmission and distribution landscape.

Regional Analysis

North America is poised to maintain a leading position in the global electricity transmission and distribution market, primarily due to its well-established infrastructure and substantial investments in modernization efforts. The region's high levels of electricity consumption, combined with aging transmission and distribution networks, create a pressing need for upgrades and enhancements to ensure reliable power delivery. As utilities grapple with these challenges, the increasing integration of renewable energy sources—such as wind and solar—into the grid has become a pivotal factor driving investments in new transmission lines and smart grid technologies. These advancements not only enhance grid reliability but also facilitate the efficient management of variable energy sources. Additionally, government initiatives aimed at promoting energy efficiency, sustainability, and resilience are further fueling market growth in North America. Policies that encourage the adoption of smart technologies, demand response programs, and energy storage solutions are reinforcing the region's commitment to a modernized energy landscape. As a result, North America's proactive approach to infrastructure investment and innovative technologies positions it as a crucial player in shaping the future of electric transmission and distribution, ultimately ensuring that energy remains accessible and reliable for all consumers.

Electricity Transmission and Distribution Market Table

To Learn More About This Report - Request a Free Sample Copy

Electricity Transmission and Distribution Market Competitive Landscape

The electricity transmission and distribution market features prominent players such as Siemens AG, General Electric, Schneider Electric, ABB Ltd., and Eaton Corporation. These companies focus on innovation, expanding their product portfolios, and forming strategic partnerships to enhance market presence. Additionally, emerging players are entering the market, fostering competition and driving advancements in technology. Research and development initiatives aimed at improving efficiency, safety, and sustainability are central to the competitive strategies of leading firms.

Here are ten major players in the global electricity transmission and distribution market

  • Siemens AG
  • General Electric
  • Schneider Electric
  • ABB Ltd.
  • Eaton Corporation
  • Hitachi Energy
  • Mitsubishi Electric
  • Honeywell International
  • Rockwell Automation
  • Terna Energy

Recent Developments

  1. In October 2024, Siemens AG announced a new partnership with regional utilities to deploy smart grid technologies aimed at enhancing grid resilience and integrating renewable energy sources. This initiative is expected to streamline operations and improve the reliability of electricity supply, thereby fostering market growth.
  2. In July 2024, ABB Ltd. unveiled its latest line of advanced transformers designed for enhanced efficiency in electric distribution networks. These transformers utilize cutting-edge materials and design techniques to minimize energy loss and improve overall system performance, contributing to the sustainability goals of utilities and advancing market innovation.


Frequently Asked Questions (FAQ) :

Q1. What are the driving factors for the Global Electricity Transmission and Distribution Market?

The global electric transmission and distribution market is driven by rising electricity demand due to population growth and urbanization, the integration of renewable energy sources, and technological advancements in smart grid solutions. These factors contribute to a pressing need for robust and efficient energy infrastructure to meet modern energy needs.

Q2. What are the restraining factors for the Global Electricity Transmission and Distribution Market?

Despite its growth potential, the electric transmission and distribution market faces challenges such as high implementation costs for advanced technologies, regulatory complexities that can delay project execution, and the need for significant investments in infrastructure. Additionally, competition from alternative energy sources may impact traditional utility operations.

Q3. Which segment is projected to hold the largest share in the Global Electricity Transmission and Distribution Market?

The smart grid technologies segment is projected to hold the largest share in the global electric transmission and distribution market, driven by increasing demand for improved grid efficiency and reliability. As utilities adopt advanced technologies for monitoring and management, the smart grid segment's prominence is expected to grow significantly.

Q4. Which region holds the largest share of the Global Electricity Transmission and Distribution Market?

North America is anticipated to hold the largest share of the global electric transmission and distribution market, bolstered by advanced infrastructure, high electricity consumption, and ongoing investments in modernization and renewable energy integration.

Q5. Which are the prominent players in the Global Electricity Transmission and Distribution Market?

Prominent players in the global electric transmission and distribution market include Siemens AG, General Electric, Schneider Electric, ABB Ltd., and Eaton Corporation. These companies are actively engaged in innovation and collaboration to advance technologies that enhance the efficiency and reliability of electric utilities.

1. EXECUTIVE SUMMARY

  • 1.1. Market Overview
  • 1.2. Key Findings
  • 1.3. Market Segmentation
  • 1.4. Competitive Landscape
  • 1.5. Challenges and Opportunities
  • 1.6. Future Outlook

2. MARKET INTRODUCTION

  • 2.1. Definition
  • 2.2. Scope of the study
    • 2.2.1. Research Objective
    • 2.2.2. Assumption
    • 2.2.3. Limitations

3. RESEARCH METHODOLOGY

  • 3.1. Overview
  • 3.2. Data Mining
  • 3.3. Secondary Research
  • 3.4. Primary Research
    • 3.4.1. Primary Interviews and Information Gathering Process
    • 3.4.2. Breakdown of Primary Respondents
  • 3.5. Forecasting Model
  • 3.6. Market Size Estimation
    • 3.6.1. Bottom-Up Approach
    • 3.6.2. Top-Down Approach
  • 3.7. Data Triangulation
  • 3.8. Validation

4. MARKET DYNAMICS

  • 4.1. Overview
  • 4.2. Drivers
  • 4.3. Restraints
  • 4.4. Opportunities

5. MARKET FACTOR ANALYSIS

  • 5.1. Value chain Analysis
  • 5.2. Porter's Five Forces Analysis
    • 5.2.1. Bargaining Power of Suppliers
    • 5.2.2. Bargaining Power of Buyers
    • 5.2.3. Threat of New Entrants
    • 5.2.4. Threat of Substitutes
    • 5.2.5. Intensity of Rivalry
  • 5.3. COVID-19 Impact Analysis
    • 5.3.1. Market Impact Analysis
    • 5.3.2. Regional Impact
    • 5.3.3. Opportunity and Threat Analysis

6. ELECTRICAL TRANSMISSION DISTRIBUTION MARKET, BY COMPONENT (USD BILLION)

  • 6.1. Transformers
  • 6.2. Switchgear
  • 6.3. Conductors
  • 6.4. Insulators
  • 6.5. Protective Equipment

7. ELECTRICAL TRANSMISSION DISTRIBUTION MARKET, BY APPLICATION (USD BILLION)

  • 7.1. Residential
  • 7.2. Commercial
  • 7.3. Industrial
  • 7.4. Utilities

8. ELECTRICAL TRANSMISSION DISTRIBUTION MARKET, BY VOLTAGE LEVEL (USD BILLION)

  • 8.1. Low Voltage
  • 8.2. Medium Voltage
  • 8.3. High Voltage

9. ELECTRICAL TRANSMISSION DISTRIBUTION MARKET, BY END USER (USD BILLION)

  • 9.1. Government
  • 9.2. Private Sector
  • 9.3. Utilities
  • 9.4. Industrial

10. ELECTRICAL TRANSMISSION DISTRIBUTION MARKET, BY REGIONAL (USD BILLION)

  • 10.1. North America
    • 10.1.1. US
    • 10.1.2. Canada
  • 10.2. Europe
    • 10.2.1. Germany
    • 10.2.2. UK
    • 10.2.3. France
    • 10.2.4. Russia
    • 10.2.5. Italy
    • 10.2.6. Spain
    • 10.2.7. Rest of Europe
  • 10.3. APAC
    • 10.3.1. China
    • 10.3.2. India
    • 10.3.3. Japan
    • 10.3.4. South Korea
    • 10.3.5. Malaysia
    • 10.3.6. Thailand
    • 10.3.7. Indonesia
    • 10.3.8. Rest of APAC
  • 10.4. South America
    • 10.4.1. Brazil
    • 10.4.2. Mexico
    • 10.4.3. Argentina
    • 10.4.4. Rest of South America
  • 10.5. MEA
    • 10.5.1. GCC Countries
    • 10.5.2. South Africa
    • 10.5.3. Rest of MEA

11. COMPETITIVE LANDSCAPE

  • 11.1. Overview
  • 11.2. Competitive Analysis
  • 11.3. Market share Analysis
  • 11.4. Major Growth Strategy in the Electrical Transmission Distribution Market
  • 11.5. Competitive Benchmarking
  • 11.6. Leading Players in Terms of Number of Developments in the Electrical Transmission Distribution Market
  • 11.7. Key developments and growth strategies
    • 11.7.1. New Product Launch/Service Deployment
    • 11.7.2. Merger & Acquisitions
    • 11.7.3. Joint Ventures
  • 11.8. Major Players Financial Matrix
    • 11.8.1. Sales and Operating Income
    • 11.8.2. Major Players R&D Expenditure. 2023

12. COMPANY PROFILES

  • 12.1. Mitsubishi Electric
    • 12.1.1. Financial Overview
    • 12.1.2. Products Offered
    • 12.1.3. Key Developments
    • 12.1.4. SWOT Analysis
    • 12.1.5. Key Strategies
  • 12.2. Nexans
    • 12.2.1. Financial Overview
    • 12.2.2. Products Offered
    • 12.2.3. Key Developments
    • 12.2.4. SWOT Analysis
    • 12.2.5. Key Strategies
  • 12.3. Kabelwerke Brugg
    • 12.3.1. Financial Overview
    • 12.3.2. Products Offered
    • 12.3.3. Key Developments
    • 12.3.4. SWOT Analysis
    • 12.3.5. Key Strategies
  • 12.4. Emerson Electric
    • 12.4.1. Financial Overview
    • 12.4.2. Products Offered
    • 12.4.3. Key Developments
    • 12.4.4. SWOT Analysis
    • 12.4.5. Key Strategies
  • 12.5. Toshiba
    • 12.5.1. Financial Overview
    • 12.5.2. Products Offered
    • 12.5.3. Key Developments
    • 12.5.4. SWOT Analysis
    • 12.5.5. Key Strategies
  • 12.6. S and C Electric Company
    • 12.6.1. Financial Overview
    • 12.6.2. Products Offered
    • 12.6.3. Key Developments
    • 12.6.4. SWOT Analysis
    • 12.6.5. Key Strategies
  • 12.7. Honeywell
    • 12.7.1. Financial Overview
    • 12.7.2. Products Offered
    • 12.7.3. Key Developments
    • 12.7.4. SWOT Analysis
    • 12.7.5. Key Strategies
  • 12.8. Eaton
    • 12.8.1. Financial Overview
    • 12.8.2. Products Offered
    • 12.8.3. Key Developments
    • 12.8.4. SWOT Analysis
    • 12.8.5. Key Strategies
  • 12.9. Siemens
    • 12.9.1. Financial Overview
    • 12.9.2. Products Offered
    • 12.9.3. Key Developments
    • 12.9.4. SWOT Analysis
    • 12.9.5. Key Strategies
  • 12.10. Cisco Systems
    • 12.10.1. Financial Overview
    • 12.10.2. Products Offered
    • 12.10.3. Key Developments
    • 12.10.4. SWOT Analysis
    • 12.10.5. Key Strategies
  • 12.11. General Electric
    • 12.11.1. Financial Overview
    • 12.11.2. Products Offered
    • 12.11.3. Key Developments
    • 12.11.4. SWOT Analysis
    • 12.11.5. Key Strategies
  • 12.12. Hitachi
    • 12.12.1. Financial Overview
    • 12.12.2. Products Offered
    • 12.12.3. Key Developments
    • 12.12.4. SWOT Analysis
    • 12.12.5. Key Strategies
  • 12.13. Schneider Electric
    • 12.13.1. Financial Overview
    • 12.13.2. Products Offered
    • 12.13.3. Key Developments
    • 12.13.4. SWOT Analysis
    • 12.13.5. Key Strategies
  • 12.14. ABB
    • 12.14.1. Financial Overview
    • 12.14.2. Products Offered
    • 12.14.3. Key Developments
    • 12.14.4. SWOT Analysis
    • 12.14.5. Key Strategies
  • 12.15. Rockwell Automation
    • 12.15.1. Financial Overview
    • 12.15.2. Products Offered
    • 12.15.3. Key Developments
    • 12.15.4. SWOT Analysis
    • 12.15.5. Key Strategies

13. APPENDIX

  • 13.1. References
FIGURE 1. MARKET SYNOPSIS
FIGURE 2. NORTH AMERICA ELECTRICAL TRANSMISSION DISTRIBUTION MARKET ANALYSIS
FIGURE 3. US ELECTRICAL TRANSMISSION DISTRIBUTION MARKET ANALYSIS BY COMPONENT
FIGURE 4. US ELECTRICAL TRANSMISSION DISTRIBUTION MARKET ANALYSIS BY APPLICATION
FIGURE 5. US ELECTRICAL TRANSMISSION DISTRIBUTION MARKET ANALYSIS BY VOLTAGE LEVEL
FIGURE 6. US ELECTRICAL TRANSMISSION DISTRIBUTION MARKET ANALYSIS BY END USER
FIGURE 7. US ELECTRICAL TRANSMISSION DISTRIBUTION MARKET ANALYSIS BY REGIONAL
FIGURE 8. CANADA ELECTRICAL TRANSMISSION DISTRIBUTION MARKET ANALYSIS BY COMPONENT
FIGURE 9. CANADA ELECTRICAL TRANSMISSION DISTRIBUTION MARKET ANALYSIS BY APPLICATION
FIGURE 10. CANADA ELECTRICAL TRANSMISSION DISTRIBUTION MARKET ANALYSIS BY VOLTAGE LEVEL
FIGURE 11. CANADA ELECTRICAL TRANSMISSION DISTRIBUTION MARKET ANALYSIS BY END USER
FIGURE 12. CANADA ELECTRICAL TRANSMISSION DISTRIBUTION MARKET ANALYSIS BY REGIONAL
FIGURE 13. EUROPE ELECTRICAL TRANSMISSION DISTRIBUTION MARKET ANALYSIS
FIGURE 14. GERMANY ELECTRICAL TRANSMISSION DISTRIBUTION MARKET ANALYSIS BY COMPONENT
FIGURE 15. GERMANY ELECTRICAL TRANSMISSION DISTRIBUTION MARKET ANALYSIS BY APPLICATION
FIGURE 16. GERMANY ELECTRICAL TRANSMISSION DISTRIBUTION MARKET ANALYSIS BY VOLTAGE LEVEL
FIGURE 17. GERMANY ELECTRICAL TRANSMISSION DISTRIBUTION MARKET ANALYSIS BY END USER
FIGURE 18. GERMANY ELECTRICAL TRANSMISSION DISTRIBUTION MARKET ANALYSIS BY REGIONAL
FIGURE 19. UK ELECTRICAL TRANSMISSION DISTRIBUTION MARKET ANALYSIS BY COMPONENT
FIGURE 20. UK ELECTRICAL TRANSMISSION DISTRIBUTION MARKET ANALYSIS BY APPLICATION
FIGURE 21. UK ELECTRICAL TRANSMISSION DISTRIBUTION MARKET ANALYSIS BY VOLTAGE LEVEL
FIGURE 22. UK ELECTRICAL TRANSMISSION DISTRIBUTION MARKET ANALYSIS BY END USER
FIGURE 23. UK ELECTRICAL TRANSMISSION DISTRIBUTION MARKET ANALYSIS BY REGIONAL
FIGURE 24. FRANCE ELECTRICAL TRANSMISSION DISTRIBUTION MARKET ANALYSIS BY COMPONENT
FIGURE 25. FRANCE ELECTRICAL TRANSMISSION DISTRIBUTION MARKET ANALYSIS BY APPLICATION
FIGURE 26. FRANCE ELECTRICAL TRANSMISSION DISTRIBUTION MARKET ANALYSIS BY VOLTAGE LEVEL
FIGURE 27. FRANCE ELECTRICAL TRANSMISSION DISTRIBUTION MARKET ANALYSIS BY END USER
FIGURE 28. FRANCE ELECTRICAL TRANSMISSION DISTRIBUTION MARKET ANALYSIS BY REGIONAL
FIGURE 29. RUSSIA ELECTRICAL TRANSMISSION DISTRIBUTION MARKET ANALYSIS BY COMPONENT
FIGURE 30. RUSSIA ELECTRICAL TRANSMISSION DISTRIBUTION MARKET ANALYSIS BY APPLICATION
FIGURE 31. RUSSIA ELECTRICAL TRANSMISSION DISTRIBUTION MARKET ANALYSIS BY VOLTAGE LEVEL
FIGURE 32. RUSSIA ELECTRICAL TRANSMISSION DISTRIBUTION MARKET ANALYSIS BY END USER
FIGURE 33. RUSSIA ELECTRICAL TRANSMISSION DISTRIBUTION MARKET ANALYSIS BY REGIONAL
FIGURE 34. ITALY ELECTRICAL TRANSMISSION DISTRIBUTION MARKET ANALYSIS BY COMPONENT
FIGURE 35. ITALY ELECTRICAL TRANSMISSION DISTRIBUTION MARKET ANALYSIS BY APPLICATION
FIGURE 36. ITALY ELECTRICAL TRANSMISSION DISTRIBUTION MARKET ANALYSIS BY VOLTAGE LEVEL
FIGURE 37. ITALY ELECTRICAL TRANSMISSION DISTRIBUTION MARKET ANALYSIS BY END USER
FIGURE 38. ITALY ELECTRICAL TRANSMISSION DISTRIBUTION MARKET ANALYSIS BY REGIONAL
FIGURE 39. SPAIN ELECTRICAL TRANSMISSION DISTRIBUTION MARKET ANALYSIS BY COMPONENT
FIGURE 40. SPAIN ELECTRICAL TRANSMISSION DISTRIBUTION MARKET ANALYSIS BY APPLICATION
FIGURE 41. SPAIN ELECTRICAL TRANSMISSION DISTRIBUTION MARKET ANALYSIS BY VOLTAGE LEVEL
FIGURE 42. SPAIN ELECTRICAL TRANSMISSION DISTRIBUTION MARKET ANALYSIS BY END USER
FIGURE 43. SPAIN ELECTRICAL TRANSMISSION DISTRIBUTION MARKET ANALYSIS BY REGIONAL
FIGURE 44. REST OF EUROPE ELECTRICAL TRANSMISSION DISTRIBUTION MARKET ANALYSIS BY COMPONENT
FIGURE 45. REST OF EUROPE ELECTRICAL TRANSMISSION DISTRIBUTION MARKET ANALYSIS BY APPLICATION
FIGURE 46. REST OF EUROPE ELECTRICAL TRANSMISSION DISTRIBUTION MARKET ANALYSIS BY VOLTAGE LEVEL
FIGURE 47. REST OF EUROPE ELECTRICAL TRANSMISSION DISTRIBUTION MARKET ANALYSIS BY END USER
FIGURE 48. REST OF EUROPE ELECTRICAL TRANSMISSION DISTRIBUTION MARKET ANALYSIS BY REGIONAL
FIGURE 49. APAC ELECTRICAL TRANSMISSION DISTRIBUTION MARKET ANALYSIS
FIGURE 50. CHINA ELECTRICAL TRANSMISSION DISTRIBUTION MARKET ANALYSIS BY COMPONENT
FIGURE 51. CHINA ELECTRICAL TRANSMISSION DISTRIBUTION MARKET ANALYSIS BY APPLICATION
FIGURE 52. CHINA ELECTRICAL TRANSMISSION DISTRIBUTION MARKET ANALYSIS BY VOLTAGE LEVEL
FIGURE 53. CHINA ELECTRICAL TRANSMISSION DISTRIBUTION MARKET ANALYSIS BY END USER
FIGURE 54. CHINA ELECTRICAL TRANSMISSION DISTRIBUTION MARKET ANALYSIS BY REGIONAL
FIGURE 55. INDIA ELECTRICAL TRANSMISSION DISTRIBUTION MARKET ANALYSIS BY COMPONENT
FIGURE 56. INDIA ELECTRICAL TRANSMISSION DISTRIBUTION MARKET ANALYSIS BY APPLICATION
FIGURE 57. INDIA ELECTRICAL TRANSMISSION DISTRIBUTION MARKET ANALYSIS BY VOLTAGE LEVEL
FIGURE 58. INDIA ELECTRICAL TRANSMISSION DISTRIBUTION MARKET ANALYSIS BY END USER
FIGURE 59. INDIA ELECTRICAL TRANSMISSION DISTRIBUTION MARKET ANALYSIS BY REGIONAL
FIGURE 60. JAPAN ELECTRICAL TRANSMISSION DISTRIBUTION MARKET ANALYSIS BY COMPONENT
FIGURE 61. JAPAN ELECTRICAL TRANSMISSION DISTRIBUTION MARKET ANALYSIS BY APPLICATION
FIGURE 62. JAPAN ELECTRICAL TRANSMISSION DISTRIBUTION MARKET ANALYSIS BY VOLTAGE LEVEL
FIGURE 63. JAPAN ELECTRICAL TRANSMISSION DISTRIBUTION MARKET ANALYSIS BY END USER
FIGURE 64. JAPAN ELECTRICAL TRANSMISSION DISTRIBUTION MARKET ANALYSIS BY REGIONAL
FIGURE 65. SOUTH KOREA ELECTRICAL TRANSMISSION DISTRIBUTION MARKET ANALYSIS BY COMPONENT
FIGURE 66. SOUTH KOREA ELECTRICAL TRANSMISSION DISTRIBUTION MARKET ANALYSIS BY APPLICATION
FIGURE 67. SOUTH KOREA ELECTRICAL TRANSMISSION DISTRIBUTION MARKET ANALYSIS BY VOLTAGE LEVEL
FIGURE 68. SOUTH KOREA ELECTRICAL TRANSMISSION DISTRIBUTION MARKET ANALYSIS BY END USER
FIGURE 69. SOUTH KOREA ELECTRICAL TRANSMISSION DISTRIBUTION MARKET ANALYSIS BY REGIONAL
FIGURE 70. MALAYSIA ELECTRICAL TRANSMISSION DISTRIBUTION MARKET ANALYSIS BY COMPONENT
FIGURE 71. MALAYSIA ELECTRICAL TRANSMISSION DISTRIBUTION MARKET ANALYSIS BY APPLICATION
FIGURE 72. MALAYSIA ELECTRICAL TRANSMISSION DISTRIBUTION MARKET ANALYSIS BY VOLTAGE LEVEL
FIGURE 73. MALAYSIA ELECTRICAL TRANSMISSION DISTRIBUTION MARKET ANALYSIS BY END USER
FIGURE 74. MALAYSIA ELECTRICAL TRANSMISSION DISTRIBUTION MARKET ANALYSIS BY REGIONAL
FIGURE 75. THAILAND ELECTRICAL TRANSMISSION DISTRIBUTION MARKET ANALYSIS BY COMPONENT
FIGURE 76. THAILAND ELECTRICAL TRANSMISSION DISTRIBUTION MARKET ANALYSIS BY APPLICATION
FIGURE 77. THAILAND ELECTRICAL TRANSMISSION DISTRIBUTION MARKET ANALYSIS BY VOLTAGE LEVEL
FIGURE 78. THAILAND ELECTRICAL TRANSMISSION DISTRIBUTION MARKET ANALYSIS BY END USER
FIGURE 79. THAILAND ELECTRICAL TRANSMISSION DISTRIBUTION MARKET ANALYSIS BY REGIONAL
FIGURE 80. INDONESIA ELECTRICAL TRANSMISSION DISTRIBUTION MARKET ANALYSIS BY COMPONENT
FIGURE 81. INDONESIA ELECTRICAL TRANSMISSION DISTRIBUTION MARKET ANALYSIS BY APPLICATION
FIGURE 82. INDONESIA ELECTRICAL TRANSMISSION DISTRIBUTION MARKET ANALYSIS BY VOLTAGE LEVEL
FIGURE 83. INDONESIA ELECTRICAL TRANSMISSION DISTRIBUTION MARKET ANALYSIS BY END USER
FIGURE 84. INDONESIA ELECTRICAL TRANSMISSION DISTRIBUTION MARKET ANALYSIS BY REGIONAL
FIGURE 85. REST OF APAC ELECTRICAL TRANSMISSION DISTRIBUTION MARKET ANALYSIS BY COMPONENT
FIGURE 86. REST OF APAC ELECTRICAL TRANSMISSION DISTRIBUTION MARKET ANALYSIS BY APPLICATION
FIGURE 87. REST OF APAC ELECTRICAL TRANSMISSION DISTRIBUTION MARKET ANALYSIS BY VOLTAGE LEVEL
FIGURE 88. REST OF APAC ELECTRICAL TRANSMISSION DISTRIBUTION MARKET ANALYSIS BY END USER
FIGURE 89. REST OF APAC ELECTRICAL TRANSMISSION DISTRIBUTION MARKET ANALYSIS BY REGIONAL
FIGURE 90. SOUTH AMERICA ELECTRICAL TRANSMISSION DISTRIBUTION MARKET ANALYSIS
FIGURE 91. BRAZIL ELECTRICAL TRANSMISSION DISTRIBUTION MARKET ANALYSIS BY COMPONENT
FIGURE 92. BRAZIL ELECTRICAL TRANSMISSION DISTRIBUTION MARKET ANALYSIS BY APPLICATION
FIGURE 93. BRAZIL ELECTRICAL TRANSMISSION DISTRIBUTION MARKET ANALYSIS BY VOLTAGE LEVEL
FIGURE 94. BRAZIL ELECTRICAL TRANSMISSION DISTRIBUTION MARKET ANALYSIS BY END USER
FIGURE 95. BRAZIL ELECTRICAL TRANSMISSION DISTRIBUTION MARKET ANALYSIS BY REGIONAL
FIGURE 96. MEXICO ELECTRICAL TRANSMISSION DISTRIBUTION MARKET ANALYSIS BY COMPONENT
FIGURE 97. MEXICO ELECTRICAL TRANSMISSION DISTRIBUTION MARKET ANALYSIS BY APPLICATION
FIGURE 98. MEXICO ELECTRICAL TRANSMISSION DISTRIBUTION MARKET ANALYSIS BY VOLTAGE LEVEL
FIGURE 99. MEXICO ELECTRICAL TRANSMISSION DISTRIBUTION MARKET ANALYSIS BY END USER
FIGURE 100. MEXICO ELECTRICAL TRANSMISSION DISTRIBUTION MARKET ANALYSIS BY REGIONAL
FIGURE 101. ARGENTINA ELECTRICAL TRANSMISSION DISTRIBUTION MARKET ANALYSIS BY COMPONENT
FIGURE 102. ARGENTINA ELECTRICAL TRANSMISSION DISTRIBUTION MARKET ANALYSIS BY APPLICATION
FIGURE 103. ARGENTINA ELECTRICAL TRANSMISSION DISTRIBUTION MARKET ANALYSIS BY VOLTAGE LEVEL
FIGURE 104. ARGENTINA ELECTRICAL TRANSMISSION DISTRIBUTION MARKET ANALYSIS BY END USER
FIGURE 105. ARGENTINA ELECTRICAL TRANSMISSION DISTRIBUTION MARKET ANALYSIS BY REGIONAL
FIGURE 106. REST OF SOUTH AMERICA ELECTRICAL TRANSMISSION DISTRIBUTION MARKET ANALYSIS BY COMPONENT
FIGURE 107. REST OF SOUTH AMERICA ELECTRICAL TRANSMISSION DISTRIBUTION MARKET ANALYSIS BY APPLICATION
FIGURE 108. REST OF SOUTH AMERICA ELECTRICAL TRANSMISSION DISTRIBUTION MARKET ANALYSIS BY VOLTAGE LEVEL
FIGURE 109. REST OF SOUTH AMERICA ELECTRICAL TRANSMISSION DISTRIBUTION MARKET ANALYSIS BY END USER
FIGURE 110. REST OF SOUTH AMERICA ELECTRICAL TRANSMISSION DISTRIBUTION MARKET ANALYSIS BY REGIONAL
FIGURE 111. MEA ELECTRICAL TRANSMISSION DISTRIBUTION MARKET ANALYSIS
FIGURE 112. GCC COUNTRIES ELECTRICAL TRANSMISSION DISTRIBUTION MARKET ANALYSIS BY COMPONENT
FIGURE 113. GCC COUNTRIES ELECTRICAL TRANSMISSION DISTRIBUTION MARKET ANALYSIS BY APPLICATION
FIGURE 114. GCC COUNTRIES ELECTRICAL TRANSMISSION DISTRIBUTION MARKET ANALYSIS BY VOLTAGE LEVEL
FIGURE 115. GCC COUNTRIES ELECTRICAL TRANSMISSION DISTRIBUTION MARKET ANALYSIS BY END USER
FIGURE 116. GCC COUNTRIES ELECTRICAL TRANSMISSION DISTRIBUTION MARKET ANALYSIS BY REGIONAL
FIGURE 117. SOUTH AFRICA ELECTRICAL TRANSMISSION DISTRIBUTION MARKET ANALYSIS BY COMPONENT
FIGURE 118. SOUTH AFRICA ELECTRICAL TRANSMISSION DISTRIBUTION MARKET ANALYSIS BY APPLICATION
FIGURE 119. SOUTH AFRICA ELECTRICAL TRANSMISSION DISTRIBUTION MARKET ANALYSIS BY VOLTAGE LEVEL
FIGURE 120. SOUTH AFRICA ELECTRICAL TRANSMISSION DISTRIBUTION MARKET ANALYSIS BY END USER
FIGURE 121. SOUTH AFRICA ELECTRICAL TRANSMISSION DISTRIBUTION MARKET ANALYSIS BY REGIONAL
FIGURE 122. REST OF MEA ELECTRICAL TRANSMISSION DISTRIBUTION MARKET ANALYSIS BY COMPONENT
FIGURE 123. REST OF MEA ELECTRICAL TRANSMISSION DISTRIBUTION MARKET ANALYSIS BY APPLICATION
FIGURE 124. REST OF MEA ELECTRICAL TRANSMISSION DISTRIBUTION MARKET ANALYSIS BY VOLTAGE LEVEL
FIGURE 125. REST OF MEA ELECTRICAL TRANSMISSION DISTRIBUTION MARKET ANALYSIS BY END USER
FIGURE 126. REST OF MEA ELECTRICAL TRANSMISSION DISTRIBUTION MARKET ANALYSIS BY REGIONAL
FIGURE 127. KEY BUYING CRITERIA OF ELECTRICAL TRANSMISSION DISTRIBUTION MARKET
FIGURE 128. RESEARCH PROCESS OF MRFR
FIGURE 129. DRO ANALYSIS OF ELECTRICAL TRANSMISSION DISTRIBUTION MARKET
FIGURE 130. DRIVERS IMPACT ANALYSIS: ELECTRICAL TRANSMISSION DISTRIBUTION MARKET
FIGURE 131. RESTRAINTS IMPACT ANALYSIS: ELECTRICAL TRANSMISSION DISTRIBUTION MARKET
FIGURE 132. SUPPLY / VALUE CHAIN: ELECTRICAL TRANSMISSION DISTRIBUTION MARKET
FIGURE 133. ELECTRICAL TRANSMISSION DISTRIBUTION MARKET, BY COMPONENT, 2024 (% SHARE)
FIGURE 134. ELECTRICAL TRANSMISSION DISTRIBUTION MARKET, BY COMPONENT, 2019 TO 2032 (USD Billions)
FIGURE 135. ELECTRICAL TRANSMISSION DISTRIBUTION MARKET, BY APPLICATION, 2024 (% SHARE)
FIGURE 136. ELECTRICAL TRANSMISSION DISTRIBUTION MARKET, BY APPLICATION, 2019 TO 2032 (USD Billions)
FIGURE 137. ELECTRICAL TRANSMISSION DISTRIBUTION MARKET, BY VOLTAGE LEVEL, 2024 (% SHARE)
FIGURE 138. ELECTRICAL TRANSMISSION DISTRIBUTION MARKET, BY VOLTAGE LEVEL, 2019 TO 2032 (USD Billions)
FIGURE 139. ELECTRICAL TRANSMISSION DISTRIBUTION MARKET, BY END USER, 2024 (% SHARE)
FIGURE 140. ELECTRICAL TRANSMISSION DISTRIBUTION MARKET, BY END USER, 2019 TO 2032 (USD Billions)
FIGURE 141. ELECTRICAL TRANSMISSION DISTRIBUTION MARKET, BY REGIONAL, 2024 (% SHARE)
FIGURE 142. ELECTRICAL TRANSMISSION DISTRIBUTION MARKET, BY REGIONAL, 2019 TO 2032 (USD Billions)
FIGURE 143. BENCHMARKING OF MAJOR COMPETITORS
Research Process

Data Library Research are conducted by industry experts who offer insight on industry structure, market segmentations technology assessment and competitive landscape (CL), and penetration, as well as on emerging trends. Their analysis is based on primary interviews (~ 80%) and secondary research (~ 20%) as well as years of professional expertise in their respective industries. Adding to this, by analysing historical trends and current market positions, our analysts predict where the market will be headed for the next five years. Furthermore, the varying trends of segment & categories geographically presented are also studied and the estimated based on the primary & secondary research.

In this particular report from the supply side Data Library Research has conducted primary surveys (interviews) with the key level executives (VP, CEO’s, Marketing Director, Business Development Manager and SOFT) of the companies that active & prominent as well as the midsized organization

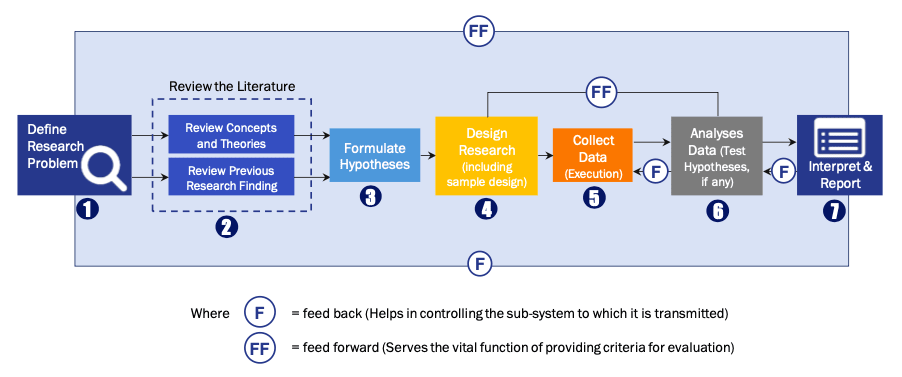
FIGURE 1: DLR RESEARH PROCESS

research-methodology1

Primary Research

Extensive primary research was conducted to gain a deeper insight of the market and industry performance. The analysis is based on both primary and secondary research as well as years of professional expertise in the respective industries.

In addition to analysing current and historical trends, our analysts predict where the market is headed over the next five years.

It varies by segment for these categories geographically presented in the list of market tables. Speaking about this particular report we have conducted primary surveys (interviews) with the key level executives (VP, CEO’s, Marketing Director, Business Development Manager and many more) of the major players active in the market.

Secondary Research

Secondary research was mainly used to collect and identify information useful for the extensive, technical, market-oriented, and Friend’s study of the Global Extra Neutral Alcohol. It was also used to obtain key information about major players, market classification and segmentation according to the industry trends, geographical markets, and developments related to the market and technology perspectives. For this study, analysts have gathered information from various credible sources, such as annual reports, sec filings, journals, white papers, SOFT presentations, and company web sites.

Market Size Estimation

Both, top-down and bottom-up approaches were used to estimate and validate the size of the Global market and to estimate the size of various other dependent submarkets in the overall Extra Neutral Alcohol. The key players in the market were identified through secondary research and their market contributions in the respective geographies were determined through primary and secondary research.

Forecast Model

research-methodology2

Happy to Assist You

If you have a question?

[email protected]

IND : +91 955 279 0357

Browse Related Reports