Fruit and Vegetable Powder Market Overview and Analysis

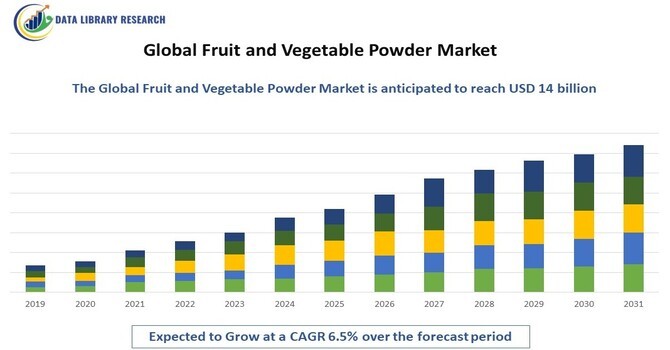
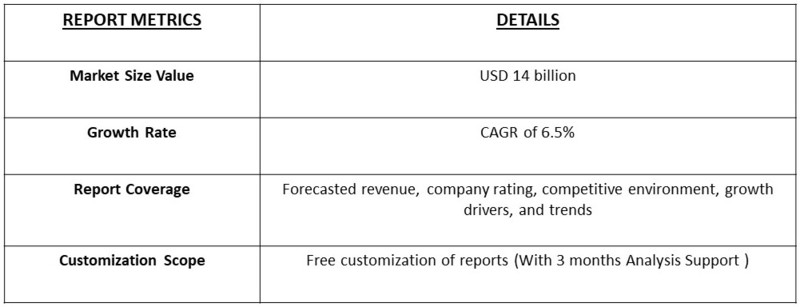
The global fruit and vegetable powder market was valued at approximately USD 8.5 billion in 2023 and is projected to reach around USD 14 billion by 2031, growing at a compound annual growth rate (CAGR) of about 6.5% during the forecast period.

Fruit and Vegetable Powder Market

Get Complete Analysis Of The Report - Download Free Sample PDF

The fruit and vegetable powder market refers to the production, processing, and distribution of dehydrated or powdered fruits and vegetables, which are used as ingredients in various food and beverage applications. These powders offer extended shelf life, ease of storage, and nutrient retention, making them popular in sectors such as functional foods, dietary supplements, and convenience food products. The market is driven by the growing demand for natural and clean-label ingredients, as well as the increasing consumer focus on health and wellness. Additionally, rising trends in plant-based diets and sustainable food production further support the growth of this market.

One of the key drivers of the fruit and vegetable powder market is the increasing consumer demand for healthy, natural, and clean-label ingredients. With rising health consciousness, consumers are actively seeking products that provide essential nutrients while avoiding artificial additives. The growing popularity of functional foods and beverages, which often incorporate fruit and vegetable powders for added nutritional value, is further fueling market growth. Additionally, the convenience and long shelf life of these powders make them ideal for use in packaged and ready-to-eat foods. As plant-based diets continue to gain traction globally, the demand for fruit and vegetable powders in various applications is expected to rise, driving further market expansion.

Fruit and Vegetable Powder Market Trends

Key trends in the fruit and vegetable powder market include the increasing incorporation of these powders in functional foods and beverages, driven by consumer interest in health and wellness. There is a growing demand for organic and clean-label products, with manufacturers focusing on natural ingredients that offer nutritional benefits without additives or preservatives. Additionally, the rise of plant-based diets is boosting the use of fruit and vegetable powders in plant-based snacks, protein supplements, and meal replacements. The market is also seeing innovation in powder processing techniques, such as freeze-drying and spray-drying, which enhance nutrient retention and flavor. Sustainable sourcing and eco-friendly packaging are emerging trends as companies respond to environmental concerns and consumer preferences for sustainable products.

Market Segmentation

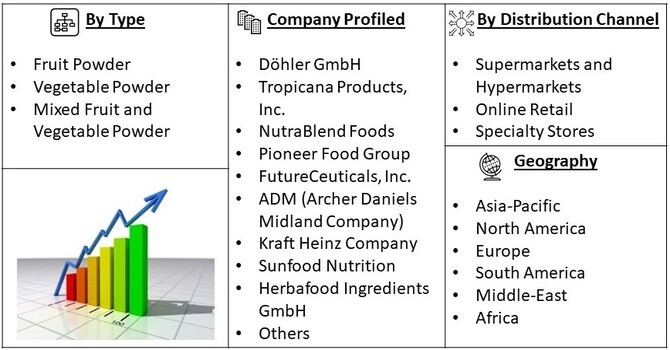
The Global Fruit and Vegetable Powder Market is segmented By Product Type (Fruit Powder, Vegetable Powder, Mixed Fruit and Vegetable Powder) By Distribution Channel (Supermarkets and Hypermarkets, Online Retail, Specialty Stores) and geography (Asia-Pacific, North America, Europe, South America, and Middle-East and Africa). The report offers the market size and forecasts for revenue (USD million) for all the above segments.

Fruit and Vegetable Powder Market Segment

For Detailed Market Segmentation - Get a Free Sample PDF

Market Drivers

  • Growing Consumer Focus on Health and Wellness

The increasing emphasis on health and wellness is a primary driver for the fruit and vegetable powder market. Consumers are becoming more health-conscious, prioritizing nutrient-dense, plant-based foods to maintain a healthy lifestyle. According to a 2023 survey by the International Food Information Council (IFIC), 60% of consumers are actively seeking food products that improve overall health and well-being. This shift in consumer behavior is driving demand for fruit and vegetable powders, which are rich in vitamins, minerals, and antioxidants. The growing popularity of functional foods and dietary supplements, which often incorporate these powders, is further accelerating market growth, particularly in developed regions like North America and Europe.

  • Rising Demand for Convenient, Long-Shelf-Life Products

The demand for convenient food solutions with extended shelf life is another significant driver for the fruit and vegetable powder market. With the busy lifestyles of modern consumers, there is a growing preference for easy-to-use products that retain nutritional value. Fruit and vegetable powders meet this need by offering concentrated nutrients in a format that can be easily added to meals, snacks, and beverages. In the wake of the COVID-19 pandemic, the demand for long-lasting, non-perishable foods has surged, with Euromonitor International reporting a 20% rise in sales of powdered food products in 2023. This trend is particularly strong in urban areas, where convenience and shelf-stable nutrition are top priorities for consumers. 

Fruit and Vegetable Powder Market Restraints

One of the key restraints in the fruit and vegetable powder market is the high cost of production, primarily due to the expensive drying technologies and the limited availability of quality raw materials. Advanced methods like freeze-drying and spray-drying, while effective in preserving nutrients and flavor, significantly raise production costs, which can be a barrier to scalability, especially for small and medium enterprises. Additionally, seasonal fluctuations and supply chain disruptions—such as those experienced during the COVID-19 pandemic—affect the consistent availability of fresh fruits and vegetables for processing. For instance, in 2023, adverse weather conditions in major agricultural regions led to a 15% reduction in fresh fruit supply in Europe, increasing costs for powder manufacturers. These factors collectively restrict the ability of producers to meet growing consumer demand at competitive prices, particularly in price-sensitive markets.

COVID-19 Impact On Fruit and Vegetable Powder Market

The COVID-19 pandemic had a mixed impact on the fruit and vegetable powder market. Initially, supply chain disruptions and labor shortages affected the availability of fresh produce, leading to challenges in raw material sourcing for powder manufacturers. However, the demand for long-shelf-life products surged as consumers stocked up on non-perishable, nutritious food items during lockdowns. The market also benefited from increased health consciousness, with a rise in demand for immune-boosting and nutrient-rich foods. E-commerce sales of fruit and vegetable powders saw significant growth as more consumers shifted to online shopping. Post-pandemic, the market continues to expand, driven by sustained interest in health and wellness trends and the convenience of shelf-stable, natural food ingredients.

Segmental Analysis

  • Organic Segment is Expected to Witness Significant Growth Over the Forecast Period

The organic sub-segment of the fruit and vegetable powder market is experiencing robust growth, driven by increasing consumer demand for clean-label and chemical-free products. Organic powders, sourced from fruits and vegetables grown without synthetic pesticides or fertilizers, are highly sought after by health-conscious consumers who prioritize sustainability and food safety. According to a 2023 Organic Trade Association report, sales of organic food products, including powders, increased by 12% globally, reflecting the growing preference for natural ingredients. This trend is particularly strong in regions like North America and Europe, where consumers are willing to pay a premium for organic certification. Driving factors for this segment include stricter regulations on chemical use in agriculture and a global shift toward more sustainable farming practices. Companies are also launching innovative organic powder blends to cater to this expanding market, boosting the segment’s growth.

  • Food and Beverages Segment is Expected to Witness Significant Growth Over the Forecast Period

The food and beverages sub-segment holds a significant share of the fruit and vegetable powder market, fueled by the rising demand for functional and natural ingredients in processed foods. Fruit and vegetable powders are increasingly used in smoothies, snacks, soups, and beverages to enhance nutritional value without compromising flavor or shelf life. In 2023, leading companies such as Nestlé and PepsiCo introduced new product lines featuring these powders, capitalizing on the clean-label and plant-based food trends. The convenience and health benefits offered by these powders are key driving factors, especially in urban areas where consumers seek nutrient-dense, easy-to-prepare food options. The growing interest in plant-based diets and the use of these powders in innovative products like protein bars and functional beverages are expected to further accelerate demand in this segment.

  • Asia Pacific Region is Expected to Witness Significant Growth Over the Forecast Period

The Asia-Pacific region is expected to witness significant growth in the fruit and vegetable powder market over the forecast period, driven by increasing health awareness and a growing preference for natural and plant-based products. Countries such as China, India, and Japan are experiencing rising demand for functional foods and beverages, where fruit and vegetable powders are widely used for their nutritional benefits. The expanding middle class, rapid urbanization, and increased consumer spending on health and wellness products are key growth drivers in this region. Additionally, the region's flourishing food processing industry and strong agricultural base provide ample opportunities for manufacturers to source raw materials locally. Government initiatives promoting healthy eating habits and sustainable agriculture are also contributing to the market's expansion in the Asia-Pacific region.

Fruit and Vegetable Powder Market Table

To Learn More About This Report - Request a Free Sample Copy

Fruit and Vegetable Powder Market Competitive Landscape

The competitive landscape of the fruit and vegetable powder market is characterized by a mix of established players and emerging companies focused on innovation and product differentiation. Key competitors are leveraging advancements in processing technologies and expanding their product portfolios to meet the increasing consumer demand for health-oriented ingredients. Major companies are also emphasizing sustainability and clean-label practices to enhance their market presence.

In addition to innovation and sustainability, the fruit and vegetable powder market is witnessing a significant shift toward organic and natural products, driven by growing consumer awareness about health and wellness. Companies are investing in sourcing high-quality, organic raw materials and developing powders that retain the nutritional benefits of fresh produce. This trend is further supported by strategic partnerships with local farmers and suppliers to ensure a consistent supply chain and improve product traceability. As consumers increasingly prioritize transparency in food sourcing, businesses that adopt ethical practices and promote their health benefits are likely to gain a competitive advantage in this evolving market landscape.

Prominent players in the fruit and vegetable powder market include

  • Döhler GmbH
  • Tropicana Products, Inc.
  • NutraBlend Foods
  • Pioneer Food Group
  • FutureCeuticals, Inc.
  • ADM (Archer Daniels Midland Company)
  • Kraft Heinz Company
  • Sunfood Nutrition
  • Herbafood Ingredients GmbH
  • Hunan Huachang Food Co., Ltd.
  • Xuzhou Fenghe Food Co., Ltd.
  • Shandong Tianli Agribusiness Co., Ltd.
  • Zhejiang Huilong Food Co., Ltd.

Recent Development

  1. In 2023, Döhler GmbH announced the expansion of its fruit and vegetable powder product range, focusing on organic and functional powders that cater to the growing health and wellness trends. The new line includes a variety of powders sourced from exotic fruits and vegetables, aimed at both food and beverage manufacturers and the dietary supplement sector. This strategic move not only enhances Döhler's market position but also aligns with the increasing consumer preference for clean-label, nutrient-rich ingredients. The company's commitment to sustainable sourcing and production processes further strengthens its brand image in the competitive landscape of fruit and vegetable powders.
  2. In early 2024, Archer Daniels Midland Company (ADM) announced a significant investment in its production facilities dedicated to fruit and vegetable powders, with a focus on sustainability and innovation. The investment aims to enhance the efficiency of its processing methods while reducing waste and energy consumption. ADM's initiative includes the adoption of new technologies that improve nutrient retention during the drying process, thereby delivering higher-quality powders to the market. This development not only reinforces ADM's commitment to environmental sustainability but also positions the company to better meet the rising demand for health-focused products among consumers and food manufacturers alike.


Frequently Asked Questions (FAQ) :

Q1. What are the driving factors for the Global Fruit and vegetable powder Market?

The global fruit and vegetable powder market is driven by rising health consciousness among consumers, leading to increased demand for natural and nutritious ingredients. Additionally, the growing trend of clean-label products and the convenience of powdered forms for use in various applications, such as food and beverages, contribute to market expansion.

Q2. What are the restraining factors for the Global Fruit and vegetable powder market?

Challenges such as high production costs and potential issues related to the shelf life and stability of powdered products can restrain market growth. Furthermore, competition from fresh produce and other alternative ingredients may also limit the adoption of fruit and vegetable powders.

Q3. Which segment is projected to hold the largest share of the Global Fruit and vegetable powder market?

The organic segment is projected to hold the largest share of the global fruit and vegetable powder market, driven by increasing consumer preference for organic products that are perceived as healthier and more sustainable.

Q4. Which region holds the largest share of the Global Fruit and vegetable powder market?

North America holds the largest share of the global fruit and vegetable powder market, supported by a strong demand for health-oriented products and a well-established food processing industry that incorporates these ingredients.

Q5. Which are the prominent players in the Global Fruit and vegetable powder market?

Key players in the global fruit and vegetable powder market include Hindustan Foods Limited, Naturex (a part of Givaudan), Food Ingredient Solutions, and The Hain Celestial Group, Inc. These companies are recognized for their innovative product offerings, commitment to quality, and focus on sustainability, positioning them strongly in the competitive landscape.

1. EXECUTIVE SUMMARY

  • 1.1. Market Overview
  • 1.2. Key Findings
  • 1.3. Market Segmentation
  • 1.4. Competitive Landscape
  • 1.5. Challenges and Opportunities
  • 1.6. Future Outlook

2. MARKET INTRODUCTION

  • 2.1. Definition
  • 2.2. Scope of the study
    • 2.2.1. Research Objective
    • 2.2.2. Assumption
    • 2.2.3. Limitations

3. RESEARCH METHODOLOGY

  • 3.1. Overview
  • 3.2. Data Mining
  • 3.3. Secondary Research
  • 3.4. Primary Research
    • 3.4.1. Primary Interviews and Information Gathering Process
    • 3.4.2. Breakdown of Primary Respondents
  • 3.5. Forecasting Model
  • 3.6. Market Size Estimation
    • 3.6.1. Bottom-Up Approach
    • 3.6.2. Top-Down Approach
  • 3.7. Data Triangulation
  • 3.8. Validation

4. MARKET DYNAMICS

  • 4.1. Overview
  • 4.2. Drivers
  • 4.3. Restraints
  • 4.4. Opportunities

5. MARKET FACTOR ANALYSIS

  • 5.1. Value chain Analysis
  • 5.2. Porter's Five Forces Analysis
    • 5.2.1. Bargaining Power of Suppliers
    • 5.2.2. Bargaining Power of Buyers
    • 5.2.3. Threat of New Entrants
    • 5.2.4. Threat of Substitutes
    • 5.2.5. Intensity of Rivalry
  • 5.3. COVID-19 Impact Analysis
    • 5.3.1. Market Impact Analysis
    • 5.3.2. Regional Impact
    • 5.3.3. Opportunity and Threat Analysis

6. FRUIT AND VEGETABLE POWDER MARKET, BY FORM (USD BILLION)

  • 6.1. Fruit Pieces
  • 6.2. Vegetable Pieces
  • 6.3. Fruit and Vegetable Powder

7. FRUIT AND VEGETABLE POWDER MARKET, BY APPLICATION (USD BILLION)

  • 7.1. Food & Beverages
  • 7.2. Dietary Supplements
  • 7.3. Pharmaceuticals
  • 7.4. Cosmetics
  • 7.5. Others

8. FRUIT AND VEGETABLE POWDER MARKET, BY FUNCTION (USD BILLION)

  • 8.1. Coloring Agents
  • 8.2. Vitamins and Minerals
  • 8.3. Flavorings
  • 8.4. Antioxidants
  • 8.5. Others

9. FRUIT AND VEGETABLE POWDER MARKET, BY SOURCE (USD BILLION)

  • 9.1. Fruits
  • 9.2. Vegetables
  • 9.3. Herbs

10. FRUIT AND VEGETABLE POWDER MARKET, BY ORGANIC VS CONVENTIONAL (USD BILLION)

  • 10.1. Organic
  • 10.2. Conventional

11. FRUIT AND VEGETABLE POWDER MARKET, BY REGIONAL (USD BILLION)

  • 11.1. North America
    • 11.1.1. US
    • 11.1.2. Canada
  • 11.2. Europe
    • 11.2.1. Germany
    • 11.2.2. UK
    • 11.2.3. France
    • 11.2.4. Russia
    • 11.2.5. Italy
    • 11.2.6. Spain
    • 11.2.7. Rest of Europe
  • 11.3. APAC
    • 11.3.1. China
    • 11.3.2. India
    • 11.3.3. Japan
    • 11.3.4. South Korea
    • 11.3.5. Malaysia
    • 11.3.6. Thailand
    • 11.3.7. Indonesia
    • 11.3.8. Rest of APAC
  • 11.4. South America
    • 11.4.1. Brazil
    • 11.4.2. Mexico
    • 11.4.3. Argentina
    • 11.4.4. Rest of South America
  • 11.5. MEA
    • 11.5.1. GCC Countries
    • 11.5.2. South Africa
    • 11.5.3. Rest of MEA

12. COMPETITIVE LANDSCAPE

  • 12.1. Overview
  • 12.2. Competitive Analysis
  • 12.3. Market share Analysis
  • 12.4. Major Growth Strategy in the FRUIT AND VEGETABLE POWDER MARKET
  • 12.5. Competitive Benchmarking
  • 12.6. Leading Players in Terms of Number of Developments in the FRUIT AND VEGETABLE POWDER MARKET
  • 12.7. Key developments and growth strategies
    • 12.7.1. New Product Launch/Service Deployment
    • 12.7.2. Merger & Acquisitions
    • 12.7.3. Joint Ventures
  • 12.8. Major Players Financial Matrix
    • 12.8.1. Sales and Operating Income
    • 12.8.2. Major Players R&D Expenditure. 2023

13. COMPANY PROFILES

  • 13.1. Tate Lyle
    • 13.1.1. Financial Overview
    • 13.1.2. Products Offered
    • 13.1.3. Key Developments
    • 13.1.4. SWOT Analysis
    • 13.1.5. Key Strategies
  • 13.2. Kerry Group
    • 13.2.1. Financial Overview
    • 13.2.2. Products Offered
    • 13.2.3. Key Developments
    • 13.2.4. SWOT Analysis
    • 13.2.5. Key Strategies
  • 13.3. Savory Systems International Inc.
    • 13.3.1. Financial Overview
    • 13.3.2. Products Offered
    • 13.3.3. Key Developments
    • 13.3.4. SWOT Analysis
    • 13.3.5. Key Strategies
  • 13.4. Givaudan
    • 13.4.1. Financial Overview
    • 13.4.2. Products Offered
    • 13.4.3. Key Developments
    • 13.4.4. SWOT Analysis
    • 13.4.5. Key Strategies
  • 13.5. Archer Daniels Midland Company
    • 13.5.1. Financial Overview
    • 13.5.2. Products Offered
    • 13.5.3. Key Developments
    • 13.5.4. SWOT Analysis
    • 13.5.5. Key Strategies
  • 13.6. Cargill, Incorporated
    • 13.6.1. Financial Overview
    • 13.6.2. Products Offered
    • 13.6.3. Key Developments
    • 13.6.4. SWOT Analysis
    • 13.6.5. Key Strategies
  • 13.7. DSM
    • 13.7.1. Financial Overview
    • 13.7.2. Products Offered
    • 13.7.3. Key Developments
    • 13.7.4. SWOT Analysis
    • 13.7.5. Key Strategies
  • 13.8. Ingredion Incorporated
    • 13.8.1. Financial Overview
    • 13.8.2. Products Offered
    • 13.8.3. Key Developments
    • 13.8.4. SWOT Analysis
    • 13.8.5. Key Strategies
  • 13.9. Firmenich SA
    • 13.9.1. Financial Overview
    • 13.9.2. Products Offered
    • 13.9.3. Key Developments
    • 13.9.4. SWOT Analysis
    • 13.9.5. Key Strategies
  • 13.10. McCormick Company, Inc.
    • 13.10.1. Financial Overview
    • 13.10.2. Products Offered
    • 13.10.3. Key Developments
    • 13.10.4. SWOT Analysis
    • 13.10.5. Key Strategies
  • 13.11. Symrise AG
    • 13.11.1. Financial Overview
    • 13.11.2. Products Offered
    • 13.11.3. Key Developments
    • 13.11.4. SWOT Analysis
    • 13.11.5. Key Strategies
  • 13.12. Sensient Technologies Corporation
    • 13.12.1. Financial Overview
    • 13.12.2. Products Offered
    • 13.12.3. Key Developments
    • 13.12.4. SWOT Analysis
    • 13.12.5. Key Strategies
  • 13.13. Alps Alpine Co., Ltd.
    • 13.13.1. Financial Overview
    • 13.13.2. Products Offered
    • 13.13.3. Key Developments
    • 13.13.4. SWOT Analysis
    • 13.13.5. Key Strategies
  • 13.14. Takasago International Corporation
    • 13.14.1. Financial Overview
    • 13.14.2. Products Offered
    • 13.14.3. Key Developments
    • 13.14.4. SWOT Analysis
    • 13.14.5. Key Strategies

14. APPENDIX

  • 14.1. References
FIGURE 1. MARKET SYNOPSIS
FIGURE 2. NORTH AMERICA FRUIT AND VEGETABLE POWDER MARKET ANALYSIS
FIGURE 3. US FRUIT AND VEGETABLE POWDER MARKET ANALYSIS BY FORM
FIGURE 4. US FRUIT AND VEGETABLE POWDER MARKET ANALYSIS BY APPLICATION
FIGURE 5. US FRUIT AND VEGETABLE POWDER MARKET ANALYSIS BY FUNCTION
FIGURE 6. US FRUIT AND VEGETABLE POWDER MARKET ANALYSIS BY SOURCE
FIGURE 7. US FRUIT AND VEGETABLE POWDER MARKET ANALYSIS BY ORGANIC VS CONVENTIONAL
FIGURE 8. US FRUIT AND VEGETABLE POWDER MARKET ANALYSIS BY REGIONAL
FIGURE 9. CANADA FRUIT AND VEGETABLE POWDER MARKET ANALYSIS BY FORM
FIGURE 10. CANADA FRUIT AND VEGETABLE POWDER MARKET ANALYSIS BY APPLICATION
FIGURE 11. CANADA FRUIT AND VEGETABLE POWDER MARKET ANALYSIS BY FUNCTION
FIGURE 12. CANADA FRUIT AND VEGETABLE POWDER MARKET ANALYSIS BY SOURCE
FIGURE 13. CANADA FRUIT AND VEGETABLE POWDER MARKET ANALYSIS BY ORGANIC VS CONVENTIONAL
FIGURE 14. CANADA FRUIT AND VEGETABLE POWDER MARKET ANALYSIS BY REGIONAL
FIGURE 15. EUROPE FRUIT AND VEGETABLE POWDER MARKET ANALYSIS
FIGURE 16. GERMANY FRUIT AND VEGETABLE POWDER MARKET ANALYSIS BY FORM
FIGURE 17. GERMANY FRUIT AND VEGETABLE POWDER MARKET ANALYSIS BY APPLICATION
FIGURE 18. GERMANY FRUIT AND VEGETABLE POWDER MARKET ANALYSIS BY FUNCTION
FIGURE 19. GERMANY FRUIT AND VEGETABLE POWDER MARKET ANALYSIS BY SOURCE
FIGURE 20. GERMANY FRUIT AND VEGETABLE POWDER MARKET ANALYSIS BY ORGANIC VS CONVENTIONAL
FIGURE 21. GERMANY FRUIT AND VEGETABLE POWDER MARKET ANALYSIS BY REGIONAL
FIGURE 22. UK FRUIT AND VEGETABLE POWDER MARKET ANALYSIS BY FORM
FIGURE 23. UK FRUIT AND VEGETABLE POWDER MARKET ANALYSIS BY APPLICATION
FIGURE 24. UK FRUIT AND VEGETABLE POWDER MARKET ANALYSIS BY FUNCTION
FIGURE 25. UK FRUIT AND VEGETABLE POWDER MARKET ANALYSIS BY SOURCE
FIGURE 26. UK FRUIT AND VEGETABLE POWDER MARKET ANALYSIS BY ORGANIC VS CONVENTIONAL
FIGURE 27. UK FRUIT AND VEGETABLE POWDER MARKET ANALYSIS BY REGIONAL
FIGURE 28. FRANCE FRUIT AND VEGETABLE POWDER MARKET ANALYSIS BY FORM
FIGURE 29. FRANCE FRUIT AND VEGETABLE POWDER MARKET ANALYSIS BY APPLICATION
FIGURE 30. FRANCE FRUIT AND VEGETABLE POWDER MARKET ANALYSIS BY FUNCTION
FIGURE 31. FRANCE FRUIT AND VEGETABLE POWDER MARKET ANALYSIS BY SOURCE
FIGURE 32. FRANCE FRUIT AND VEGETABLE POWDER MARKET ANALYSIS BY ORGANIC VS CONVENTIONAL
FIGURE 33. FRANCE FRUIT AND VEGETABLE POWDER MARKET ANALYSIS BY REGIONAL
FIGURE 34. RUSSIA FRUIT AND VEGETABLE POWDER MARKET ANALYSIS BY FORM
FIGURE 35. RUSSIA FRUIT AND VEGETABLE POWDER MARKET ANALYSIS BY APPLICATION
FIGURE 36. RUSSIA FRUIT AND VEGETABLE POWDER MARKET ANALYSIS BY FUNCTION
FIGURE 37. RUSSIA FRUIT AND VEGETABLE POWDER MARKET ANALYSIS BY SOURCE
FIGURE 38. RUSSIA FRUIT AND VEGETABLE POWDER MARKET ANALYSIS BY ORGANIC VS CONVENTIONAL
FIGURE 39. RUSSIA FRUIT AND VEGETABLE POWDER MARKET ANALYSIS BY REGIONAL
FIGURE 40. ITALY FRUIT AND VEGETABLE POWDER MARKET ANALYSIS BY FORM
FIGURE 41. ITALY FRUIT AND VEGETABLE POWDER MARKET ANALYSIS BY APPLICATION
FIGURE 42. ITALY FRUIT AND VEGETABLE POWDER MARKET ANALYSIS BY FUNCTION
FIGURE 43. ITALY FRUIT AND VEGETABLE POWDER MARKET ANALYSIS BY SOURCE
FIGURE 44. ITALY FRUIT AND VEGETABLE POWDER MARKET ANALYSIS BY ORGANIC VS CONVENTIONAL
FIGURE 45. ITALY FRUIT AND VEGETABLE POWDER MARKET ANALYSIS BY REGIONAL
FIGURE 46. SPAIN FRUIT AND VEGETABLE POWDER MARKET ANALYSIS BY FORM
FIGURE 47. SPAIN FRUIT AND VEGETABLE POWDER MARKET ANALYSIS BY APPLICATION
FIGURE 48. SPAIN FRUIT AND VEGETABLE POWDER MARKET ANALYSIS BY FUNCTION
FIGURE 49. SPAIN FRUIT AND VEGETABLE POWDER MARKET ANALYSIS BY SOURCE
FIGURE 50. SPAIN FRUIT AND VEGETABLE POWDER MARKET ANALYSIS BY ORGANIC VS CONVENTIONAL
FIGURE 51. SPAIN FRUIT AND VEGETABLE POWDER MARKET ANALYSIS BY REGIONAL
FIGURE 52. REST OF EUROPE FRUIT AND VEGETABLE POWDER MARKET ANALYSIS BY FORM
FIGURE 53. REST OF EUROPE FRUIT AND VEGETABLE POWDER MARKET ANALYSIS BY APPLICATION
FIGURE 54. REST OF EUROPE FRUIT AND VEGETABLE POWDER MARKET ANALYSIS BY FUNCTION
FIGURE 55. REST OF EUROPE FRUIT AND VEGETABLE POWDER MARKET ANALYSIS BY SOURCE
FIGURE 56. REST OF EUROPE FRUIT AND VEGETABLE POWDER MARKET ANALYSIS BY ORGANIC VS CONVENTIONAL
FIGURE 57. REST OF EUROPE FRUIT AND VEGETABLE POWDER MARKET ANALYSIS BY REGIONAL
FIGURE 58. APAC FRUIT AND VEGETABLE POWDER MARKET ANALYSIS
FIGURE 59. CHINA FRUIT AND VEGETABLE POWDER MARKET ANALYSIS BY FORM
FIGURE 60. CHINA FRUIT AND VEGETABLE POWDER MARKET ANALYSIS BY APPLICATION
FIGURE 61. CHINA FRUIT AND VEGETABLE POWDER MARKET ANALYSIS BY FUNCTION
FIGURE 62. CHINA FRUIT AND VEGETABLE POWDER MARKET ANALYSIS BY SOURCE
FIGURE 63. CHINA FRUIT AND VEGETABLE POWDER MARKET ANALYSIS BY ORGANIC VS CONVENTIONAL
FIGURE 64. CHINA FRUIT AND VEGETABLE POWDER MARKET ANALYSIS BY REGIONAL
FIGURE 65. INDIA FRUIT AND VEGETABLE POWDER MARKET ANALYSIS BY FORM
FIGURE 66. INDIA FRUIT AND VEGETABLE POWDER MARKET ANALYSIS BY APPLICATION
FIGURE 67. INDIA FRUIT AND VEGETABLE POWDER MARKET ANALYSIS BY FUNCTION
FIGURE 68. INDIA FRUIT AND VEGETABLE POWDER MARKET ANALYSIS BY SOURCE
FIGURE 69. INDIA FRUIT AND VEGETABLE POWDER MARKET ANALYSIS BY ORGANIC VS CONVENTIONAL
FIGURE 70. INDIA FRUIT AND VEGETABLE POWDER MARKET ANALYSIS BY REGIONAL
FIGURE 71. JAPAN FRUIT AND VEGETABLE POWDER MARKET ANALYSIS BY FORM
FIGURE 72. JAPAN FRUIT AND VEGETABLE POWDER MARKET ANALYSIS BY APPLICATION
FIGURE 73. JAPAN FRUIT AND VEGETABLE POWDER MARKET ANALYSIS BY FUNCTION
FIGURE 74. JAPAN FRUIT AND VEGETABLE POWDER MARKET ANALYSIS BY SOURCE
FIGURE 75. JAPAN FRUIT AND VEGETABLE POWDER MARKET ANALYSIS BY ORGANIC VS CONVENTIONAL
FIGURE 76. JAPAN FRUIT AND VEGETABLE POWDER MARKET ANALYSIS BY REGIONAL
FIGURE 77. SOUTH KOREA FRUIT AND VEGETABLE POWDER MARKET ANALYSIS BY FORM
FIGURE 78. SOUTH KOREA FRUIT AND VEGETABLE POWDER MARKET ANALYSIS BY APPLICATION
FIGURE 79. SOUTH KOREA FRUIT AND VEGETABLE POWDER MARKET ANALYSIS BY FUNCTION
FIGURE 80. SOUTH KOREA FRUIT AND VEGETABLE POWDER MARKET ANALYSIS BY SOURCE
FIGURE 81. SOUTH KOREA FRUIT AND VEGETABLE POWDER MARKET ANALYSIS BY ORGANIC VS CONVENTIONAL
FIGURE 82. SOUTH KOREA FRUIT AND VEGETABLE POWDER MARKET ANALYSIS BY REGIONAL
FIGURE 83. MALAYSIA FRUIT AND VEGETABLE POWDER MARKET ANALYSIS BY FORM
FIGURE 84. MALAYSIA FRUIT AND VEGETABLE POWDER MARKET ANALYSIS BY APPLICATION
FIGURE 85. MALAYSIA FRUIT AND VEGETABLE POWDER MARKET ANALYSIS BY FUNCTION
FIGURE 86. MALAYSIA FRUIT AND VEGETABLE POWDER MARKET ANALYSIS BY SOURCE
FIGURE 87. MALAYSIA FRUIT AND VEGETABLE POWDER MARKET ANALYSIS BY ORGANIC VS CONVENTIONAL
FIGURE 88. MALAYSIA FRUIT AND VEGETABLE POWDER MARKET ANALYSIS BY REGIONAL
FIGURE 89. THAILAND FRUIT AND VEGETABLE POWDER MARKET ANALYSIS BY FORM
FIGURE 90. THAILAND FRUIT AND VEGETABLE POWDER MARKET ANALYSIS BY APPLICATION
FIGURE 91. THAILAND FRUIT AND VEGETABLE POWDER MARKET ANALYSIS BY FUNCTION
FIGURE 92. THAILAND FRUIT AND VEGETABLE POWDER MARKET ANALYSIS BY SOURCE
FIGURE 93. THAILAND FRUIT AND VEGETABLE POWDER MARKET ANALYSIS BY ORGANIC VS CONVENTIONAL
FIGURE 94. THAILAND FRUIT AND VEGETABLE POWDER MARKET ANALYSIS BY REGIONAL
FIGURE 95. INDONESIA FRUIT AND VEGETABLE POWDER MARKET ANALYSIS BY FORM
FIGURE 96. INDONESIA FRUIT AND VEGETABLE POWDER MARKET ANALYSIS BY APPLICATION
FIGURE 97. INDONESIA FRUIT AND VEGETABLE POWDER MARKET ANALYSIS BY FUNCTION
FIGURE 98. INDONESIA FRUIT AND VEGETABLE POWDER MARKET ANALYSIS BY SOURCE
FIGURE 99. INDONESIA FRUIT AND VEGETABLE POWDER MARKET ANALYSIS BY ORGANIC VS CONVENTIONAL
FIGURE 100. INDONESIA FRUIT AND VEGETABLE POWDER MARKET ANALYSIS BY REGIONAL
FIGURE 101. REST OF APAC FRUIT AND VEGETABLE POWDER MARKET ANALYSIS BY FORM
FIGURE 102. REST OF APAC FRUIT AND VEGETABLE POWDER MARKET ANALYSIS BY APPLICATION
FIGURE 103. REST OF APAC FRUIT AND VEGETABLE POWDER MARKET ANALYSIS BY FUNCTION
FIGURE 104. REST OF APAC FRUIT AND VEGETABLE POWDER MARKET ANALYSIS BY SOURCE
FIGURE 105. REST OF APAC FRUIT AND VEGETABLE POWDER MARKET ANALYSIS BY ORGANIC VS CONVENTIONAL
FIGURE 106. REST OF APAC FRUIT AND VEGETABLE POWDER MARKET ANALYSIS BY REGIONAL
FIGURE 107. SOUTH AMERICA FRUIT AND VEGETABLE POWDER MARKET ANALYSIS
FIGURE 108. BRAZIL FRUIT AND VEGETABLE POWDER MARKET ANALYSIS BY FORM
FIGURE 109. BRAZIL FRUIT AND VEGETABLE POWDER MARKET ANALYSIS BY APPLICATION
FIGURE 110. BRAZIL FRUIT AND VEGETABLE POWDER MARKET ANALYSIS BY FUNCTION
FIGURE 111. BRAZIL FRUIT AND VEGETABLE POWDER MARKET ANALYSIS BY SOURCE
FIGURE 112. BRAZIL FRUIT AND VEGETABLE POWDER MARKET ANALYSIS BY ORGANIC VS CONVENTIONAL
FIGURE 113. BRAZIL FRUIT AND VEGETABLE POWDER MARKET ANALYSIS BY REGIONAL
FIGURE 114. MEXICO FRUIT AND VEGETABLE POWDER MARKET ANALYSIS BY FORM
FIGURE 115. MEXICO FRUIT AND VEGETABLE POWDER MARKET ANALYSIS BY APPLICATION
FIGURE 116. MEXICO FRUIT AND VEGETABLE POWDER MARKET ANALYSIS BY FUNCTION
FIGURE 117. MEXICO FRUIT AND VEGETABLE POWDER MARKET ANALYSIS BY SOURCE
FIGURE 118. MEXICO FRUIT AND VEGETABLE POWDER MARKET ANALYSIS BY ORGANIC VS CONVENTIONAL
FIGURE 119. MEXICO FRUIT AND VEGETABLE POWDER MARKET ANALYSIS BY REGIONAL
FIGURE 120. ARGENTINA FRUIT AND VEGETABLE POWDER MARKET ANALYSIS BY FORM
FIGURE 121. ARGENTINA FRUIT AND VEGETABLE POWDER MARKET ANALYSIS BY APPLICATION
FIGURE 122. ARGENTINA FRUIT AND VEGETABLE POWDER MARKET ANALYSIS BY FUNCTION
FIGURE 123. ARGENTINA FRUIT AND VEGETABLE POWDER MARKET ANALYSIS BY SOURCE
FIGURE 124. ARGENTINA FRUIT AND VEGETABLE POWDER MARKET ANALYSIS BY ORGANIC VS CONVENTIONAL
FIGURE 125. ARGENTINA FRUIT AND VEGETABLE POWDER MARKET ANALYSIS BY REGIONAL
FIGURE 126. REST OF SOUTH AMERICA FRUIT AND VEGETABLE POWDER MARKET ANALYSIS BY FORM
FIGURE 127. REST OF SOUTH AMERICA FRUIT AND VEGETABLE POWDER MARKET ANALYSIS BY APPLICATION
FIGURE 128. REST OF SOUTH AMERICA FRUIT AND VEGETABLE POWDER MARKET ANALYSIS BY FUNCTION
FIGURE 129. REST OF SOUTH AMERICA FRUIT AND VEGETABLE POWDER MARKET ANALYSIS BY SOURCE
FIGURE 130. REST OF SOUTH AMERICA FRUIT AND VEGETABLE POWDER MARKET ANALYSIS BY ORGANIC VS CONVENTIONAL
FIGURE 131. REST OF SOUTH AMERICA FRUIT AND VEGETABLE POWDER MARKET ANALYSIS BY REGIONAL
FIGURE 132. MEA FRUIT AND VEGETABLE POWDER MARKET ANALYSIS
FIGURE 133. GCC COUNTRIES FRUIT AND VEGETABLE POWDER MARKET ANALYSIS BY FORM
FIGURE 134. GCC COUNTRIES FRUIT AND VEGETABLE POWDER MARKET ANALYSIS BY APPLICATION
FIGURE 135. GCC COUNTRIES FRUIT AND VEGETABLE POWDER MARKET ANALYSIS BY FUNCTION
FIGURE 136. GCC COUNTRIES FRUIT AND VEGETABLE POWDER MARKET ANALYSIS BY SOURCE
FIGURE 137. GCC COUNTRIES FRUIT AND VEGETABLE POWDER MARKET ANALYSIS BY ORGANIC VS CONVENTIONAL
FIGURE 138. GCC COUNTRIES FRUIT AND VEGETABLE POWDER MARKET ANALYSIS BY REGIONAL
FIGURE 139. SOUTH AFRICA FRUIT AND VEGETABLE POWDER MARKET ANALYSIS BY FORM
FIGURE 140. SOUTH AFRICA FRUIT AND VEGETABLE POWDER MARKET ANALYSIS BY APPLICATION
FIGURE 141. SOUTH AFRICA FRUIT AND VEGETABLE POWDER MARKET ANALYSIS BY FUNCTION
FIGURE 142. SOUTH AFRICA FRUIT AND VEGETABLE POWDER MARKET ANALYSIS BY SOURCE
FIGURE 143. SOUTH AFRICA FRUIT AND VEGETABLE POWDER MARKET ANALYSIS BY ORGANIC VS CONVENTIONAL
FIGURE 144. SOUTH AFRICA FRUIT AND VEGETABLE POWDER MARKET ANALYSIS BY REGIONAL
FIGURE 145. REST OF MEA FRUIT AND VEGETABLE POWDER MARKET ANALYSIS BY FORM
FIGURE 146. REST OF MEA FRUIT AND VEGETABLE POWDER MARKET ANALYSIS BY APPLICATION
FIGURE 147. REST OF MEA FRUIT AND VEGETABLE POWDER MARKET ANALYSIS BY FUNCTION
FIGURE 148. REST OF MEA FRUIT AND VEGETABLE POWDER MARKET ANALYSIS BY SOURCE
FIGURE 149. REST OF MEA FRUIT AND VEGETABLE POWDER MARKET ANALYSIS BY ORGANIC VS CONVENTIONAL
FIGURE 150. REST OF MEA FRUIT AND VEGETABLE POWDER MARKET ANALYSIS BY REGIONAL
FIGURE 151. KEY BUYING CRITERIA OF FRUIT AND VEGETABLE POWDER MARKET
FIGURE 152. RESEARCH PROCESS OF MRFR
FIGURE 153. DRO ANALYSIS OF FRUIT AND VEGETABLE POWDER MARKET
FIGURE 154. DRIVERS IMPACT ANALYSIS: FRUIT AND VEGETABLE POWDER MARKET
FIGURE 155. RESTRAINTS IMPACT ANALYSIS: FRUIT AND VEGETABLE POWDER MARKET
FIGURE 156. SUPPLY / VALUE CHAIN: FRUIT AND VEGETABLE POWDER MARKET
FIGURE 157. FRUIT AND VEGETABLE POWDER MARKET, BY FORM, 2024 (% SHARE)
FIGURE 158. FRUIT AND VEGETABLE POWDER MARKET, BY FORM, 2019 TO 2032 (USD Billions)
FIGURE 159. FRUIT AND VEGETABLE POWDER MARKET, BY APPLICATION, 2024 (% SHARE)
FIGURE 160. FRUIT AND VEGETABLE POWDER MARKET, BY APPLICATION, 2019 TO 2032 (USD Billions)
FIGURE 161. FRUIT AND VEGETABLE POWDER MARKET, BY FUNCTION, 2024 (% SHARE)
FIGURE 162. FRUIT AND VEGETABLE POWDER MARKET, BY FUNCTION, 2019 TO 2032 (USD Billions)
FIGURE 163. FRUIT AND VEGETABLE POWDER MARKET, BY SOURCE, 2024 (% SHARE)
FIGURE 164. FRUIT AND VEGETABLE POWDER MARKET, BY SOURCE, 2019 TO 2032 (USD Billions)
FIGURE 165. FRUIT AND VEGETABLE POWDER MARKET, BY ORGANIC VS CONVENTIONAL, 2024 (% SHARE)
FIGURE 166. FRUIT AND VEGETABLE POWDER MARKET, BY ORGANIC VS CONVENTIONAL, 2019 TO 2032 (USD Billions)
FIGURE 167. FRUIT AND VEGETABLE POWDER MARKET, BY REGIONAL, 2024 (% SHARE)
FIGURE 168. FRUIT AND VEGETABLE POWDER MARKET, BY REGIONAL, 2019 TO 2032 (USD Billions)
FIGURE 169. BENCHMARKING OF MAJOR COMPETITORS
Research Process

Data Library Research are conducted by industry experts who offer insight on industry structure, market segmentations technology assessment and competitive landscape (CL), and penetration, as well as on emerging trends. Their analysis is based on primary interviews (~ 80%) and secondary research (~ 20%) as well as years of professional expertise in their respective industries. Adding to this, by analysing historical trends and current market positions, our analysts predict where the market will be headed for the next five years. Furthermore, the varying trends of segment & categories geographically presented are also studied and the estimated based on the primary & secondary research.

In this particular report from the supply side Data Library Research has conducted primary surveys (interviews) with the key level executives (VP, CEO’s, Marketing Director, Business Development Manager and SOFT) of the companies that active & prominent as well as the midsized organization

FIGURE 1: DLR RESEARH PROCESS

research-methodology1

Primary Research

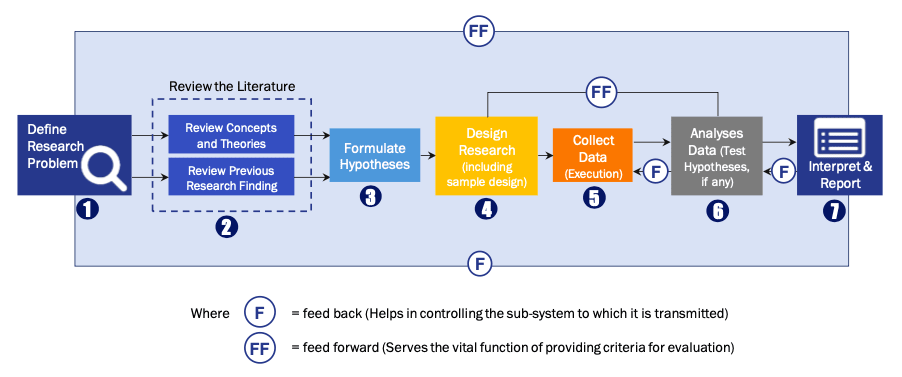
Extensive primary research was conducted to gain a deeper insight of the market and industry performance. The analysis is based on both primary and secondary research as well as years of professional expertise in the respective industries.

In addition to analysing current and historical trends, our analysts predict where the market is headed over the next five years.

It varies by segment for these categories geographically presented in the list of market tables. Speaking about this particular report we have conducted primary surveys (interviews) with the key level executives (VP, CEO’s, Marketing Director, Business Development Manager and many more) of the major players active in the market.

Secondary Research

Secondary research was mainly used to collect and identify information useful for the extensive, technical, market-oriented, and Friend’s study of the Global Extra Neutral Alcohol. It was also used to obtain key information about major players, market classification and segmentation according to the industry trends, geographical markets, and developments related to the market and technology perspectives. For this study, analysts have gathered information from various credible sources, such as annual reports, sec filings, journals, white papers, SOFT presentations, and company web sites.

Market Size Estimation

Both, top-down and bottom-up approaches were used to estimate and validate the size of the Global market and to estimate the size of various other dependent submarkets in the overall Extra Neutral Alcohol. The key players in the market were identified through secondary research and their market contributions in the respective geographies were determined through primary and secondary research.

Forecast Model

research-methodology2

Happy to Assist You

If you have a question?

[email protected]

IND : +91 955 279 0357

Browse Related Reports