Hardware in Loop (HIL) Market Overview and Analysis:

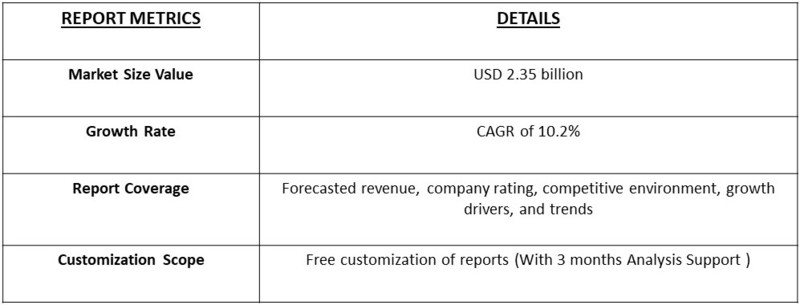
According to recent market research, the global hardware in loop (HIL) market is expected to reach a market value of USD 1.15 billion in 2023 and USD 2.35 billion in 2031, registering a Compound Annual Growth Rate (CAGR) of 10.2% during the forecast period.

Hardware in Loop (HIL) Market

Get Complete Analysis Of The Report - Download Free Sample PDF

The Hardware-in-the-Loop (HIL) market involves the development, deployment, and use of real-time simulation technology to test and validate hardware systems in industries like automotive, aerospace, defense, and energy. HIL systems allow engineers to simulate complex environments and scenarios, integrating actual hardware components for efficient, cost-effective testing without the need for full-scale prototypes. Market growth is driven by rising demand for advanced testing in autonomous vehicles, electric vehicles (EVs), and renewable energy systems. The HIL market is influenced by increasing automation, the need for faster development cycles, and the push for more reliable and accurate testing methods across industries.

The Hardware-in-the-Loop (HIL) market include the growing complexity of electronic systems in industries like automotive, aerospace, and defense, which require advanced testing and validation solutions. The shift towards autonomous driving, electric vehicles (EVs), and renewable energy systems has significantly increased demand for HIL testing to ensure safety, reliability, and performance. Additionally, the need for faster prototyping, reduced development costs, and real-time testing capabilities is pushing companies to adopt HIL solutions. The rise of Industry 4.0 and increasing automation across manufacturing processes further contribute to market growth.

Hardware-in-Loop (HIL) Market Trends:

The global hardware-in-loop (HIL) market is poised for significant growth, driven by the increasing demand for efficient and cost-effective testing solutions in various industries. The trend towards digitalization and automation is expected to continue, with HIL testing emerging as a key solution for ensuring the reliability and performance of complex systems. Additionally, the growing focus on safety and security is driving demand for HIL testing in critical applications such as aerospace and automotive. Furthermore, the increasing adoption of cloud-based testing solutions is expected to transform the HIL market, enabling greater flexibility and scalability.

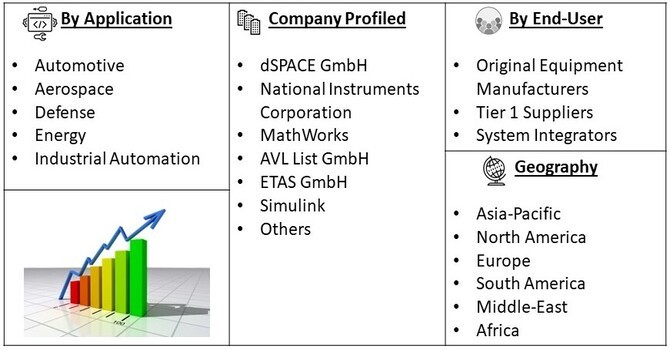
Market Segmentation: Hardware in-loop Market is segmented by technology by Application (Automotive, Aerospace, Defense, Energy, Industrial Automation) By End-User (Original Equipment Manufacturers, Tier 1 Suppliers, System Integrators) and geography (Asia-Pacific, North America, Europe, South America, and Middle-East and Africa). The report offers the market size and forecasts for revenue (USD million) for all the above segments.

Hardware in Loop (HIL) Market Segment

For Detailed Market Segmentation - Get a Free Sample PDF

Market Drivers:

Growing demand for efficient testing solutions

The global hardware-in-loop (HIL) market is being driven by the growing demand for efficient testing solutions in various industries. The increasing complexity of modern systems, combined with the need for reduced testing times and costs, is driving demand for HIL testing. For instance, the aerospace industry is increasingly adopting HIL testing to ensure the reliability and performance of complex systems, such as aircraft avionics and navigation systems. Additionally, the growing focus on digitalization and automation is also driving demand for HIL testing, as companies seek to optimize their testing processes and reduce costs. Furthermore, the increasing adoption of model-based testing and simulation is also expected to drive growth in the HIL market, as companies seek to reduce the need for physical prototypes and increase testing efficiency.

Growing adoption in automotive and industrial automation

The global hardware-in-loop (HIL) market is also being driven by the growing adoption of HIL testing in the automotive and industrial automation industries. The increasing complexity of modern vehicles, combined with the need for reduced testing times and costs, is driving demand for HIL testing. For instance, the automotive industry is increasingly adopting HIL testing to ensure the reliability and performance of complex systems, such as autonomous driving and advanced driver-assistance systems. Additionally, the growing focus on Industry 4.0 and the increasing adoption of automation and robotics is also driving demand for HIL testing in industrial automation. Furthermore, the increasing adoption of electric and hybrid vehicles is also expected to drive growth in the HIL market, as companies seek to ensure the reliability and performance of complex electrical systems.

Market Restraints:

Complexity and cost of implementation

The global hardware-in-loop (HIL) market is facing significant restraints due to the complexity and cost of implementation. HIL testing requires significant investment in hardware and software infrastructure, as well as specialized expertise and training. Additionally, the integration of HIL testing into existing testing processes can be time-consuming and costly, requiring significant changes to testing procedures and workflows. Furthermore, the need for high-performance computing and data storage solutions can also drive up costs and complexity. As a result, companies may be hesitant to adopt HIL testing, particularly in industries where testing budgets are limited. However, the benefits of HIL testing, including improved testing efficiency and reduced costs, are expected to drive growth in the market as companies become more aware of the value proposition.

COVID-19 Impact On Hardware-in-Loop (HIL) Market

The COVID-19 pandemic significantly impacted the Hardware-in-the-Loop (HIL) market by disrupting supply chains, delaying projects, and causing shifts in industry priorities. The initial phase of the pandemic saw a slowdown in the adoption and deployment of HIL systems due to reduced R&D activities and halted manufacturing processes. However, as industries adapted to remote work and accelerated digital transformation, the demand for HIL solutions increased to support virtual testing and development. The pandemic underscored the need for efficient, real-time simulation to manage complex systems remotely, driving growth in sectors like automotive and aerospace. Moving forward, the market is poised for recovery and expansion as companies continue to invest in advanced testing solutions to enhance system reliability and accelerate development cycles.

Segmental Analysis

Automotive Segment is Expected to Witness Significant Growth Over the Forecast Period

The automotive application of Hardware-in-the-Loop (HIL) systems has seen significant growth due to the industry's push towards autonomous driving and electric vehicles (EVs). HIL systems are increasingly used to test advanced driver-assistance systems (ADAS), automated driving features, and powertrain components in a controlled environment. Recent developments include the integration of HIL with over-the-air (OTA) updates and simulation platforms that mimic real-world driving conditions. This allows for extensive testing and validation of new technologies without the need for physical prototypes. Key drivers include the rapid advancements in automotive technology, stringent safety regulations, and the need for efficient, cost-effective testing solutions to accelerate vehicle development cycles.

Real-Time HIL Systems Segment is Expected to Witness Significant Growth Over the Forecast Period

Real-Time HIL systems are pivotal for industries requiring immediate feedback and high-fidelity simulation, such as aerospace and defense. These systems provide instantaneous responses to simulate complex environments, crucial for validating flight control systems, mission profiles, and defense technologies. Recent advancements include enhancements in processing power and simulation accuracy, enabling more detailed and realistic testing scenarios. For instance, aerospace companies are using real-time HIL to test autonomous flight systems and advanced avionics. Driving factors include the increasing complexity of aerospace systems, the demand for rapid prototyping, and the need for accurate, real-time testing to ensure system reliability and performance.

Asia Pacific Region is Expected to Witness Significant Growth Over the Forecast Period

 In the Asia-Pacific region, the automotive application of Hardware-in-the-Loop (HIL) systems is rapidly evolving, driven by the region's strong focus on innovation and technological advancement in the automotive sector. Countries like China, Japan, and South Korea are leading the charge with significant investments in electric vehicles (EVs) and autonomous driving technologies. Recent developments include the integration of HIL systems with advanced simulation platforms to test autonomous driving algorithms and EV powertrains under various real-world scenarios. For example, Japanese automakers are using HIL systems to validate ADAS features and ensure compliance with stringent safety standards. Key drivers include the region's booming automotive market, increasing regulatory pressures for safety and emissions, and the competitive push towards cutting-edge automotive technologies.

Hardware in Loop (HIL) Market Tab

To Learn More About This Report - Request a Free Sample Copy

Hardware-in-Loop (HIL) Market Competitive Landscape:

The Hardware-in-the-Loop (HIL) market is highly competitive, with several key players leading the field through innovation and strategic partnerships.

Major companies in this space include:

  • dSPACE GmbH
  • National Instruments Corporation
  • MathWorks
  • AVL List GmbH
  • ETAS GmbH
  • Simulink

Recent Development:

1) In 2023, dSPACE GmbH introduced a cutting-edge real-time simulation platform designed to enhance the testing and validation of autonomous driving systems. This new platform features improved processing power and increased flexibility, enabling automotive manufacturers to conduct more detailed and accurate simulations of vehicle dynamics and driver assistance technologies. The platform's advanced capabilities support complex scenarios, including those for electric and autonomous vehicles, thereby accelerating development cycles and ensuring higher safety and performance standards.

2) In 2024, National Instruments Corporation unveiled an upgraded Hardware-in-the-Loop (HIL) testing solution tailored for the aerospace industry. The new system integrates advanced hardware and software to support more rigorous testing of flight control systems and avionics. This development aims to address the growing complexity of aerospace systems and improve the accuracy of real-time simulations. The enhanced HIL solution allows for more precise validation of aerospace technologies, contributing to the development of next-generation aircraft and space exploration missions.


Frequently Asked Questions (FAQ) :

Q1. What are the driving factors for the Global Hardware in Loop Market?

The global Hardware-in-the-Loop (HIL) market is primarily driven by the increasing demand for advanced testing and simulation solutions across various industries, including automotive, aerospace, and defense. HIL systems are essential for validating complex systems and components in real-time, reducing development time and costs. The growing complexity of electronic systems and the need for efficient validation methods are propelling the adoption of HIL technology. Additionally, the rise in electric and autonomous vehicles, which require rigorous testing, further drives market growth. Technological advancements in HIL systems, including improved simulation capabilities and integration with other testing technologies, also contribute to the market’s expansion.

Q2. What are the restraining factors for the Global Hardware in Loop Market?

Despite its benefits, the HIL market faces several restraining factors. One major challenge is the high cost associated with implementing and maintaining HIL systems, which can be prohibitive for smaller organizations. The complexity of integrating HIL systems with existing workflows and technologies can also be a barrier. Additionally, the rapid pace of technological advancements requires continuous updates and upgrades to HIL systems, which can strain budgets and resources. The specialized nature of HIL systems means that skilled personnel are needed for operation and maintenance, adding to the operational costs and potential for market restraint.

Q3. Which segment is projected to hold the largest share in the Global Hardware in Loop Market?

The automotive segment is projected to hold the largest share in the global HIL market. This is due to the increasing complexity of automotive systems, including advanced driver-assistance systems (ADAS) and electric vehicles (EVs), which require rigorous testing and validation. HIL technology is crucial for evaluating the performance and safety of these systems under various conditions. The automotive industry's focus on innovation and compliance with stringent safety standards drives the demand for sophisticated HIL solutions, making this segment the largest in the market.

Q4. Which region holds the largest share in the Global Hardware in Loop Market?

North America currently holds the largest share in the global HIL market. The region's dominance is attributed to its advanced automotive and aerospace industries, which are major consumers of HIL technology for system testing and validation. The presence of key technology providers and a strong emphasis on research and development contribute to North America’s leading position. Additionally, government regulations and standards in North America often necessitate the use of HIL systems to ensure compliance, further bolstering the region’s market share.

Q5. Which are the prominent players in the Global Hardware in Loop Market?

Prominent players in the global HIL market include companies such as dSPACE GmbH, which is renowned for its comprehensive HIL testing solutions and simulation software. National Instruments Corporation is another key player, offering a wide range of HIL systems and testing solutions known for their flexibility and performance. Other notable companies include Vector Informatik GmbH, known for its automotive testing solutions, and ETAS GmbH, which provides HIL systems for various industry applications. These companies are pivotal in advancing HIL technology and meeting the growing demand for effective and reliable testing solutions.

Chapter 1. Methodology and Scope
  • 1.1. Market Segmentation and Scope
  • 1.2. Market Definitions
  • 1.3. Research Methodology
    • 1.3.1. Information Procurement
    • 1.3.2. Information or Data Analysis
    • 1.3.3. Market Formulation & Data Visualization
    • 1.3.4. Data Validation & Publishing
  • 1.4. Research Scope and Assumptions
    • 1.4.1. List of Data Sources
Chapter 2. Executive Summary
  • 2.1. Market Outlook
  • 2.2. Segment Outlook
  • 2.3. Competitive Landscape Outlook
Chapter 3. Hardware in the Loop Market Variables, Trends, & Scope
  • 3.1. Market Introduction/Lineage Outlook
  • 3.2. Industry Value Chain Analysis
  • 3.3. Market Dynamics
    • 3.3.1. Market Drivers Analysis
      • 3.3.1.1. The increasing adoption of automation is driving the demand for advancements in Hardware in the Loop technology.
      • 3.3.1.2. Growing Adoption of Electric Vehicles
      • 3.3.1.3. Increasing demand for realistic testing environments
    • 3.3.2. Market Restraints Analysis
      • 3.3.2.1. High Initial Costs
      • 3.3.2.2. Challenges with implementation and compatibility with existing hardware and software systems
    • 3.3.3. Industry Opportunities
      • 3.3.3.1. Integration with Augmented Reality and Artificial Intelligence
      • 3.3.3.2. Integration with Digital Twin Technology
  • 3.4. Hardware in the Loop Market Analysis Tools
    • 3.4.1. Porter’s Analysis
      • 3.4.1.1. Bargaining power of the suppliers
      • 3.4.1.2. Bargaining power of the buyers
      • 3.4.1.3. Threats of substitution
      • 3.4.1.4. Threats from new entrants
      • 3.4.1.5. Competitive rivalry
    • 3.4.2. PESTEL Analysis
      • 3.4.2.1. Political landscape
      • 3.4.2.2. Economic and Social landscape
      • 3.4.2.3. Technological landscape
      • 3.4.2.4. Environmental landscape
      • 3.4.2.5. Legal landscape
  • 3.5. Use Case Analysis
  • Chapter 4. Hardware in the Loop Market: Type Estimates & Trend Analysis
    • 4.1. Segment Dashboard
    • 4.2. Hardware in the Loop Market: Type Movement Analysis, 2023 & 2030 (USD Million)
    • 4.3. Open Loop HIL
      • 4.3.1. Open Loop HIL Market Revenue Estimates and Forecasts, 2017 - 2030 (USD Million)
    • 4.4. Closed Loop HIL
      • 4.4.1. Closed Loop HIL Market Revenue Estimates and Forecasts, 2017 - 2030 (USD Million)
    Chapter 5. Hardware in the Loop Market: Application Estimates & Trend Analysis
    • 5.1. Segment Dashboard
    • 5.2. Hardware in the Loop Market: Application Movement Analysis, 2023 & 2030 (USD Million)
    • 5.3. Automotive
      • 5.3.1. Automotive Market Revenue Estimates and Forecasts, 2017 - 2030 (USD Million)
    • 5.4. Aerospace & Defense
      • 5.4.1. Aerospace & Defense Market Revenue Estimates and Forecasts, 2017 - 2030 (USD Million)
    • 5.5. Electronics and Semiconductor
      • 5.5.1. Electronics and Semiconductor Market Revenue Estimates and Forecasts, 2017 - 2030 (USD Million)
    • 5.6. Industrial Equipment
      • 5.6.1. Industrial Equipment Market Revenue Estimates and Forecasts, 2017 - 2030 (USD Million)
    • 5.7. Research and Education
      • 5.7.1. Research and Education Market Revenue Estimates and Forecasts, 2017 - 2030 (USD Million)
    • 5.8. Energy and Power
      • 5.8.1. Energy and Power Market Revenue Estimates and Forecasts, 2017 - 2030 (USD Million)
    • 5.9. Others
      • 5.9.1. Others Market Revenue Estimates and Forecasts, 2017 - 2030 (USD Million)
    Chapter 6. Hardware in the Loop Market: Regional Estimates & Trend Analysis
    • 6.1. Hardware in the Loop Market Share, By Region, 2023 & 2030 (USD Million)
    • 6.2. North America
      • 6.2.1. North America Hardware in the Loop Market Estimates and Forecasts, 2017 - 2030 (USD Million)
      • 6.2.2. North America Hardware in the Loop Market Estimates and Forecasts, by Type, 2017 - 2030 (USD Million)
      • 6.2.3. North America Hardware in the Loop Market Estimates and Forecasts, By Application, 2017 - 2030 (USD Million)
      • 6.2.4. U.S.
        • 6.2.4.1. U.S. Hardware in the Loop Market Estimates and Forecasts, 2017 - 2030 (USD Million)
        • 6.2.4.2. U.S. Hardware in the Loop Market Estimates and Forecasts, by Type, 2017 - 2030 (USD Million)
        • 6.2.4.3. U.S. Hardware in the Loop Market Estimates and Forecasts, By Application, 2017 - 2030 (USD Million)
      • 6.2.5. Canada
        • 6.2.5.1. Canada Hardware in the Loop Market Estimates and Forecasts, 2017 - 2030 (USD Million)
        • 6.2.5.2. Canada Hardware in the Loop Market Estimates and Forecasts, by Type, 2017 - 2030 (USD Million)
        • 6.2.5.3. Canada Hardware in the Loop Market Estimates and Forecasts, By Application, 2017 - 2030 (USD Million)
  • 6.3. Europe
    • 6.3.1. Europe Hardware in the Loop Market Estimates and Forecasts, 2017 - 2030 (USD Million)
    • 6.3.2. Europe Hardware in the Loop Market Estimates and Forecasts, by Type, 2017 - 2030 (USD Million)
    • 6.3.3. Europe Hardware in the Loop Market Estimates and Forecasts, By Application, 2017 - 2030 (USD Million)
    • 6.3.4. U.K.
      • 6.3.4.1. U.K. Hardware in the Loop Market Estimates and Forecasts, 2017 - 2030 (USD Million)
      • 6.3.4.2. U.K. Hardware in the Loop Market Estimates and Forecasts, by Type, 2017 - 2030 (USD Million)
      • 6.3.4.3. U.K. Hardware in the Loop Market Estimates and Forecasts, By Application, 2017 - 2030 (USD Million)
    • 6.3.5. Germany
      • 6.3.5.1. Germany Hardware in the Loop Market Estimates and Forecasts, 2017 - 2030 (USD Million)
      • 6.3.5.2. Germany Hardware in the Loop Market Estimates and Forecasts, by Type, 2017 - 2030 (USD Million)
      • 6.3.5.3. Germany Hardware in the Loop Market Estimates and Forecasts, By Application, 2017 - 2030 (USD Million)
    • 6.3.6. France
      • 6.3.6.1. France Hardware in the Loop Market Estimates and Forecasts, 2017 - 2030 (USD Million)
      • 6.3.6.2. France Hardware in the Loop Market Estimates and Forecasts, by Type, 2017 - 2030 (USD Million)
      • 6.3.6.3. France Hardware in the Loop Market Estimates and Forecasts, By Application, 2017 - 2030 (USD Million)
  • 6.4. Asia Pacific
    • 6.4.1. Asia Pacific Hardware in the Loop Market Estimates and Forecasts, 2017 - 2030 (USD Million)
    • 6.4.2. Asia Pacific Hardware in the Loop Market Estimates and Forecasts, by Type, 2017 - 2030 (USD Million)
    • 6.4.3. Asia Pacific Hardware in the Loop Market Estimates and Forecasts, By Application, 2017 - 2030 (USD Million)
    • 6.4.4. China
      • 6.4.4.1. China Hardware in the Loop Market Estimates and Forecasts, 2017 - 2030 (USD Million)
      • 6.4.4.2. China Hardware in the Loop Market Estimates and Forecasts, by Type, 2017 - 2030 (USD Million)
      • 6.4.4.3. China Hardware in the Loop Market Estimates and Forecasts, By Application, 2017 - 2030 (USD Million)
    • 6.4.5. Japan
      • 6.4.5.1. Japan Hardware in the Loop Market Estimates and Forecasts, 2017 - 2030 (USD Million)
      • 6.4.5.2. Japan Hardware in the Loop Market Estimates and Forecasts, by Type, 2017 - 2030 (USD Million)
      • 6.4.5.3. Japan Hardware in the Loop Market Estimates and Forecasts, By Application, 2017 - 2030 (USD Million)
    • 6.4.6. India
      • 6.4.6.1. India Hardware in the Loop Market Estimates and Forecasts, 2017 - 2030 (USD Million)
      • 6.4.6.2. India Hardware in the Loop Market Estimates and Forecasts, by Type, 2017 - 2030 (USD Million)
      • 6.4.6.3. India Hardware in the Loop Market Estimates and Forecasts, By Application, 2017 - 2030 (USD Million)
    • 6.4.7. South Korea
      • 6.4.7.1. South Korea Hardware in the Loop Market Estimates and Forecasts, 2017 - 2030 (USD Million)
      • 6.4.7.2. South Korea Hardware in the Loop Market Estimates and Forecasts, by Type, 2017 - 2030 (USD Million)
      • 6.4.7.3. South Korea Hardware in the Loop Market Estimates and Forecasts, By Application, 2017 - 2030 (USD Million)
    • 6.4.8. Australia
      • 6.4.8.1. Australia Hardware in the Loop Market Estimates and Forecasts, 2017 - 2030 (USD Million)
      • 6.4.8.2. Australia Hardware in the Loop Market Estimates and Forecasts, by Type, 2017 - 2030 (USD Million)
      • 6.4.8.3. Australia Hardware in the Loop Market Estimates and Forecasts, By Application, 2017 - 2030 (USD Million)
  • 6.5. Latin America
    • 6.5.1. Latin America Hardware in the Loop Market Estimates and Forecasts, 2017 - 2030 (USD Million)
    • 6.5.2. Latin America Hardware in the Loop Market Estimates and Forecasts, by Type, 2017 - 2030 (USD Million)
    • 6.5.3. Latin America Hardware in the Loop Market Estimates and Forecasts, By Application, 2017 - 2030 (USD Million)
    • 6.5.4. Brazil
      • 6.5.4.1. Brazil Hardware in the Loop Market Estimates and Forecasts, 2017 - 2030 (USD Million)
      • 6.5.4.2. Brazil Hardware in the Loop Market Estimates and Forecasts, by Type, 2017 - 2030 (USD Million)
      • 6.5.4.3. Brazil Hardware in the Loop Market Estimates and Forecasts, By Application, 2017 - 2030 (USD Million)
    • 6.5.5. Mexico
      • 6.5.5.1. Mexico Hardware in the Loop Market Estimates and Forecasts, 2017 - 2030 (USD Million)
      • 6.5.5.2. Mexico Hardware in the Loop Market Estimates and Forecasts, by Type, 2017 - 2030 (USD Million)
      • 6.5.5.3. Mexico Hardware in the Loop Market Estimates and Forecasts, By Application, 2017 - 2030 (USD Million)
  • 6.6. Middle East and Africa
    • 6.6.1. Middle East and Africa Hardware in the Loop Market Estimates and Forecasts, 2017 - 2030 (USD Million)
    • 6.6.2. Middle East and Africa Hardware in the Loop Market Estimates and Forecasts, by Type, 2017 - 2030 (USD Million)
    • 6.6.3. Middle East and Africa Hardware in the Loop Market Estimates and Forecasts, By Application, 2017 - 2030 (USD Million)
    • 6.6.4. KSA
      • 6.6.4.1. KSA Hardware in the Loop Market Estimates and Forecasts, 2017 - 2030 (USD Million)
      • 6.6.4.2. KSA Hardware in the Loop Market Estimates and Forecasts, by Type, 2017 - 2030 (USD Million)
      • 6.6.4.3. KSA Hardware in the Loop Market Estimates and Forecasts, By Application, 2017 - 2030 (USD Million)
    • 6.6.5. UAE
      • 6.6.5.1. UAE Hardware in the Loop Market Estimates and Forecasts, 2017 - 2030 (USD Million)
      • 6.6.5.2. UAE Hardware in the Loop Market Estimates and Forecasts, by Type, 2017 - 2030 (USD Million)
      • 6.6.5.3. UAE Hardware in the Loop Market Estimates and Forecasts, By Application, 2017 - 2030 (USD Million)
    • 6.6.6. South Africa
      • 6.6.6.1. South Africa Hardware in the Loop Market Estimates and Forecasts, 2017 - 2030 (USD Million)
      • 6.6.6.2. South Africa Hardware in the Loop Market Estimates and Forecasts, by Type, 2017 - 2030 (USD Million)
      • 6.6.6.3. South Africa Hardware in the Loop Market Estimates and Forecasts, By Application, 2017 - 2030 (USD Million)
    Chapter 7. Competitive Landscape
    • 7.1. Recent Developments & Impact Analysis by Key Market Companies
    • 7.2. Company Categorization
    • 7.3. Company Market Positioning
    • 7.4. Company Market Share Analysis
    • 7.5. Strategy Mapping
      • 7.5.1. Expansion
      • 7.5.2. Mergers & Acquisition
      • 7.5.3. Partnerships & Collaborations
      • 7.5.4. New Product Launches
      • 7.5.5. Research And Development
    • 7.6. Company Profiles
      • 7.6.1. dSPACE GmbH
        • 7.6.1.1. Company Overview
        • 7.6.1.2. Financial Performance
        • 7.6.1.3. Product Benchmarking
        • 7.6.1.4. Recent Developments
      • 7.6.2. NATIONAL INSTRUMENTS CORP
        • 7.6.2.1. Company Overview
        • 7.6.2.2. Financial Performance
        • 7.6.2.3. Product Benchmarking
        • 7.6.2.4. Recent Developments
      • 7.6.3. Vector Informatik GmbH
        • 7.6.3.1. Company Overview
        • 7.6.3.2. Financial Performance
        • 7.6.3.3. Product Benchmarking
        • 7.6.3.4. Recent Developments
      • 7.6.4. Cognata
        • 7.6.4.1. Company Overview
        • 7.6.4.2. Financial Performance
        • 7.6.4.3. Product Benchmarking
        • 7.6.4.4. Recent Developments
      • 7.6.5. Siemens
        • 7.6.5.1. Company Overview
        • 7.6.5.2. Financial Performance
        • 7.6.5.3. Product Benchmarking
        • 7.6.5.4. Recent Developments
      • 7.6.6. MicroNova AG
        • 7.6.6.1. Company Overview
        • 7.6.6.2. Financial Performance
        • 7.6.6.3. Product Benchmarking
        • 7.6.6.4. Recent Developments
      • 7.6.7. Opal-RT Technologies
        • 7.6.7.1. Company Overview
        • 7.6.7.2. Financial Performance
        • 7.6.7.3. Product Benchmarking
        • 7.6.7.4. Recent Developments
      • 7.6.8. LHP Engineering Solutions
        • 7.6.8.1. Company Overview
        • 7.6.8.2. Financial Performance
        • 7.6.8.3. Product Benchmarking
        • 7.6.8.4. Recent Developments
      • 7.6.9. IPG Automotive GmbH
        • 7.6.9.1. Company Overview
        • 7.6.9.2. Financial Performance
        • 7.6.9.3. Product Benchmarking
        • 7.6.9.4. Recent Developments
      • 7.6.10. Typhoon HIL
        • 7.6.10.1. Company Overview
        • 7.6.10.2. Financial Performance
        • 7.6.10.3. Product Benchmarking
        • 7.6.10.4. Recent Developments
      • 7.6.11. Speedgoat GmbH
        • 7.6.11.1. Company Overview
        • 7.6.11.2. Financial Performance
        • 7.6.11.3. Product Benchmarking
        • 7.6.11.4. Recent Developments
      • 7.6.12. Eontronix
        • 7.6.12.1. Company Overview
        • 7.6.12.2. Financial Performance
        • 7.6.12.3. Product Benchmarking
        • 7.6.12.4. Recent Developments
      • 7.6.13. Wineman Technology
        • 7.6.13.1. Company Overview
        • 7.6.13.2. Financial Performance
        • 7.6.13.3. Product Benchmarking
        • 7.6.13.4. Recent Developments
      • 7.6.14. Modeling Tech
        • 7.6.14.1. Company Overview
        • 7.6.14.2. Financial Performance
        • 7.6.14.3. Product Benchmarking
        • 7.6.14.4. Recent Developments
      • 7.6.15. Robert Bosch GmbH
        • 7.6.15.1. Company Overview
        • 7.6.15.2. Financial Performance
        • 7.6.15.3. Product Benchmarking
  • Fig. 1 Hardware In The Loop Market Segmentation
    Fig. 2 Information Procurement
    Fig. 3 Data Analysis Models
    Fig. 4 Market Formulation And Validation
    Fig. 5 Data Validating & Publishing
    Fig. 6 Market Snapshot
    Fig. 7 Segment Snapshot, By Type And Application
    Fig. 8 Competitive Landscape Snapshot
    Fig. 9 Hardware In The Loop Market Value, 2017 - 2030 (USD Million)
    Fig. 10 Hardware In The Loop Market - Industry Value Chain Analysis
    Fig. 11 Hardware In The Loop Market - Market Trends
    Fig. 12 Hardware In The Loop Market: Porter’s Analysis
    Fig. 13 Hardware In The Loop Market: PESTEL Analysis
    Fig. 14 Hardware In The Loop Market, By Type: Key Takeaways
    Fig. 15 Hardware In The Loop Market, By Type: Market Share, 2023 & 2030
    Fig. 16 Open Loop HIL Hardware In The Loop Market Estimates & Forecasts, 2017 - 2030 (USD Million)
    Fig. 17 Closed Loop HIL Hardware In The Loop Market Estimates & Forecasts, 2017 - 2030 (USD Million)
    Fig. 18 Hardware In The Loop Market, By Application: Key Takeaways
    Fig. 19 Hardware In The Loop Market, By Application: Market Share, 2023 & 2030
    Fig. 20 Hardware In The Loop Market Estimates & Forecasts, 2017 - 2030 (USD Million)
    Fig. 21 Automotive Hardware In The Loop Market Estimates & Forecasts, 2017 - 2030 (USD Million)
    Fig. 22 Aerospace & Defense Hardware In The Loop Market Estimates & Forecasts, 2017 - 2030 (USD Million)
    Fig. 23 Electronics And Semiconductor Hardware In The Loop Market Estimates & Forecasts, 2017 - 2030 (USD Million)
    Fig. 24 Industrial Equipment Hardware In The Loop Market Estimates & Forecasts, 2017 - 2030 (USD Million)
    Fig. 25 Research And Education Hardware In The Loop Market Estimates & Forecasts, 2017 - 2030 (USD Million)
    Fig. 26 Energy And Power Hardware In The Loop Market Estimates & Forecasts, 2017 - 2030 (USD Million)
    Fig. 27 Others Hardware In The Loop Market Estimates & Forecasts, 2017 - 2030 (USD Million)
    Fig. 28 Global Hardware In The Loop Market Revenue, By Region, 2023 & 2030 (USD Million)
    Fig. 29 North America Hardware In The Loop Market Estimates & Forecasts, 2017 - 2030 (USD Million)
    Fig. 30 U.S. Hardware In The Loop Market Estimates & Forecasts, 2017 - 2030 (USD Million)
    Fig. 31 Canada Hardware In The Loop Market Estimates & Forecasts, 2017 - 2030 (USD Million)
    Fig. 32 Europe Hardware In The Loop Market Estimates & Forecasts, 2017 - 2030 (USD Million)
    Fig. 33 U.K. Hardware In The Loop Market Estimates & Forecasts, 2017 - 2030 (USD Million)
    Fig. 34 Germany Hardware In The Loop Market Estimates & Forecasts, 2017 - 2030 (USD Million)
    Fig. 35 France Hardware In The Loop Market Estimates & Forecasts, 2017 - 2030 (USD Million)
    Fig. 36 Asia Pacific Hardware In The Loop Market Estimates & Forecasts, 2017 - 2030 (USD Million)
    Fig. 37 China Hardware In The Loop Market Estimates & Forecasts, 2017 - 2030 (USD Million)
    Fig. 38 India Hardware In The Loop Market Estimates & Forecasts, 2017 - 2030 (USD Million)
    Fig. 39 Japan Hardware In The Loop Market Estimates & Forecasts, 2017 - 2030 (USD Million)
    Fig. 40 South Korea Hardware In The Loop Market Estimates & Forecasts, 2017 - 2030 (USD Million)
    Fig. 41 Australia Hardware In The Loop Market Estimates & Forecasts, 2017 - 2030 (USD Million)
    Fig. 42 Latin America Hardware In The Loop Market Estimates & Forecasts, 2017 - 2030 (USD Million)
    Fig. 43 Brazil Hardware In The Loop Market Estimates & Forecasts, 2017 - 2030 (USD Million)
    Fig. 44 Mexico Hardware In The Loop Market Estimates & Forecasts, 2017 - 2030 (USD Million)
    Fig. 45 Middle East & Africa Hardware In The Loop Market Estimates & Forecasts, 2017 - 2030 (USD Million)
    Fig. 46 KSA Hardware In The Loop Market Estimates & Forecasts, 2017 - 2030 (USD Million)
    Fig. 47 UAE Hardware In The Loop Market Estimates & Forecasts, 2017 - 2030 (USD Million)
    Fig. 48 South Africa Hardware In The Loop Market Estimates & Forecasts, 2017 - 2030 (USD Million)
    Fig. 49 Key Company Categorization
    Fig. 50 Hardware In The Loop Market - Key Company Market Share Analysis, 2023
    Fig. 51 Strategic Framework
    Research Process

    Data Library Research are conducted by industry experts who offer insight on industry structure, market segmentations technology assessment and competitive landscape (CL), and penetration, as well as on emerging trends. Their analysis is based on primary interviews (~ 80%) and secondary research (~ 20%) as well as years of professional expertise in their respective industries. Adding to this, by analysing historical trends and current market positions, our analysts predict where the market will be headed for the next five years. Furthermore, the varying trends of segment & categories geographically presented are also studied and the estimated based on the primary & secondary research.

    In this particular report from the supply side Data Library Research has conducted primary surveys (interviews) with the key level executives (VP, CEO’s, Marketing Director, Business Development Manager and SOFT) of the companies that active & prominent as well as the midsized organization

    FIGURE 1: DLR RESEARH PROCESS

    research-methodology1

    Primary Research

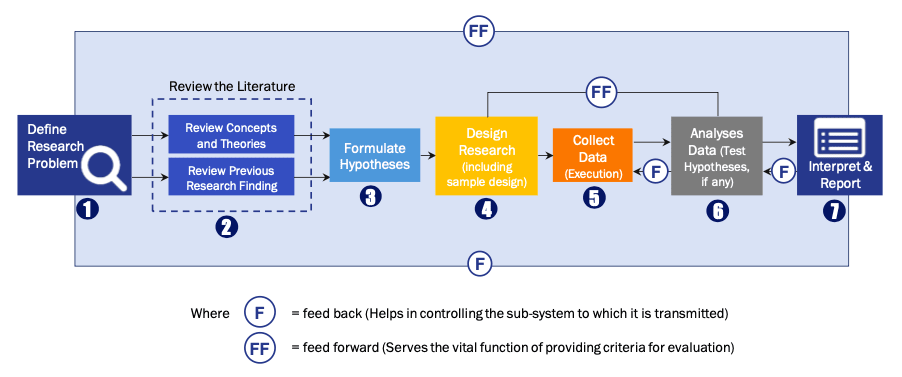
    Extensive primary research was conducted to gain a deeper insight of the market and industry performance. The analysis is based on both primary and secondary research as well as years of professional expertise in the respective industries.

    In addition to analysing current and historical trends, our analysts predict where the market is headed over the next five years.

    It varies by segment for these categories geographically presented in the list of market tables. Speaking about this particular report we have conducted primary surveys (interviews) with the key level executives (VP, CEO’s, Marketing Director, Business Development Manager and many more) of the major players active in the market.

    Secondary Research

    Secondary research was mainly used to collect and identify information useful for the extensive, technical, market-oriented, and Friend’s study of the Global Extra Neutral Alcohol. It was also used to obtain key information about major players, market classification and segmentation according to the industry trends, geographical markets, and developments related to the market and technology perspectives. For this study, analysts have gathered information from various credible sources, such as annual reports, sec filings, journals, white papers, SOFT presentations, and company web sites.

    Market Size Estimation

    Both, top-down and bottom-up approaches were used to estimate and validate the size of the Global market and to estimate the size of various other dependent submarkets in the overall Extra Neutral Alcohol. The key players in the market were identified through secondary research and their market contributions in the respective geographies were determined through primary and secondary research.

    Forecast Model

    research-methodology2

    Happy to Assist You

    If you have a question?

    [email protected]

    IND : +91 955 279 0357

    Browse Related Reports