Lighting Control Market Overview and Analysis

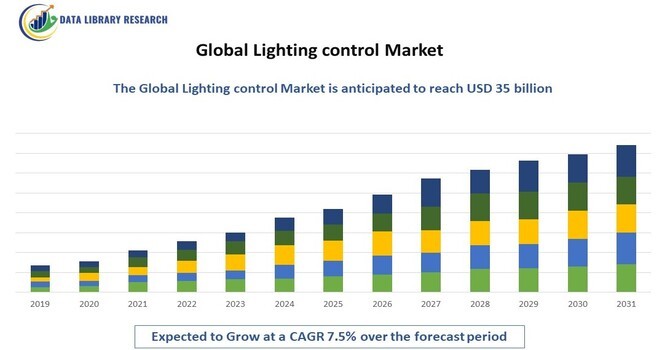
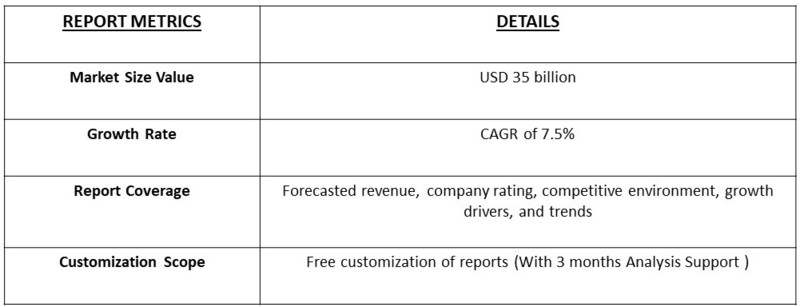
The global lighting control market was valued at approximately USD 20 billion in 2023 and is projected to reach around USD 35 billion by 2031, growing at a compound annual growth rate (CAGR) of about 7.5% during the forecast period.

Lighting Control Market

Get Complete Analysis Of The Report - Download Free Sample PDF

The lighting control market encompasses the development, manufacturing, and implementation of systems that manage and optimize lighting in various environments, including residential, commercial, and industrial settings. These systems include technologies such as dimmers, sensors, timers, and smart lighting solutions that enhance energy efficiency, improve user comfort, and enable automation. The market is driven by growing awareness of energy conservation, advancements in Internet of Things (IoT) technology, and increasing consumer demand for smart home solutions. Additionally, regulatory frameworks and incentives aimed at reducing carbon footprints are further fueling the adoption of advanced lighting control systems. As a result, this market is poised for significant growth in the coming years, aligning with broader sustainability and automation trends.

A key driver of the lighting control market is the increasing demand for energy-efficient solutions, as businesses and consumers seek to reduce energy consumption and lower utility costs. The growing adoption of smart lighting technologies, driven by advancements in IoT and automation, is enhancing user experience and providing greater control over lighting environments. Additionally, rising awareness of environmental sustainability is prompting governments to implement regulations and incentives that promote energy-efficient lighting systems. The expansion of smart homes and commercial spaces is further propelling the market, as users increasingly seek integrated solutions that offer convenience, flexibility, and enhanced functionality. These factors collectively position the lighting control market for robust growth in the coming years.

Lighting Control Market Trends

Key trends shaping the lighting control market include the growing integration of IoT technologies, which enable real-time monitoring and management of lighting systems through mobile applications and centralized platforms. There is an increasing shift towards smart lighting solutions, with consumers and businesses seeking enhanced convenience, customization, and energy savings. The rise of energy-efficient lighting options, such as LED technology, is also driving demand for advanced control systems that optimize performance and minimize waste. Furthermore, the trend towards sustainable building practices and smart cities is leading to greater investment in intelligent lighting control solutions that contribute to reduced carbon footprints. Lastly, the adoption of wireless control systems is gaining traction, as they offer flexibility and ease of installation, further expanding the market's reach.

Market Segmentation

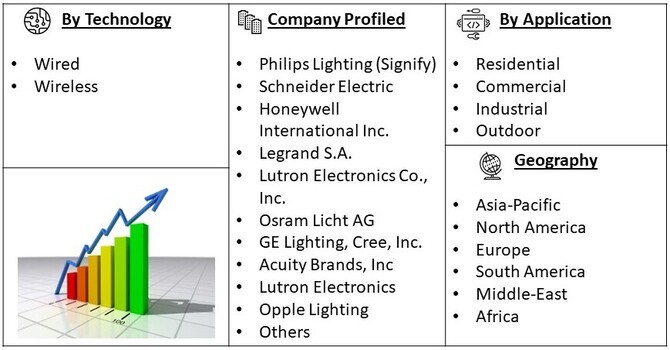
The Global Lighting control market is segmented by technology (Wired, Wireless) Application (Residential, Commercial, Industrial, Outdoor) and geography (Asia-Pacific, North America, Europe, South America, and Middle-East and Africa). The report offers the market size and forecasts for revenue (USD million) for all the above segments.

Lighting Control Market Segment

For Detailed Market Segmentation - Get a Free Sample PDF

Market Drivers

  • Increasing Demand for Energy Efficiency

The growing emphasis on energy efficiency is a primary driver of the lighting control market. Businesses and consumers are increasingly aware of the impact of energy consumption on both costs and the environment. According to the U.S. Department of Energy, adopting advanced lighting control systems can reduce energy usage by up to 30%. As a result, companies are investing in smart lighting solutions that not only enhance operational efficiency but also align with sustainability goals. This trend is further supported by government initiatives and incentives promoting energy-efficient technologies, driving significant demand across residential, commercial, and industrial sectors.

  • Rise of Smart Home and Building Technologies

The rapid adoption of smart home and building technologies is significantly influencing the lighting control market. Consumers are increasingly seeking integrated systems that offer convenience, automation, and enhanced control over their environments. In 2023, the global smart home market was valued at approximately USD 91 billion and is projected to continue growing, with lighting control being a key component. Innovations such as voice-activated lighting and mobile app integration are appealing to tech-savvy consumers. Additionally, commercial buildings are increasingly incorporating smart lighting solutions to improve occupant comfort and reduce energy costs, further accelerating market growth in this segment.

Market Restraints

One significant restraint in the lighting control market is the high initial investment required for advanced lighting control systems, which can deter adoption, particularly among small and medium-sized enterprises (SMEs). While these systems can lead to substantial long-term energy savings, the upfront costs for installation, integration, and training can be a barrier for many organizations. For instance, a report from Navigant Research indicates that the average installation cost for a smart lighting system can range from 30% to 50% higher than traditional lighting solutions. This financial hesitation is compounded by the uncertainty surrounding return on investment (ROI) timelines, especially in regions where energy costs are lower. Consequently, market players must focus on developing more affordable solutions and providing clear value propositions to encourage wider adoption across diverse sectors.

COVID-19 Impact On Lighting Control Market

The COVID-19 pandemic had a profound impact on the lighting control market, causing disruptions in supply chains, manufacturing, and project timelines. During the initial phases of the pandemic, many construction projects were halted, leading to decreased demand for lighting control systems in both residential and commercial sectors. However, as remote work became prevalent, there was an increased focus on enhancing home environments, driving demand for smart lighting solutions. Additionally, the pandemic accelerated the trend towards automation and energy efficiency, prompting businesses to invest in advanced lighting control technologies post-lockdown. Overall, while the market faced short-term challenges, the long-term outlook remains positive, with growing interest in sustainable and intelligent lighting systems as part of broader recovery efforts.

Segmental Analysis

  • Dimmers Segment is Expected to Witness Significant Growth Over the Forecast Period

The dimmers sub-segment of the lighting control market is experiencing robust growth, driven by the increasing demand for energy-efficient lighting solutions and enhanced user comfort. Dimmers allow users to adjust light levels according to their needs, leading to energy savings and improved ambiance in residential and commercial spaces. With the rise of LED technology, modern dimmers are now compatible with a wider range of lighting fixtures, providing greater flexibility for users. In 2023, the global market for dimmers was valued at approximately USD 2 billion and is projected to grow steadily as consumers seek to create personalized lighting experiences. Recent developments include the introduction of smart dimmers that can be controlled via mobile apps or voice commands, further driving adoption among tech-savvy consumers. The push for smart home integration and energy conservation initiatives is fueling demand, positioning dimmers as a key component of the overall lighting control market.

  • Smart Lighting Systems Segment is Expected to Witness Significant Growth Over the Forecast Period

The smart lighting systems sub-segment is at the forefront of the lighting control market, driven by the growing adoption of Internet of Things (IoT) technologies and consumer demand for convenience and automation. Smart lighting solutions enable users to control their lighting remotely through mobile apps, voice assistants, or centralized systems, offering enhanced functionality and ease of use. In 2023, the smart lighting market was estimated to be worth over USD 10 billion, with significant growth anticipated as more households and businesses embrace smart home technologies. Recent innovations include features such as adaptive lighting that adjusts based on natural light levels and occupancy sensors that enhance energy savings. This segment is also benefiting from government initiatives promoting energy-efficient technologies, aligning with global sustainability goals. As smart cities continue to emerge, the demand for integrated smart lighting systems that contribute to urban infrastructure is expected to surge, further driving this segment's growth.

  • Asia Pacific Region is Expected to Witness Significant Growth Over the Forecast Period

The Asia-Pacific region is anticipated to experience substantial growth in the lighting control market during the forecast period, driven by rapid urbanization, industrial expansion, and increasing investments in smart infrastructure. Countries like China and India are at the forefront of this growth, with massive construction projects and government initiatives aimed at improving energy efficiency in urban settings. The rise in disposable incomes and a growing middle class are fueling demand for advanced lighting solutions in residential and commercial sectors. Additionally, the increasing adoption of smart home technologies and the integration of IoT systems are further propelling the market in this region. The commitment to sustainable development and energy conservation, coupled with regulatory support for green building initiatives, positions the Asia-Pacific as a key growth hub in the global lighting control market. As more cities prioritize smart city initiatives, the demand for innovative lighting control solutions that enhance energy efficiency and user experience is expected to soar.

Lighting Control Market Table

To Learn More About This Report - Request a Free Sample Copy

Lighting Control Market Competitive Landscape

The competitive landscape of the lighting control market is characterized by a diverse range of players, including established multinational corporations and innovative startups. Major companies are focusing on product differentiation, technological advancements, and strategic partnerships to enhance their market presence. The push towards smart lighting solutions is driving competition, with firms investing in research and development to offer integrated and user-friendly systems. Additionally, the growing demand for energy efficiency and sustainability is further shaping the competitive landscape of the lighting control market. Companies are increasingly adopting IoT (Internet of Things) technologies to develop smart lighting systems that enable remote control and automation, catering to both residential and commercial sectors. This shift not only enhances user convenience but also aligns with global initiatives aimed at reducing energy consumption and carbon footprints. Moreover, regulatory frameworks promoting energy-efficient practices are encouraging more players to innovate and adapt their product offerings. As a result, firms that successfully integrate cutting-edge technology with sustainable practices are likely to gain a significant competitive advantage in this evolving market.

Key competitors in the lighting control market include

  • Philips Lighting (Signify)
  • Schneider Electric
  • Honeywell International Inc.
  • Legrand S.A.
  • Lutron Electronics Co., Inc.
  • Osram Licht AG
  • GE Lighting, Cree, Inc.
  • Acuity Brands, Inc
  • Lutron Electronics
  • Opple Lighting

Recent Development

  • In 2023, Signify, formerly Philips Lighting, launched a new range of smart lighting solutions under its Philips Hue brand, aimed at enhancing user experience through advanced connectivity and customization features. The new system includes an updated app that allows users to create personalized lighting scenes and schedules, integrating seamlessly with various smart home devices. This development highlights Signify's commitment to innovation in the smart lighting segment, catering to the growing demand for user-friendly and energy-efficient lighting solutions. The company's focus on sustainability is also evident, as the new products are designed to minimize energy consumption, aligning with global efforts towards environmental conservation.
  • In early 2024, Schneider Electric announced significant enhancements to its EcoStruxure lighting control platform, which integrates advanced IoT capabilities to provide comprehensive building management solutions. This upgrade includes features for real-time energy monitoring, predictive maintenance, and improved data analytics, enabling organizations to optimize their lighting systems for energy efficiency and operational performance. By leveraging its expertise in energy management, Schneider Electric aims to support businesses in achieving sustainability targets while reducing costs. This development reflects the ongoing trend towards integrated smart building solutions and reinforces Schneider Electric's position as a leader in the lighting control market.


Frequently Asked Questions (FAQ) :

Q1. What are the driving factors for the Global Lighting control Market?

The global lighting control market is driven by the increasing demand for energy efficiency and sustainability, as businesses and consumers seek to reduce energy consumption and lower costs. Additionally, the growing trend toward smart homes and IoT integration is propelling innovation in lighting control systems, enhancing user convenience and functionality.

Q2. What are the restraining factors for the Global Lighting control market?

Challenges such as high initial installation costs and the complexity of integrating new systems with existing infrastructure can restrain market growth. Moreover, the lack of standardization in lighting control technologies may hinder widespread adoption across various sectors.

Q3. Which segment is projected to hold the largest share of the Global Lighting control market?

The smart lighting segment is projected to hold the largest share of the global lighting control market, fueled by advancements in technology and the rising consumer preference for integrated, automated lighting solutions.

Q4. Which region holds the largest share of the Global Lighting control market?

North America is expected to hold the largest share of the global lighting control market, driven by strong demand for energy-efficient solutions, significant investments in smart building technologies, and robust regulatory support.

Q5. Which are the prominent players in the Global Lighting control market?

Key players in the global lighting control market include Philips Lighting (Signify), Lutron Electronics, Schneider Electric, and Honeywell. These companies are recognized for their innovative product offerings, strong market presence, and commitment to sustainability, positioning them effectively in the competitive landscape.

Chapter 1. Methodology and Scope
  • 1.1. Methodology segmentation & scope
  • 1.2. Market Definitions
  • 1.3. Research Methodology
    • 1.3.1. Information Procurement
    • 1.3.2. Information or Data Analysis
    • 1.3.3. Market Formulation & Data Visualization
    • 1.3.4. Data Validation & Publishing
  • 1.4. Research Scope and Assumptions
    • 1.4.1. List of Data Sources
Chapter 2. Executive Summary
  • 2.1. Market Outlook
  • 2.2. Segment Outlook
  • 2.3. Competitive Insights
Chapter 3. Lighting Control System Variables, Trends & Scope
  • 3.1. Market Introduction/Lineage Outlook
  • 3.2. Industry value chain analysis
  • 3.3. Market dynamics
    • 3.3.1. Market Drivers Analysis
    • 3.3.2. Market Restraints Analysis
    • 3.3.3. Industry Opportunities
  • 3.4. Lighting Control System Analysis Tools
    • 3.4.1. Porter’s Analysis
      • 3.4.1.1. Bargaining power of the suppliers
      • 3.4.1.2. Bargaining power of the buyers
      • 3.4.1.3. Threats of substitution
      • 3.4.1.4. Threats from new entrants
    • 3.4.2. PESTEL Analysis
      • 3.4.2.1. Political landscape
      • 3.4.2.2. Economic and Social landscape
      • 3.4.2.3. Technological landscape
      • 3.4.2.4. Environmental landscape
      • 3.4.2.5. Legal landscape
    Chapter 4. Lighting Control System Market: Component Estimates & Trend Analysis
    • 4.1. Segment Dashboard
    • 4.2. Lighting Control System: Component Movement Analysis, 2023 & 2030 (USD Billion)
    • 4.3. Hardware
      • 4.3.1. Market Size Estimates and Forecasts, 2018 - 2030 (USD Billion)
      • 4.3.2. LED Drivers
        • 4.3.2.1. Market Size Estimates and Forecasts, 2018 - 2030 (USD Billion)
      • 4.3.3. Sensors
        • 4.3.3.1. Market Size Estimates and Forecasts, 2018 - 2030 (USD Billion)
      • 4.3.4. Switches and Dimmers
        • 4.3.4.1. Market Size Estimates and Forecasts, 2018 - 2030 (USD Billion)
      • 4.3.5. Relay Units
        • 4.3.5.1. Market Size Estimates and Forecasts, 2018 - 2030 (USD Billion)
      • 4.3.6. Gateways
        • 4.3.6.1. Market Size Estimates and Forecasts, 2018 - 2030 (USD Billion)
  • 4.4. Software
    • 4.4.1. Market Size Estimates and Forecasts, 2018 - 2030 (USD Billion)
    • 4.4.2. Web Based
      • 4.4.2.1. Market Size Estimates and Forecasts, 2018 - 2030 (USD Billion)
    • 4.4.3. Cloud Based
      • 4.4.3.1. Market Size Estimates and Forecasts, 2018 - 2030 (USD Billion)
  • 4.5. Services
    • 4.5.1. Market Size Estimates and Forecasts, 2018 - 2030 (USD Billion)
  • Chapter 5. Lighting Control System Market: Communication Protocols Estimates & Trend Analysis
    • 5.1. Segment Dashboard
    • 5.2. Lighting Control System: Communication Protocols Movement Analysis, 2023 & 2030 (USD Billion)
    • 5.3. Wired
      • 5.3.1. Market Size Estimates and Forecasts, 2018 - 2030 (USD Billion)
    • 5.4. Wireless
      • 5.4.1. Market Size Estimates and Forecasts, 2018 - 2030 (USD Billion)
    Chapter 6. Lighting Control System Market: End Use Estimates & Trend Analysis
    • 6.1. Segment Dashboard
    • 6.2. Lighting Control System: End Use Movement Analysis, 2023 & 2030 (USD Billion)
    • 6.3. Indoor
      • 6.3.1. Market Size Estimates and Forecasts, 2018 - 2030 (USD Billion)
      • 6.3.2. Residential
        • 6.3.2.1. Market Size Estimates and Forecasts, 2018 - 2030 (USD Billion)
      • 6.3.3. Commercial
        • 6.3.3.1. Market Size Estimates and Forecasts, 2018 - 2030 (USD Billion)
  • 6.4. Outdoor
    • 6.4.1. Market Size Estimates and Forecasts, 2018 - 2030 (USD Billion)
    • 6.4.2. Highways and Roadways
      • 6.4.2.1. Market Size Estimates and Forecasts, 2018 - 2030 (USD Billion)
    • 6.4.3. Architectural
      • 6.4.3.1. Market Size Estimates and Forecasts, 2018 - 2030 (USD Billion)
    • 6.4.4. Others
      • 6.4.4.1. Market Size Estimates and Forecasts, 2018 - 2030 (USD Billion)
    Chapter 7. Lighting Control System Market: Regional Estimates & Trend Analysis
    • 7.1. Lighting Control System Share, By Region, 2023 & 2030, USD Billion
    • 7.2. North America
      • 7.2.1. Market Estimates and Forecasts, 2018 - 2030 (USD Billion)
      • 7.2.2. Market estimates and forecast by component, 2018 - 2030 (Revenue, USD Billion)
        • 7.2.2.1. Market estimates and forecast by Hardware, 2018 - 2030 (Revenue, USD Billion)
        • 7.2.2.2. Market estimates and forecast by Software, 2018 - 2030 (Revenue, USD Billion)
      • 7.2.3. Market estimates and forecast by communication protocols, 2018 - 2030 (Revenue, USD Billion)
      • 7.2.4. Market estimates and forecast by end use, 2018 - 2030 (Revenue, USD Billion)
      • 7.2.5. U.S.
        • 7.2.5.1. Market Estimates and Forecasts, 2018 - 2030 (USD Billion)
        • 7.2.5.2. Market estimates and forecast by component, 2018 - 2030 (Revenue, USD Billion)
          • 7.2.5.2.1. Market estimates and forecast by Hardware, 2018 - 2030 (Revenue, USD Billion)
          • 7.2.5.2.2. Market estimates and forecast by Software, 2018 - 2030 (Revenue, USD Billion)
        • 7.2.5.3. Market estimates and forecast by communication protocols, 2018 - 2030 (Revenue, USD Billion)
        • 7.2.5.4. Market estimates and forecast by end use, 2018 - 2030 (Revenue, USD Billion)
      • 7.2.6. Canada
        • 7.2.6.1. Market Estimates and Forecasts, 2018 - 2030 (USD Billion)
        • 7.2.6.2. Market estimates and forecast by component, 2018 - 2030 (Revenue, USD Billion)
          • 7.2.6.2.1. Market estimates and forecast by Hardware, 2018 - 2030 (Revenue, USD Billion)
          • 7.2.6.2.2. Market estimates and forecast by Software, 2018 - 2030 (Revenue, USD Billion)
        • 7.2.6.3. Market estimates and forecast by communication protocols, 2018 - 2030 (Revenue, USD Billion)
        • 7.2.6.4. Market estimates and forecast by end use, 2018 - 2030 (Revenue, USD Billion)
      • 7.2.7. Mexico
        • 7.2.7.1. Market Estimates and Forecasts, 2018 - 2030 (USD Billion)
        • 7.2.7.2. Market estimates and forecast by component, 2018 - 2030 (Revenue, USD Billion)
          • 7.2.7.2.1. Market estimates and forecast by Hardware, 2018 - 2030 (Revenue, USD Billion)
          • 7.2.7.2.2. Market estimates and forecast by Software, 2018 - 2030 (Revenue, USD Billion)
        • 7.2.7.3. Market estimates and forecast by communication protocols, 2018 - 2030 (Revenue, USD Billion)
        • 7.2.7.4. Market estimates and forecast by end use, 2018 - 2030 (Revenue, USD Billion)
  • 7.3. Europe
    • 7.3.1. Market Estimates and Forecasts, 2018 - 2030 (USD Billion)
    • 7.3.2. Market estimates and forecast by component, 2018 - 2030 (Revenue, USD Billion)
      • 7.3.2.1. Market estimates and forecast by Hardware, 2018 - 2030 (Revenue, USD Billion)
      • 7.3.2.2. Market estimates and forecast by Software, 2018 - 2030 (Revenue, USD Billion)
    • 7.3.3. Market estimates and forecast by communication protocols, 2018 - 2030 (Revenue, USD Billion)
    • 7.3.4. Market estimates and forecast by end use, 2018 - 2030 (Revenue, USD Billion)
    • 7.3.5. UK
      • 7.3.5.1. Market Estimates and Forecasts, 2018 - 2030 (USD Billion)
      • 7.3.5.2. Market estimates and forecast by component, 2018 - 2030 (Revenue, USD Billion)
        • 7.3.5.2.1. Market estimates and forecast by Hardware, 2018 - 2030 (Revenue, USD Billion)
        • 7.3.5.2.2. Market estimates and forecast by Software, 2018 - 2030 (Revenue, USD Billion)
      • 7.3.5.3. Market estimates and forecast by communication protocols, 2018 - 2030 (Revenue, USD Billion)
      • 7.3.5.4. Market estimates and forecast by Deployment, 2018 - 2030 (Revenue, USD Billion)
    • 7.3.6. Germany
      • 7.3.6.1. Market Estimates and Forecasts, 2018 - 2030 (USD Billion)
      • 7.3.6.2. Market estimates and forecast by component, 2018 - 2030 (Revenue, USD Billion)
        • 7.3.6.2.1. Market estimates and forecast by Hardware, 2018 - 2030 (Revenue, USD Billion)
        • 7.3.6.2.2. Market estimates and forecast by Software, 2018 - 2030 (Revenue, USD Billion)
      • 7.3.6.3. Market estimates and forecast by communication protocols, 2018 - 2030 (Revenue, USD Billion)
      • 7.3.6.4. Market estimates and forecast by end use, 2018 - 2030 (Revenue, USD Billion)
    • 7.3.7. France
      • 7.3.7.1. Market Estimates and Forecasts, 2018 - 2030 (USD Billion)
      • 7.3.7.2. Market estimates and forecast by component, 2018 - 2030 (Revenue, USD Billion)
        • 7.3.7.2.1. Market estimates and forecast by Hardware, 2018 - 2030 (Revenue, USD Billion)
        • 7.3.7.2.2. Market estimates and forecast by Software, 2018 - 2030 (Revenue, USD Billion)
      • 7.3.7.3. Market estimates and forecast by communication protocols, 2018 - 2030 (Revenue, USD Billion)
      • 7.3.7.4. Market estimates and forecast by end use, 2018 - 2030 (Revenue, USD Billion)
  • 7.4. Asia Pacific
    • 7.4.1. Market Estimates and Forecasts, 2018 - 2030 (USD Billion)
    • 7.4.2. Market estimates and forecast by component, 2018 - 2030 (Revenue, USD Billion)
      • 7.4.2.1. Market estimates and forecast by Hardware, 2018 - 2030 (Revenue, USD Billion)
      • 7.4.2.2. Market estimates and forecast by Software, 2018 - 2030 (Revenue, USD Billion)
    • 7.4.3. Market estimates and forecast by communication protocols, 2018 - 2030 (Revenue, USD Billion)
    • 7.4.4. Market estimates and forecast by end use, 2018 - 2030 (Revenue, USD Billion)
    • 7.4.5. China
      • 7.4.5.1. Market Estimates and Forecasts, 2018 - 2030 (USD Billion)
      • 7.4.5.2. Market estimates and forecast by component, 2018 - 2030 (Revenue, USD Billion)
        • 7.4.5.2.1. Market estimates and forecast by Hardware, 2018 - 2030 (Revenue, USD Billion)
        • 7.4.5.2.2. Market estimates and forecast by Software, 2018 - 2030 (Revenue, USD Billion)
      • 7.4.5.3. Market estimates and forecast by communication protocols, 2018 - 2030 (Revenue, USD Billion)
      • 7.4.5.4. Market estimates and forecast by end use, 2018 - 2030 (Revenue, USD Billion)
    • 7.4.6. India
      • 7.4.6.1. Market Estimates and Forecasts, 2018 - 2030 (USD Billion)
      • 7.4.6.2. Market estimates and forecast by component, 2018 - 2030 (Revenue, USD Billion)
        • 7.4.6.2.1. Market estimates and forecast by Hardware, 2018 - 2030 (Revenue, USD Billion)
        • 7.4.6.2.2. Market estimates and forecast by Software, 2018 - 2030 (Revenue, USD Billion)
      • 7.4.6.3. Market estimates and forecast by communication protocols, 2018 - 2030 (Revenue, USD Billion)
      • 7.4.6.4. Market estimates and forecast by enterprise size, 2018 - 2030 (Revenue, USD Billion)
    • 7.4.7. Japan
      • 7.4.7.1. Market Estimates and Forecasts, 2018 - 2030 (USD Billion)
      • 7.4.7.2. Market estimates and forecast by component, 2018 - 2030 (Revenue, USD Billion)
        • 7.4.7.2.1. Market estimates and forecast by Hardware, 2018 - 2030 (Revenue, USD Billion)
        • 7.4.7.2.2. Market estimates and forecast by Software, 2018 - 2030 (Revenue, USD Billion)
      • 7.4.7.3. Market estimates and forecast by communication protocols, 2018 - 2030 (Revenue, USD Billion)
      • 7.4.7.4. Market estimates and forecast by end use, 2018 - 2030 (Revenue, USD Billion)
    • 7.4.8. Australia
      • 7.4.8.1. Market Estimates and Forecasts, 2018 - 2030 (USD Billion)
      • 7.4.8.2. Market estimates and forecast by component, 2018 - 2030 (Revenue, USD Billion)
        • 7.4.8.2.1. Market estimates and forecast by Hardware, 2018 - 2030 (Revenue, USD Billion)
        • 7.4.8.2.2. Market estimates and forecast by Software, 2018 - 2030 (Revenue, USD Billion)
      • 7.4.8.3. Market estimates and forecast by communication protocols, 2018 - 2030 (Revenue, USD Billion)
      • 7.4.8.4. Market estimates and forecast by end use, 2018 - 2030 (Revenue, USD Billion)
    • 7.4.9. South Korea
      • 7.4.9.1. Market Estimates and Forecasts, 2018 - 2030 (USD Billion)
      • 7.4.9.2. Market estimates and forecast by component, 2018 - 2030 (Revenue, USD Billion)
        • 7.4.9.2.1. Market estimates and forecast by Hardware, 2018 - 2030 (Revenue, USD Billion)
        • 7.4.9.2.2. Market estimates and forecast by Software, 2018 - 2030 (Revenue, USD Billion)
      • 7.4.9.3. Market estimates and forecast by communication protocols, 2018 - 2030 (Revenue, USD Billion)
      • 7.4.9.4. Market estimates and forecast by end use, 2018 - 2030 (Revenue, USD Billion)
  • 7.5. Latin America
    • 7.5.1. Market Estimates and Forecasts, 2018 - 2030 (USD Billion)
    • 7.5.2. Market estimates and forecast by component, 2018 - 2030 (Revenue, USD Billion)
      • 7.5.2.1. Market estimates and forecast by Hardware, 2018 - 2030 (Revenue, USD Billion)
      • 7.5.2.2. Market estimates and forecast by Software, 2018 - 2030 (Revenue, USD Billion)
    • 7.5.3. Market estimates and forecast by communication protocols, 2018 - 2030 (Revenue, USD Billion)
    • 7.5.4. Market estimates and forecast by end use, 2018 - 2030 (Revenue, USD Billion)
    • 7.5.5. Brazil
      • 7.5.5.1. Market Estimates and Forecasts, 2018 - 2030 (USD Billion)
      • 7.5.5.2. Market estimates and forecast by component, 2018 - 2030 (Revenue, USD Billion)
        • 7.5.5.2.1. Market estimates and forecast by Hardware, 2018 - 2030 (Revenue, USD Billion)
        • 7.5.5.2.2. Market estimates and forecast by Software, 2018 - 2030 (Revenue, USD Billion)
      • 7.5.5.3. Market estimates and forecast by communication protocols, 2018 - 2030 (Revenue, USD Billion)
      • 7.5.5.4. Market estimates and forecast by end use, 2018 - 2030 (Revenue, USD Billion)
  • 7.6. Middle East & Africa
    • 7.6.1. Market Estimates and Forecasts, 2018 - 2030 (USD Billion)
    • 7.6.2. Market estimates and forecast by component, 2018 - 2030 (Revenue, USD Billion)
      • 7.6.2.1. Market estimates and forecast by Hardware, 2018 - 2030 (Revenue, USD Billion)
      • 7.6.2.2. Market estimates and forecast by Software, 2018 - 2030 (Revenue, USD Billion)
    • 7.6.3. Market estimates and forecast by communication protocols, 2018 - 2030 (Revenue, USD Billion)
    • 7.6.4. Market estimates and forecast by end use, 2018 - 2030 (Revenue, USD Billion)
    • 7.6.5. Saudi Arabia
      • 7.6.5.1. Market Estimates and Forecasts, 2018 - 2030 (USD Billion)
      • 7.6.5.2. Market estimates and forecast by component, 2018 - 2030 (Revenue, USD Billion)
        • 7.6.5.2.1. Market estimates and forecast by Hardware, 2018 - 2030 (Revenue, USD Billion)
        • 7.6.5.2.2. Market estimates and forecast by Software, 2018 - 2030 (Revenue, USD Billion)
      • 7.6.5.3. Market estimates and forecast by communication protocols, 2018 - 2030 (Revenue, USD Billion)
      • 7.6.5.4. Market estimates and forecast by end use, 2018 - 2030 (Revenue, USD Billion)
    • 7.6.6. UAE
      • 7.6.6.1. Market Estimates and Forecasts, 2018 - 2030 (USD Billion)
      • 7.6.6.2. Market estimates and forecast by component, 2018 - 2030 (Revenue, USD Billion)
        • 7.6.6.2.1. Market estimates and forecast by Hardware, 2018 - 2030 (Revenue, USD Billion)
        • 7.6.6.2.2. Market estimates and forecast by Software, 2018 - 2030 (Revenue, USD Billion)
      • 7.6.6.3. Market estimates and forecast by communication protocols, 2018 - 2030 (Revenue, USD Billion)
      • 7.6.6.4. Market estimates and forecast by end use, 2018 - 2030 (Revenue, USD Billion)
    • 7.6.7. South Africa
      • 7.6.7.1. Market Estimates and Forecasts, 2018 - 2030 (USD Billion)
      • 7.6.7.2. Market estimates and forecast by component, 2018 - 2030 (Revenue, USD Billion)
        • 7.6.7.2.1. Market estimates and forecast by Hardware, 2018 - 2030 (Revenue, USD Billion)
        • 7.6.7.2.2. Market estimates and forecast by Software, 2018 - 2030 (Revenue, USD Billion)
      • 7.6.7.3. Market estimates and forecast by communication protocols, 2018 - 2030 (Revenue, USD Billion)
      • 7.6.7.4. Market estimates and forecast by end use, 2018 - 2030 (Revenue, USD Billion)
    Chapter 8. Competitive Landscape
    • 8.1. Recent Developments & Impact Analysis by Key Market Participants
    • 8.2. Company Categorization
    • 8.3. Company Market Share Analysis
    • 8.4. Company Heat Map Analysis
    • 8.5. Strategy Mapping
      • 8.5.1. Expansion
      • 8.5.2. Mergers & Acquisition
      • 8.5.3. Partnerships & Collaborations
      • 8.5.4. New Product Launches
      • 8.5.5. Research And Development
    • 8.6. Company Profiles
      • 8.6.1. Acuity Brands Lighting, Inc.
        • 8.6.1.1. Participant’s Overview
        • 8.6.1.2. Financial Performance
        • 8.6.1.3. Product Benchmarking
        • 8.6.1.4. Recent Developments
      • 8.6.2. Signify Holding.
        • 8.6.2.1. Participant’s Overview
        • 8.6.2.2. Financial Performance
        • 8.6.2.3. Product Benchmarking
        • 8.6.2.4. Recent Developments
      • 8.6.3. General Electric Company
        • 8.6.3.1. Participant’s Overview
        • 8.6.3.2. Financial Performance
        • 8.6.3.3. Product Benchmarking
        • 8.6.3.4. Recent Developments
      • 8.6.4. Schneider Electric
        • 8.6.4.1. Participant’s Overview
        • 8.6.4.2. Financial Performance
        • 8.6.4.3. Product Benchmarking
        • 8.6.4.4. Recent Developments
      • 8.6.5. Toshiba
        • 8.6.5.1. Participant’s Overview
        • 8.6.5.2. Financial Performance
        • 8.6.5.3. Product Benchmarking
        • 8.6.5.4. Recent Developments
      • 8.6.6. Eaton
        • 8.6.6.1. Participant’s Overview
        • 8.6.6.2. Financial Performance
        • 8.6.6.3. Product Benchmarking
        • 8.6.6.4. Recent Developments
      • 8.6.7. Honeywell International Inc.
        • 8.6.7.1. Participant’s Overview
        • 8.6.7.2. Financial Performance
        • 8.6.7.3. Product Benchmarking
        • 8.6.7.4. Recent Developments
      • 8.6.8. Schneider Electric
        • 8.6.8.1. Participant’s Overview
        • 8.6.8.2. Financial Performance
        • 8.6.8.3. Product Benchmarking
        • 8.6.8.4. Recent Developments
      • 8.6.9. Digital Lumens Inc.
        • 8.6.9.1. Participant’s Overview
        • 8.6.9.2. Financial Performance
        • 8.6.9.3. Product Benchmarking
        • 8.6.9.4. Recent Developments
      • 8.6.10. Casambi
        • 8.6.10.1. Participant’s Overview
        • 8.6.10.2. Financial Performance
        • 8.6.10.3. Product Benchmarking
        • 8.6.10.4. Recent Developments
      • 8.6.11. MaxLite
        • 8.6.11.1. Participant’s Overview
        • 8.6.11.2. Financial Performance
        • 8.6.11.3. Product Benchmarking
        • 8.6.11.4. Recent Developments
      • 8.6.12. Lutron Electronics Co. Inc.
        • 8.6.12.1. Participant’s Overview
        • 8.6.12.2. Financial Performance
        • 8.6.12.3. Product Benchmarking
  • Fig. 1 Lighting Control System Market Segmentation
    Fig. 2 Market landscape
    Fig. 3 Information Procurement
    Fig. 4 Data Analysis Models
    Fig. 5 Market Formulation and Validation
    Fig. 6 Data Validating & Publishing
    Fig. 7 Market Snapshot
    Fig. 8 Segment Snapshot (1/3)
    Fig. 9 Segment Snapshot (2/3)
    Fig. 10 Segment Snapshot (3/3)
    Fig. 11 Competitive Landscape Snapshot
    Fig. 12 Lighting Control System: Industry Value Chain Analysis
    Fig. 13 Lighting Control System: Market Dynamics
    Fig. 14 Lighting Control System: PORTER’s Analysis
    Fig. 15 Lighting Control System: PESTEL Analysis
    Fig. 16 Lighting Control System Share by Component, 2023 & 2030 (USD Billion)
    Fig. 17 Lighting Control System, by Component: Market Share, 2023 & 2030
    Fig. 18 Hardware Market Estimates and Forecasts, 2018 - 2030 (Revenue, USD Billion)
    Fig. 19 Software Market Estimates and Forecasts, 2018 - 2030 (Revenue, USD Billion)
    Fig. 20 Services Market Estimates and Forecasts, 2018 - 2030 (Revenue, USD Billion)
    Fig. 21 Lighting Control System Share by Hardware, 2023 & 2030 (USD Billion)
    Fig. 22 Lighting Control System, by Hardware: Market Share, 2023 & 2030
    Fig. 23 LED Drivers Market Estimates and Forecasts, 2018 - 2030 (Revenue, USD Billion)
    Fig. 24 Sensors Market Estimates and Forecasts, 2018 - 2030 (Revenue, USD Billion)
    Fig. 25 Switches and Dimmers Market Estimates and Forecasts, 2018 - 2030 (Revenue, USD Billion)
    Fig. 26 Relay Units Market Estimates and Forecasts, 2018 - 2030 (Revenue, USD Billion)
    Fig. 27 Others Market Estimates and Forecasts, 2018 - 2030 (Revenue, USD Billion)
    Fig. 28 Lighting Control System Share by Software, 2023 & 2030 (USD Billion)
    Fig. 29 Lighting Control System, by Software: Market Share, 2023 & 2030
    Fig. 30 Web Based Market Estimates and Forecasts, 2018 - 2030 (Revenue, USD Billion)
    Fig. 31 Cloud Based Market Estimates and Forecasts, 2018 - 2030 (Revenue, USD Billion)
    Fig. 32 Lighting Control System Share by Communication Protocols, 2023 & 2030 (USD Billion)
    Fig. 33 Lighting Control System, by Communication Protocols: Market Share, 2023 & 2030
    Fig. 34 Wired Market Estimates and Forecasts, 2018 - 2030 (Revenue, USD Billion)
    Fig. 35 Wireless Market Estimates and Forecasts, 2018 - 2030 (Revenue, USD Billion)
    Fig. 36 Lighting Control System Share by End Use, 2023 & 2030 (USD Billion)
    Fig. 37 Lighting Control System, by End Use: Market Share, 2023 & 2030
    Fig. 38 Indoor Market Estimates and Forecasts, 2018 - 2030 (Revenue, USD Billion)
    Fig. 39 Outdoor Market Estimates and Forecasts, 2018 - 2030 (Revenue, USD Billion)
    Fig. 40 Lighting Control System Share by Indoor, 2023 & 2030 (USD Billion)
    Fig. 41 Lighting Control System, by Indoor: Market Share, 2023 & 2030
    Fig. 42 Residential Market Estimates and Forecasts, 2018 - 2030 (Revenue, USD Billion)
    Fig. 43 Commercial Market Estimates and Forecasts, 2018 - 2030 (Revenue, USD Billion)
    Fig. 44 Lighting Control System Share by Outdoor, 2023 & 2030 (USD Billion)
    Fig. 45 Lighting Control System, by Outdoor: Market Share, 2023 & 2030
    Fig. 46 Highways and Roadways Market Estimates and Forecasts, 2018 - 2030 (Revenue, USD Billion)
    Fig. 47 Architectural Market Estimates and Forecasts, 2018 - 2030 (Revenue, USD Billion)
    Fig. 48 Others Market Estimates and Forecasts, 2018 - 2030 (Revenue, USD Billion)
    Fig. 49 Regional Market place: Key Takeaways
    Fig. 50 North America Lighting Control System Market Estimates and Forecasts, 2018 - 2030 (USD Billion)
    Fig. 51 U.S. Lighting Control System Market Estimates and Forecasts, 2018 - 2030 (USD Billion)
    Fig. 52 Canada Lighting Control System Market Estimates and Forecasts, 2018 - 2030 (USD Billion)
    Fig. 53 Mexico Lighting Control System Market Estimates and Forecasts, 2018 - 2030 (USD Billion)
    Fig. 54 Europe Lighting Control System Market Estimates and Forecasts, 2018 - 2030 (USD Billion)
    Fig. 55 UK Lighting Control System Market Estimates and Forecasts, 2018 - 2030 (USD Billion)
    Fig. 56 Germany Lighting Control System Market Estimates and Forecasts, (2018 - 2030 (USD Billion)
    Fig. 57 France Lighting Control System Market Estimates and Forecasts, 2018 - 2030 (USD Billion)
    Fig. 58 Asia Pacific Lighting Control System Market Estimates and Forecast, 2018 - 2030 (USD Billion)
    Fig. 59 China Lighting Control System Market Estimates and Forecasts, 2018 - 2030 (USD Billion)
    Fig. 60 India Lighting Control System Market Estimates and Forecasts, 2018 - 2030 (USD Billion)
    Fig. 61 Japan Lighting Control System Market Estimates and Forecasts, 2018 - 2030 (USD Billion)
    Fig. 62 Australia Lighting Control System Market Estimates and Forecasts, 2018 - 2030 (USD Billion)
    Fig. 63 South Korea Lighting Control System Market Estimates and Forecasts, 2018 - 2030 (USD Billion)
    Fig. 64 Latin America Lighting Control System Market Estimates and Forecasts, 2018 - 2030 (USD Billion)
    Fig. 65 Brazil Lighting Control System Market Estimates and Forecasts, 2018 - 2030 (USD Billion)
    Fig. 66 MEA Lighting Control System Market Estimates and Forecasts, 2018 - 2030 (USD Billion)
    Fig. 67 Saudi Arabia Lighting Control System Market Estimates and Forecasts, 2018 - 2030 (USD Billion)
    Fig. 68 UAE Lighting Control System Market Estimates and Forecasts, 2018 - 2030 (USD Billion)
    Fig. 69 South Africa Lighting Control System Market Estimates and Forecasts, 2018 - 2030 (USD Billion)
    Fig. 70 Key Company Categorization
    Fig. 71 Company Market Positioning
    Fig. 72 Key Company Market Share Analysis, 2023
    Fig. 73 Strategic Framework
    Research Process

    Data Library Research are conducted by industry experts who offer insight on industry structure, market segmentations technology assessment and competitive landscape (CL), and penetration, as well as on emerging trends. Their analysis is based on primary interviews (~ 80%) and secondary research (~ 20%) as well as years of professional expertise in their respective industries. Adding to this, by analysing historical trends and current market positions, our analysts predict where the market will be headed for the next five years. Furthermore, the varying trends of segment & categories geographically presented are also studied and the estimated based on the primary & secondary research.

    In this particular report from the supply side Data Library Research has conducted primary surveys (interviews) with the key level executives (VP, CEO’s, Marketing Director, Business Development Manager and SOFT) of the companies that active & prominent as well as the midsized organization

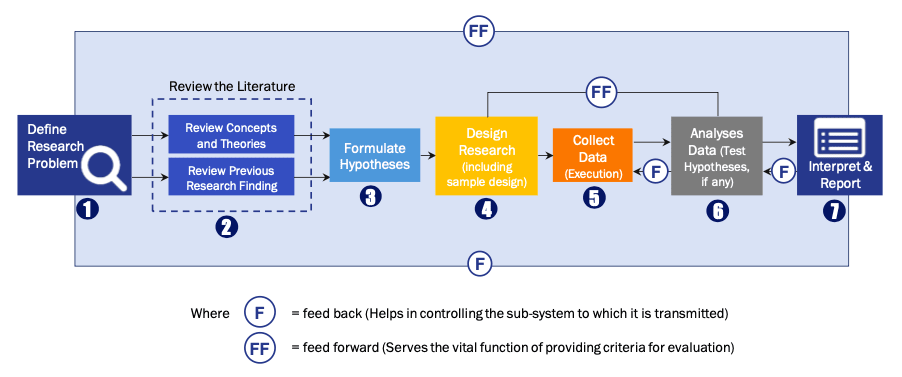
    FIGURE 1: DLR RESEARH PROCESS

    research-methodology1

    Primary Research

    Extensive primary research was conducted to gain a deeper insight of the market and industry performance. The analysis is based on both primary and secondary research as well as years of professional expertise in the respective industries.

    In addition to analysing current and historical trends, our analysts predict where the market is headed over the next five years.

    It varies by segment for these categories geographically presented in the list of market tables. Speaking about this particular report we have conducted primary surveys (interviews) with the key level executives (VP, CEO’s, Marketing Director, Business Development Manager and many more) of the major players active in the market.

    Secondary Research

    Secondary research was mainly used to collect and identify information useful for the extensive, technical, market-oriented, and Friend’s study of the Global Extra Neutral Alcohol. It was also used to obtain key information about major players, market classification and segmentation according to the industry trends, geographical markets, and developments related to the market and technology perspectives. For this study, analysts have gathered information from various credible sources, such as annual reports, sec filings, journals, white papers, SOFT presentations, and company web sites.

    Market Size Estimation

    Both, top-down and bottom-up approaches were used to estimate and validate the size of the Global market and to estimate the size of various other dependent submarkets in the overall Extra Neutral Alcohol. The key players in the market were identified through secondary research and their market contributions in the respective geographies were determined through primary and secondary research.

    Forecast Model

    research-methodology2

    Happy to Assist You

    If you have a question?

    info@datalibraryresearch.com

    IND : +91 955 279 0357

    Browse Related Reports