Orthopedic Braces and Supports Market Overview and Analysis

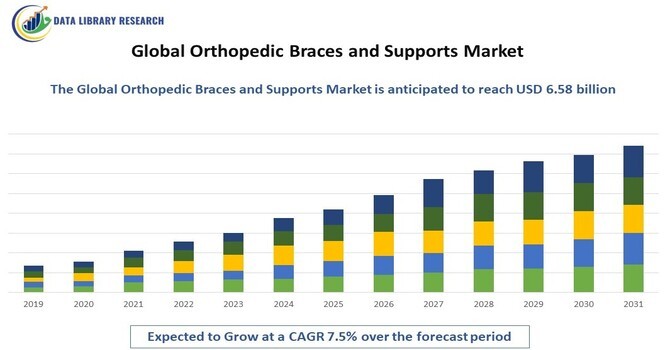
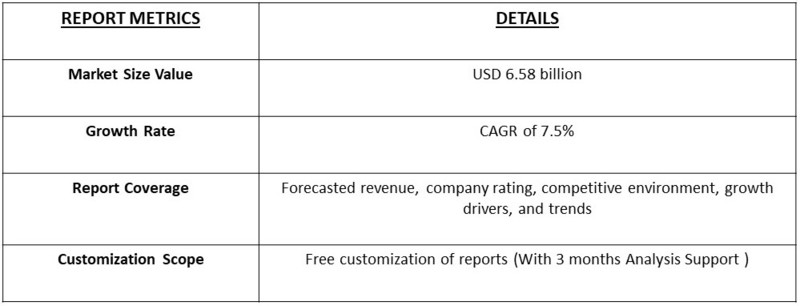
The global orthopedic braces and supports market is projected to reach a market value of USD 4.23 billion in 2023 and is expected to grow to USD 6.58 billion by 2031, reflecting a compound annual growth rate (CAGR) of 7.5% from 2023 to 2031.

Orthopedic Braces and Supports Market

Get Complete Analysis Of The Report - Download Free Sample PDF

Orthopedic braces and supports are specialized medical devices designed to stabilize, support, and protect injured or weakened joints and muscles. They are commonly used in the management of various orthopedic conditions, including sprains, fractures, arthritis, and post-surgical recovery. These devices can help alleviate pain, improve mobility, and promote healing by limiting movement in affected areas. Available in various types—such as knee braces, ankle supports, back braces, and shoulder immobilizers—orthopedic supports are often tailored to meet individual patient needs. With advancements in materials and technology, many braces now feature lightweight, breathable designs that enhance comfort and compliance. Increasing awareness of their benefits has led to widespread adoption in both clinical settings and for preventive care in sports and daily activities.

This growth is primarily driven by the rising prevalence of orthopedic conditions, increased participation in sports and fitness activities, and a growing aging population. Orthopedic braces and supports are medical devices designed to provide stability and support to injured or weakened joints and muscles. These devices can be used for various purposes, including post-operative rehabilitation, injury prevention, and chronic condition management. The increasing awareness of the benefits of orthopedic supports, such as improved mobility and pain relief, has further contributed to the market's expansion.

The market for orthopedic braces and supports encompasses a wide range of products, including knee braces, ankle supports, back braces, and shoulder supports, among others. The demand for these products is not only driven by injury treatment but also by preventive measures in sports and occupational settings. Advances in materials and technology have led to the development of more comfortable, lightweight, and effective orthopedic supports, making them appealing to a broader audience. Furthermore, the trend toward outpatient and home healthcare solutions has enhanced the accessibility of these devices, facilitating their adoption among patients seeking non-invasive treatment options.

Orthopedic Braces and Supports Market Trends

The orthopedic braces and supports market is witnessing several transformative trends that are shaping its future landscape. One notable trend is the increasing integration of smart technology in orthopedic supports, allowing for real-time monitoring of joint movement and muscle activity. Wearable devices that track recovery progress and provide feedback to healthcare providers are gaining popularity among both patients and professionals. Another significant trend is the customization of braces and supports, catering to individual patient needs and anatomical variations. Custom-fitted devices offer enhanced comfort and effectiveness, appealing to patients who prioritize personalized care.

Additionally, the rise of e-commerce and telehealth services has improved access to orthopedic products, allowing patients to order braces and supports from the comfort of their homes. The growing emphasis on preventative care, particularly in sports and fitness, is also driving demand for orthopedic supports that reduce injury risk and promote long-term joint health. Marketing strategies focusing on patient education about injury prevention and recovery are becoming increasingly prevalent, further propelling market growth. Overall, these trends reflect a dynamic shift towards more technologically advanced, personalized, and accessible orthopedic solutions.

Market Segmentation

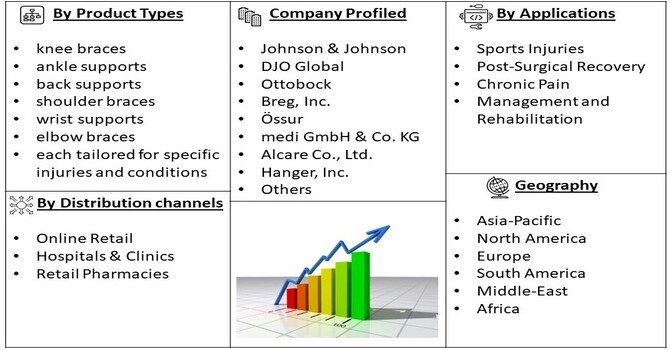
The global orthopedic braces and supports market is segmented by product type, application, geography, and distribution channel. Product types (knee braces, ankle supports, back supports, shoulder braces, wrist supports, and elbow braces, each tailored for specific injuries and conditions) Applications (Sports Injuries, Post-Surgical Recovery, Chronic Pain Management, and Rehabilitation), Distribution channels (Online Retail, Hospitals & Clinics, and Retail Pharmacies). Geographically, the market spans North America, Europe, Asia-Pacific, South America, and the Middle East and Africa, each with unique healthcare dynamics and demand trends. This comprehensive segmentation enables targeted strategies for product development and marketing, enhancing the overall effectiveness and accessibility of orthopedic solutions.

Orthopedic Braces and Supports Market Segment

For Detailed Market Segmentation - Get a Free Sample PDF

Market Drivers

  • Rising Incidence of Sports Injuries

The increasing participation in sports and physical activities has led to a significant rise in sports-related injuries, driving demand for orthopedic braces and supports. Athletes, whether amateur or professional, are more aware of the importance of protecting themselves against injuries and are actively seeking effective solutions to aid recovery and prevent re-injury. This trend has led to a greater emphasis on the development of specialized products tailored to different sports, enhancing performance while ensuring safety. Moreover, the growing popularity of fitness and recreational activities has further fueled this demand, as more individuals are recognizing the benefits of using braces not only for recovery but also as a preventive measure. Consequently, the market is witnessing innovations in design and technology, providing enhanced comfort and functionality, and thereby attracting a broader customer base.

  • Growing Aging Population

The global aging population is another significant driver of the orthopedic braces and supports market. As individuals age, they often face a higher prevalence of orthopedic conditions such as arthritis, osteoporosis, and general joint instability. These conditions lead to increased demand for supportive devices that can alleviate pain and improve mobility. Healthcare systems are increasingly focused on enhancing the quality of life for older adults, making orthopedic support an essential component of their care. Furthermore, there is a strong push for preventive care strategies to minimize the risk of falls and injuries in the elderly, which amplifies the need for braces that provide stability and support. As a result, the market is expanding to meet the growing needs of this demographic, with products designed specifically for older adults to ensure ease of use and effectiveness.

Market Restraints

Despite its growth potential, the orthopedic braces and supports market faces several challenges. One significant restraint is the high cost of advanced braces, which may limit accessibility for some patients, especially in developing regions. Additionally, the effectiveness of braces can vary based on individual conditions, and improper use can lead to complications, which may discourage some patients from utilizing these products. Competition from alternative treatment methods, such as physical therapy and surgical interventions, may also pose a challenge to market growth. Moreover, the lack of awareness about the benefits of orthopedic support in certain demographics could restrict market expansion. The need for continuous education and outreach efforts to promote the use of these devices is crucial in overcoming these barriers.

COVID-19 Impact On Orthopedic Braces and Supports Market

The COVID-19 pandemic significantly impacted the Orthopedic Braces and Supports Market, leading to a temporary decline in demand due to the postponement of elective surgeries and a reduction in outpatient visits for musculoskeletal injuries. Healthcare systems were overwhelmed, prioritizing COVID-19 patients, which limited access to orthopedic care and rehabilitation services. However, the pandemic also accelerated the adoption of telehealth solutions, enabling remote consultations and follow-ups, which facilitated continued patient care. As physical activity resumed and sports activities picked up, there was a resurgence in demand for orthopedic braces and supports, particularly among athletes and individuals recovering from injuries. Overall, while the market faced initial challenges, it has shown resilience and adaptability in response to evolving healthcare needs.

Segmental Analysis

  • Knee Braces Segment is Expected to Witness Significant Growth Over the Forecast Period

The knee braces segment is anticipated to experience substantial growth over the forecast period, driven by the rising incidence of knee injuries and conditions such as osteoarthritis. With more individuals engaging in sports and physical activities, the demand for knee braces to provide support, stability, and pain relief has surged. Additionally, advancements in knee brace technology, including customizable and lightweight designs, have improved comfort and usability, making them more appealing to consumers. The growing awareness of the benefits of preventative care and rehabilitation has also led to increased adoption among athletes and active individuals, further propelling market growth in this segment. As healthcare providers continue to recommend knee braces for both recovery and injury prevention, this segment is set to become a significant driver of overall market expansion.

  • Post-Surgical Recovery Segment is Expected to Witness Significant Growth Over the Forecast Period

The post-surgical recovery segment of the orthopedic braces and supports market is poised for significant growth as more individuals undergo orthopedic surgeries. With the rise in procedures such as knee and hip replacements, there is an increasing demand for braces that facilitate recovery and provide necessary support during rehabilitation. These braces are designed to stabilize the affected area, minimize pain, and promote healing, which is crucial for successful recovery. Furthermore, healthcare providers are increasingly emphasizing the importance of using specialized support post-surgery to enhance patient outcomes. As the focus on effective recovery strategies intensifies, the post-surgical recovery segment is likely to see a marked increase in product adoption, driven by both patient needs and medical recommendations.

  • Hospitals & Clinics Segment is Expected to Witness Significant Growth Over the Forecast Period

The hospitals and clinics segment is expected to experience significant growth in the orthopedic braces and supports market, driven by the increasing number of orthopedic procedures performed in clinical settings. As healthcare facilities continue to invest in advanced technologies and patient care, the demand for high-quality orthopedic products is rising. Hospitals and clinics are becoming primary distribution points for orthopedic support, as they are often where patients receive post-operative care and rehabilitation. Additionally, the trend towards integrated healthcare solutions means that these facilities are more likely to provide comprehensive support options, including braces, to ensure better recovery outcomes. With a growing focus on patient-centered care and improved healthcare delivery, this segment is set to expand significantly as providers aim to meet the increasing needs of their patients.

Regional Analysis

North America is projected to hold a significant share of the orthopedic braces and supports market, driven by advanced healthcare infrastructure, a high prevalence of orthopedic conditions, and increasing consumer awareness. The presence of key market players and a well-established network of healthcare providers enhance the availability of orthopedic support in the region. Additionally, the growing trend of sports participation and fitness activities among the population is contributing to the demand for effective orthopedic solutions. **** Europe is also expected to witness robust growth in the orthopedic braces and supports market, supported by an aging population and increasing incidence of chronic orthopedic conditions. The rise in preventive healthcare measures and physical rehabilitation practices further bolsters demand. In Asia-Pacific, rapid urbanization, increasing disposable incomes, and a growing focus on sports and physical activities are driving market growth. As healthcare access improves in these regions, the orthopedic braces and support market is set to expand significantly.

Orthopedic Braces and Supports Market Table

To Learn More About This Report - Request a Free Sample Copy

Orthopedic Braces and Supports Market Competitive Landscape

The competitive landscape of the global orthopedic braces and supports market features a mix of established companies and innovative start-ups, all vying for market share through product innovation and enhanced patient care. Key players include Johnson & Johnson, DJO Global, and Ottobock, known for their advanced orthopedic solutions and extensive product lines. Companies like Breg, Inc., and Össur are also notable competitors, offering a range of orthopedic supports tailored to various applications. Other significant players in the market include medi GmbH & Co. KG, Alcare Co., Ltd., and Hanger, Inc., each contributing to the development of high-quality braces and supports. Furthermore, strategic partnerships and collaborations among manufacturers and healthcare providers are enhancing product offerings and improving patient access. The emphasis on research and development for innovative products, along with effective marketing strategies aimed at increasing awareness, is key to maintaining a competitive edge in the orthopedic braces and supports market.

Major Players in the Global Orthopedic Braces and Supports Market

  • Johnson & Johnson
  • DJO Global
  • Ottobock
  • Breg, Inc.
  • Össur
  • medi GmbH & Co. KG
  • Alcare Co., Ltd.
  • Hanger, Inc.
  • Thuasne
  • Kinesio Holdings
  • Apex Medical Corp.
  • Stryker Corporation
  • Zimmer Biomet
  • Rheosense Inc.
  • BSN Medical

These companies are actively engaged in product development and strategic initiatives to capture a larger share of the growing orthopedic braces and support market.

Recent Development

  1. In January 2024, Enovis Corporation announced its acquisition of LimaCorporate S.p.A., a renowned company specializing in orthopedic implant solutions. This strategic acquisition significantly enhances Enovis' foothold in the global orthopedic reconstruction market, allowing it to broaden its portfolio of medical devices. LimaCorporate is well-regarded for its innovative range of orthopedic products, including various types of braces designed to support rehabilitation and recovery. By integrating Lima's advanced technologies and expertise, Enovis aims to deliver comprehensive solutions that address the diverse needs of patients undergoing orthopedic treatments. This move not only strengthens Enovis' market presence but also positions the company to better serve healthcare providers and patients alike. Furthermore, the acquisition reflects Enovis’ commitment to advancing orthopedic care through innovative and effective medical solutions, paving the way for future growth and improved patient outcomes in the orthopedic sector.
  2. In October 2023, OrthoPediatrics Corp. unveiled the DF2 Brace, a specialized device designed to assist children with musculoskeletal injuries. This innovative brace targets femur fracture fixation specifically for pediatric patients aged six months to five years, addressing a critical need in the pediatric orthopedic market. The DF2 Brace features advanced design elements that ensure optimal support and stabilization while promoting comfort for young patients. By focusing on the unique anatomical needs of children, OrthoPediatrics aims to enhance recovery outcomes and improve the overall treatment experience. This launch reflects the company’s commitment to providing effective and age-appropriate orthopedic solutions, ensuring that even the youngest patients receive the highest standard of care. With the DF2 Brace, OrthoPediatrics is poised to make a significant impact on pediatric orthopedic practices, offering parents and healthcare providers a reliable option for managing femur fractures in children.


Frequently Asked Questions (FAQ) :

Q1. What are the driving factors for the Global Orthopedic Braces And Supports Market?

The Global Orthopedic Braces and Supports Market is primarily driven by an increasing prevalence of musculoskeletal disorders and injuries, which necessitate effective treatment solutions. The aging population, particularly in developed countries, is contributing to a higher demand for orthopedic products. Additionally, growing awareness about sports-related injuries and the importance of rehabilitation has led to increased utilization of braces and supports. Technological advancements, such as the development of lightweight and comfortable materials, are also enhancing product appeal. Furthermore, the rising number of surgical procedures and favorable reimbursement policies are encouraging market growth.

Q2. What are the restraining factors for the Global Orthopedic Braces And Supports Market?

Despite its growth, the Global Orthopedic Braces and Supports Market faces several challenges. High costs associated with advanced orthopedic products can limit accessibility for certain patient demographics. Additionally, a lack of skilled professionals to prescribe and fit these devices can hinder market expansion. The market is also susceptible to stringent regulatory requirements, which can slow down the introduction of new products. Furthermore, the availability of alternative treatment options, such as physiotherapy and medication, may detract from the demand for braces and supports.

Q3. Which segment is projected to hold the largest share in the Global Orthopedic Braces And Supports Market?

The functional braces segment is projected to hold the largest share of the Global Orthopedic Braces and Supports Market. These braces are designed to provide support while allowing for some degree of movement, making them ideal for athletes and individuals recovering from injuries. The rising incidence of sports injuries, coupled with increased participation in recreational and professional sports, has driven the demand for functional braces. Additionally, advancements in materials and designs have made these products more effective and comfortable, further enhancing their market share.

Q4. Which region holds the largest share of the Global Orthopedic Braces And Supports Market?

North America holds the largest share of the Global Orthopedic Braces and Supports Market, driven by high healthcare expenditure and advanced healthcare infrastructure. The region has a significant aging population, which contributes to the prevalence of orthopedic disorders. Additionally, a strong focus on research and development in medical technology, along with the presence of leading manufacturers, has bolstered market growth. Furthermore, favorable reimbursement policies and a well-established distribution network in the U.S. and Canada have facilitated greater accessibility to orthopedic products.

Q5. Which are the prominent players in the Global Orthopedic Braces And Supports Market?

Prominent Players in the Global Orthopedic Braces and Supports Market

  • Johnson & Johnson
  • DJO Global
  • Ottobock
  • Breg, Inc.
  • Össur medi GmbH & Co.
  • KG Alcare Co., Ltd.
  • Hanger, Inc.
Chapter 1. Methodology and Scope
  • 1.1. Market Segmentation & Scope
  • 1.2. Segment Definitions
    • 1.2.1. Product
    • 1.2.2. End-use
    • 1.2.3. Regional scope
    • 1.2.4. Estimates and forecasts timeline
  • 1.3. Research Methodology
  • 1.4. Information Procurement
    • 1.4.1. Purchased database
    • 1.4.2. GVR’s internal database
    • 1.4.3. Secondary sources
    • 1.4.4. Primary research
    • 1.4.5. Details of primary research
  • 1.5. Information or Data Analysis
    • 1.5.1. Data analysis models
  • 1.6. Market Formulation & Validation
  • 1.7. Model Details
    • 1.7.1. Commodity flow analysis (Model 1)
    • 1.7.2. Approach 1: Commodity flow approach
    • 1.7.3. Volume price analysis (Model 2)
    • 1.7.4. Approach 2: Volume price analysis
  • 1.8. List of Secondary Sources
  • 1.9. List of Primary Sources
  • 1.10. Objectives
Chapter 2. Executive Summary
  • 2.1. Market Outlook
  • 2.2. Segment Outlook
    • 2.2.1. Product outlook
    • 2.2.2. End-use outlook
    • 2.2.3. Regional outlook
  • 2.3. Competitive Insights
Chapter 3. Orthopedic Braces and Supports Market Variables, Trends & Scope
  • 3.1. Market Lineage Outlook
    • 3.1.1. Parent market outlook
    • 3.1.2. Related/ancillary market outlook
  • 3.2. Market Dynamics
    • 3.2.1. Market Driver Analysis
    • 3.2.2. Market Restraint Analysis
  • 3.3. Orthopedic Braces and Supports Market Analysis Tools
    • 3.3.1. Industry Analysis - Porter’s
      • 3.3.1.1. Supplier power
      • 3.3.1.2. Buyer power
      • 3.3.1.3. Substitution threat
      • 3.3.1.4. Threat of new entrant
      • 3.3.1.5. Competitive rivalry
    • 3.3.2. PESTEL Analysis
      • 3.3.2.1. Political landscape
      • 3.3.2.2. Technological landscape
      • 3.3.2.3. Economic Landscape
    Chapter 4. Orthopedic Braces and Supports Market: Product Estimates & Trend Analysis
    • 4.1. Product Market Share, 2023 & 2030
    • 4.2. Segment Dashboard
    • 4.3. Global Orthopedic Braces and Supports Market by Product Outlook
    • 4.4. Market Size & Forecasts and Trend Analysis, 2018 to 2030 for the following
      • 4.4.1. Braces & Supports Type
        • 4.4.1.1. Knee Braces & Supports
          • 4.4.1.1.1. Market estimates and forecasts 2018 - 2030 (USD Million)
          • 4.4.1.1.2. Knee Braces for Osteoarthritis and Ligament Injuries
          • 4.4.1.1.3. Post-operational Knee Braces
          • 4.4.1.2. Back Braces & Supports
            • 4.4.1.2.1. Market estimates and forecasts 2018 - 2030 (USD Million)
            • 4.4.1.2.2. Upper Spine Orthoses
            • 4.4.1.2.3. TLSOs
            • 4.4.1.2.4. LSOs
            • 4.4.1.2.5. Others
            • 4.4.1.3. Ankle Braces & Supports
              • 4.4.1.3.1. Market estimates and forecasts 2018 - 2030 (USD Million)
              • 4.4.1.3.2. Soft Braces
              • 4.4.1.3.3. Hinged Braces
              • 4.4.1.4. Walker Boots
                • 4.4.1.4.1. Market estimates and forecasts 2018 - 2030 (USD Million)
                • 4.4.1.4.2. Pneumatic
                • 4.4.1.4.3. Non-pneumatic
                • 4.4.1.5. Upper Extremity Braces & Supports
                  • 4.4.1.5.1. Market estimates and forecasts 2018 - 2030 (USD Million)
                  • 4.4.1.5.2. Elbow Braces & Supports
                  • 4.4.1.5.3. Wrist Braces & Supports
                  • 4.4.1.5.4. Others
                  • 4.4.1.6. Hip Braces and Supports
                    • 4.4.1.6.1. Market estimates and forecasts 2018 - 2030 (USD Million)
                  • 4.4.1.7. Others
                    • 4.4.1.7.1. Market estimates and forecasts 2018 - 2030 (USD Million)
                • 4.4.2. Pain Management Products
                  • 4.4.2.1. Cold Therapy Products
                  • 4.4.2.2. Market estimates and forecasts 2018 - 2030 (USD Million)
                  • 4.4.2.3. DVT Products
                  • 4.4.2.4. Market estimates and forecasts 2018 - 2030 (USD Million)
                Chapter 5. Orthopedic Braces and Supports Market: End-use Estimates & Trend Analysis
                • 5.1. End Use Market Share, 2023 & 2030
                • 5.2. Segment Dashboard
                • 5.3. Global Orthopedic Braces and Supports Market by End-use Outlook
                • 5.4. Market Size & Forecasts and Trend Analysis, 2018 to 2030 for the following
                  • 5.4.1. Orthopedic Clinics
                    • 5.4.1.1. Market estimates and forecasts 2018 - 2030 (USD Million)
                  • 5.4.2. Over the Counter (OTC)
                    • 5.4.2.1. Market estimates and forecasts 2018 - 2030 (USD Million)
                  • 5.4.3. Hospitals
                    • 5.4.3.1. Market estimates and forecasts 2018 - 2030 (USD Million)
                  • 5.4.4. DME Dealers
                    • 5.4.4.1. Market estimates and forecasts 2018 - 2030 (USD Million)
                  • 5.4.5. Others
                    • 5.4.5.1. Market estimates and forecasts 2018 - 2030 (USD Million)
                  Chapter 6. Orthopedic Braces and Supports Market: Regional Estimates & Trend Analysis
                  • 6.1. Regional Market Share Analysis, 2023 & 2030
                  • 6.2. Regional Market Dashboard
                  • 6.3. Global Regional Market Snapshot
                  • 6.4. Market Size, & Forecasts Trend Analysis, 2018 - 2030
                  • 6.5. North America
                    • 6.5.1. U.S.
                      • 6.5.1.1. Key country dynamics
                      • 6.5.1.2. Regulatory framework/ reimbursement structure
                      • 6.5.1.3. Competitive scenario
                      • 6.5.1.4. U.S. market estimates and forecasts 2018 - 2030 (USD Million)
                    • 6.5.2. Canada
                      • 6.5.2.1. Key country dynamics
                      • 6.5.2.2. Regulatory framework/ reimbursement structure
                      • 6.5.2.3. Competitive scenario
                      • 6.5.2.4. Canada market estimates and forecasts 2018 - 2030 (USD Million)
                • 6.6. Europe
                  • 6.6.1. UK
                    • 6.6.1.1. Key country dynamics
                    • 6.6.1.2. Regulatory framework/ reimbursement structure
                    • 6.6.1.3. Competitive scenario
                    • 6.6.1.4. UK market estimates and forecasts 2018 - 2030 (USD Million)
                  • 6.6.2. Germany
                    • 6.6.2.1. Key country dynamics
                    • 6.6.2.2. Regulatory framework/ reimbursement structure
                    • 6.6.2.3. Competitive scenario
                    • 6.6.2.4. Germany market estimates and forecasts 2018 - 2030 (USD Million)
                  • 6.6.3. France
                    • 6.6.3.1. Key country dynamics
                    • 6.6.3.2. Regulatory framework/ reimbursement structure
                    • 6.6.3.3. Competitive scenario
                    • 6.6.3.4. France market estimates and forecasts 2018 - 2030 (USD Million)
                  • 6.6.4. Italy
                    • 6.6.4.1. Key country dynamics
                    • 6.6.4.2. Regulatory framework/ reimbursement structure
                    • 6.6.4.3. Competitive scenario
                    • 6.6.4.4. Italy market estimates and forecasts 2018 - 2030 (USD Million)
                  • 6.6.5. Spain
                    • 6.6.5.1. Key country dynamics
                    • 6.6.5.2. Regulatory framework/ reimbursement structure
                    • 6.6.5.3. Competitive scenario
                    • 6.6.5.4. Spain market estimates and forecasts 2018 - 2030 (USD Million)
                  • 6.6.6. Norway
                    • 6.6.6.1. Key country dynamics
                    • 6.6.6.2. Regulatory framework/ reimbursement structure
                    • 6.6.6.3. Competitive scenario
                    • 6.6.6.4. Norway market estimates and forecasts 2018 - 2030 (USD Million)
                  • 6.6.7. Sweden
                    • 6.6.7.1. Key country dynamics
                    • 6.6.7.2. Regulatory framework/ reimbursement structure
                    • 6.6.7.3. Competitive scenario
                    • 6.6.7.4. Sweden market estimates and forecasts 2018 - 2030 (USD Million)
                  • 6.6.8. Denmark
                    • 6.6.8.1. Key country dynamics
                    • 6.6.8.2. Regulatory framework/ reimbursement structure
                    • 6.6.8.3. Competitive scenario
                    • 6.6.8.4. Denmark market estimates and forecasts 2018 - 2030 (USD Million)
              • 6.7. Asia Pacific
                • 6.7.1. Japan
                  • 6.7.1.1. Key country dynamics
                  • 6.7.1.2. Regulatory framework/ reimbursement structure
                  • 6.7.1.3. Competitive scenario
                  • 6.7.1.4. Japan market estimates and forecasts 2018 - 2030 (USD Million)
                • 6.7.2. China
                  • 6.7.2.1. Key country dynamics
                  • 6.7.2.2. Regulatory framework/ reimbursement structure
                  • 6.7.2.3. Competitive scenario
                  • 6.7.2.4. China market estimates and forecasts 2018 - 2030 (USD Million)
                • 6.7.3. India
                  • 6.7.3.1. Key country dynamics
                  • 6.7.3.2. Regulatory framework/ reimbursement structure
                  • 6.7.3.3. Competitive scenario
                  • 6.7.3.4. India market estimates and forecasts 2018 - 2030 (USD Million)
                • 6.7.4. Australia
                  • 6.7.4.1. Key country dynamics
                  • 6.7.4.2. Regulatory framework/ reimbursement structure
                  • 6.7.4.3. Competitive scenario
                  • 6.7.4.4. Australia market estimates and forecasts 2018 - 2030 (USD Million)
                • 6.7.5. South Korea
                  • 6.7.5.1. Key country dynamics
                  • 6.7.5.2. Regulatory framework/ reimbursement structure
                  • 6.7.5.3. Competitive scenario
                  • 6.7.5.4. South Korea market estimates and forecasts 2018 - 2030 (USD Million)
                • 6.7.6. Thailand
                  • 6.7.6.1. Key country dynamics
                  • 6.7.6.2. Regulatory framework/ reimbursement structure
                  • 6.7.6.3. Competitive scenario
                  • 6.7.6.4. Thailand market estimates and forecasts 2018 - 2030 (USD Million)
            • 6.8. Latin America
              • 6.8.1. Brazil
                • 6.8.1.1. Key country dynamics
                • 6.8.1.2. Regulatory framework/ reimbursement structure
                • 6.8.1.3. Competitive scenario
                • 6.8.1.4. Brazil market estimates and forecasts 2018 - 2030 (USD Million)
              • 6.8.2. Mexico
                • 6.8.2.1. Key country dynamics
                • 6.8.2.2. Regulatory framework/ reimbursement structure
                • 6.8.2.3. Competitive scenario
                • 6.8.2.4. Mexico market estimates and forecasts 2018 - 2030 (USD Million)
              • 6.8.3. Argentina
                • 6.8.3.1. Key country dynamics
                • 6.8.3.2. Regulatory framework/ reimbursement structure
                • 6.8.3.3. Competitive scenario
                • 6.8.3.4. Argentina market estimates and forecasts 2018 - 2030 (USD Million)
          • 6.9. MEA
            • 6.9.1. South Africa
              • 6.9.1.1. Key country dynamics
              • 6.9.1.2. Regulatory framework/ reimbursement structure
              • 6.9.1.3. Competitive scenario
              • 6.9.1.4. South Africa market estimates and forecasts 2018 - 2030 (USD Million)
            • 6.9.2. Saudi Arabia
              • 6.9.2.1. Key country dynamics
              • 6.9.2.2. Regulatory framework/ reimbursement structure
              • 6.9.2.3. Competitive scenario
              • 6.9.2.4. Saudi Arabia market estimates and forecasts 2018 - 2030 (USD Million)
            • 6.9.3. UAE
              • 6.9.3.1. Key country dynamics
              • 6.9.3.2. Regulatory framework/ reimbursement structure
              • 6.9.3.3. Competitive scenario
              • 6.9.3.4. UAE market estimates and forecasts 2018 - 2030 (USD Million)
            • 6.9.4. Kuwait
              • 6.9.4.1. Key country dynamics
              • 6.9.4.2. Regulatory framework/ reimbursement structure
              • 6.9.4.3. Competitive scenario
              • 6.9.4.4. Kuwait market estimates and forecasts 2018 - 2030 (USD Million)
            Chapter 7. Competitive Landscape
            • 7.1. Recent Developments & Impact Analysis, By Key Market Participants
            • 7.2. Company/Competition Categorization
            • 7.3. List of Orthopedic Brace Suppliers
            • 7.4. Vendor Landscape
              • 7.4.1. List of key distributors and channel partners
              • 7.4.2. Key customers
              • 7.4.3. Key company market share analysis, 2023
              • 7.4.4. Breg, Inc.
                • 7.4.4.1. Company overview
                • 7.4.4.2. Financial performance
                • 7.4.4.3. Product benchmarking
                • 7.4.4.4. Strategic initiatives
              • 7.4.5. Frank Stubbs Company Inc.
                • 7.4.5.1. Company overview
                • 7.4.5.2. Financial performance
                • 7.4.5.3. Product benchmarking
                • 7.4.5.4. Strategic initiatives
              • 7.4.6. DeRoyal Industries, Inc.
                • 7.4.6.1. Company overview
                • 7.4.6.2. Financial performance
                • 7.4.6.3. Product benchmarking
                • 7.4.6.4. Strategic initiatives
              • 7.4.7. Össur
                • 7.4.7.1. Company overview
                • 7.4.7.2. Financial performance
                • 7.4.7.3. Product benchmarking
                • 7.4.7.4. Strategic initiatives
              • 7.4.8. Fillauer LLC
                • 7.4.8.1. Company overview
                • 7.4.8.2. Financial performance
                • 7.4.8.3. Product benchmarking
                • 7.4.8.4. Strategic initiatives
              • 7.4.9. Ottobock
                • 7.4.9.1. Company overview
                • 7.4.9.2. Financial performance
                • 7.4.9.3. Product benchmarking
                • 7.4.9.4. Strategic initiatives
              • 7.4.10. McDavid
                • 7.4.10.1. Company overview
                • 7.4.10.2. Financial performance
                • 7.4.10.3. Product benchmarking
                • 7.4.10.4. Strategic initiatives
              • 7.4.11. Bauerfeind
                • 7.4.11.1. Company overview
                • 7.4.11.2. Financial performance
                • 7.4.11.3. Product benchmarking
                • 7.4.11.4. Strategic initiatives
              • 7.4.12. Weber Orthopedic LP.
                • 7.4.12.1. Company overview
                • 7.4.12.2. Financial performance
                • 7.4.12.3. Product benchmarking
                • 7.4.12.4. Strategic initiatives
              • 7.4.13. DJO, LLC
                • 7.4.13.1. Company overview
                • 7.4.13.2. Financial performance
                • 7.4.13.3. Product benchmarking
Fig. 1 Market research process
Fig. 2 Data triangulation techniques
Fig. 3 Primary research pattern
Fig. 4 Market research approaches
Fig. 5 Value-chain-based sizing & forecasting
Fig. 6 QFD modeling for market share assessment
Fig. 7 Market formulation & validation
Fig. 8 Orthopedic braces and supports market: market outlook
Fig. 9 Orthopedic braces and supports competitive insights
Fig. 10 Parent market outlook
Fig. 11 Related/ancillary market outlook
Fig. 12 Penetration and growth prospect mapping
Fig. 13 Industry value chain analysis
Fig. 14 Orthopedic braces and supports market driver impact
Fig. 15 Orthopedic braces and supports market restraint impact
Fig. 16 Orthopedic braces and supports market strategic initiatives analysis
Fig. 17 Orthopedic braces and supports market: Product movement analysis
Fig. 18 Orthopedic braces and supports market: Product outlook and key takeaways
Fig. 19 Braces & Supports Type market estimates and forecasts, 2018 - 2030
Fig. 20 Knee Braces & Supports market estimates and forecasts, 2018 - 2030
Fig. 21 Knee Braces for Osteoarthritis and Ligament Injuries market estimates and forecasts, 2018 - 2030
Fig. 22 Post-operational Knee Braces market estimates and forecasts, 2018 - 2030
Fig. 23 Back Braces & Supports market estimates and forecasts, 2018 - 2030
Fig. 24 Upper Spine Orthoses market estimates and forecasts, 2018 - 2030
Fig. 25 TLSOs market estimates and forecasts, 2018 - 2030
Fig. 26 LSOs market estimates and forecasts, 2018 - 2030
Fig. 27 Others market estimates and forecasts, 2018 - 2030
Fig. 28 Ankle Braces & Supports market estimates and forecasts, 2018 - 2030
Fig. 29 Soft Braces market estimates and forecasts, 2018 - 2030
Fig. 30 Hinged Braces market estimates and forecasts, 2018 - 2030
Fig. 31 Walker Boots market estimates and forecasts, 2018 - 2030
Fig. 32 Pneumatic market estimates and forecasts, 2018 - 2030
Fig. 33 Non-pneumatic market estimates and forecasts, 2018 - 2030
Fig. 34 Upper Extremity Braces & Supports market estimates and forecasts, 2018 - 2030
Fig. 35 Elbow Braces & Supports market estimates and forecasts, 2018 - 2030
Fig. 36 Wrist Braces & Supports market estimates and forecasts, 2018 - 2030
Fig. 37 Others market estimates and forecasts, 2018 - 2030
Fig. 38 Hip Braces and Supports market estimates and forecasts, 2018 - 2030
Fig. 39 Others Braces and Supports market estimates and forecasts, 2018 - 2030
Fig. 40 Pain Management Products market estimates and forecasts, 2018 - 2030
Fig. 41 Cold Therapy Products market estimates and forecasts, 2018 - 2030
Fig. 42 DVT Products market estimates and forecasts, 2018 - 2030
Fig. 43 Orthopedic braces and supports Market: End-use movement Analysis
Fig. 44 Orthopedic braces and supports market: End-use outlook and key takeaways
Fig. 45 Orthopedic Clinics market estimates and forecasts, 2018 - 2030
Fig. 46 Over the Counter (OTC) market estimates and forecasts,2018 - 2030
Fig. 47 Hospitals market estimates and forecasts,2018 - 2030
Fig. 48 DME Dealers market estimates and forecasts,2018 - 2030
Fig. 49 Others market estimates and forecasts,2018 - 2030
Fig. 50 Global Orthopedic braces and supports market: Regional movement analysis
Fig. 51 Global Orthopedic braces and supports market: Regional outlook and key takeaways
Fig. 52 North America: SWOT
Fig. 53 Europe SWOT
Fig. 54 Asia Pacific SWOT
Fig. 55 Latin America SWOT
Fig. 56 MEA SWOT
Fig. 57 North America
Fig. 58 North America market estimates and forecasts, 2018 - 2030
Fig. 59 U.S.
Fig. 60 U.S. market estimates and forecasts, 2018 - 2030
Fig. 61 Canada
Fig. 62 Canada market estimates and forecasts, 2018 - 2030
Fig. 63 Europe
Fig. 64 Europe market estimates and forecasts, 2018 - 2030
Fig. 65 UK
Fig. 66 UK market estimates and forecasts, 2018 - 2030
Fig. 67 Germany
Fig. 68 Germany market estimates and forecasts, 2018 - 2030
Fig. 69 France
Fig. 70 France market estimates and forecasts, 2018 - 2030
Fig. 71 Italy
Fig. 72 Italy market estimates and forecasts, 2018 - 2030
Fig. 73 Spain
Fig. 74 Spain market estimates and forecasts, 2018 - 2030
Fig. 75 Denmark
Fig. 76 Denmark market estimates and forecasts, 2018 - 2030
Fig. 77 Sweden
Fig. 78 Sweden market estimates and forecasts, 2018 - 2030
Fig. 79 Norway
Fig. 80 Norway market estimates and forecasts, 2018 - 2030
Fig. 81 Asia Pacific
Fig. 82 Asia Pacific market estimates and forecasts, 2018 - 2030
Fig. 83 China
Fig. 84 China market estimates and forecasts, 2018 - 2030
Fig. 85 Japan
Fig. 86 Japan market estimates and forecasts, 2018 - 2030
Fig. 87 India
Fig. 88 India market estimates and forecasts, 2018 - 2030
Fig. 89 Thailand
Fig. 90 Thailand market estimates and forecasts, 2018 - 2030
Fig. 91 South Korea
Fig. 92 South Korea market estimates and forecasts, 2018 - 2030
Fig. 93 Australia
Fig. 94 Australia market estimates and forecasts, 2018 - 2030
Fig. 95 Latin America
Fig. 96 Latin America market estimates and forecasts, 2018 - 2030
Fig. 97 Brazil
Fig. 98 Brazil market estimates and forecasts, 2018 - 2030
Fig. 99 Mexico
Fig. 100 Mexico market estimates and forecasts, 2018 - 2030
Fig. 101 Argentina
Fig. 102 Argentina market estimates and forecasts, 2018 - 2030
Fig. 103 Middle East and Africa
Fig. 104 Middle East and Africa market estimates and forecasts, 2018 - 2030
Fig. 105 South Africa
Fig. 106 South Africa market estimates and forecasts, 2018 - 2030
Fig. 107 Saudi Arabia
Fig. 108 Saudi Arabia market estimates and forecasts, 2018 - 2030
Fig. 109 UAE
Fig. 110 UAE market estimates and forecasts, 2018 - 2030
Fig. 111 Kuwait
Fig. 112 Kuwait market estimates and forecasts, 2018 - 2030
Fig. 113 Market share of key market players- Orthopedic braces and supports market
Research Process

Data Library Research are conducted by industry experts who offer insight on industry structure, market segmentations technology assessment and competitive landscape (CL), and penetration, as well as on emerging trends. Their analysis is based on primary interviews (~ 80%) and secondary research (~ 20%) as well as years of professional expertise in their respective industries. Adding to this, by analysing historical trends and current market positions, our analysts predict where the market will be headed for the next five years. Furthermore, the varying trends of segment & categories geographically presented are also studied and the estimated based on the primary & secondary research.

In this particular report from the supply side Data Library Research has conducted primary surveys (interviews) with the key level executives (VP, CEO’s, Marketing Director, Business Development Manager and SOFT) of the companies that active & prominent as well as the midsized organization

FIGURE 1: DLR RESEARH PROCESS

research-methodology1

Primary Research

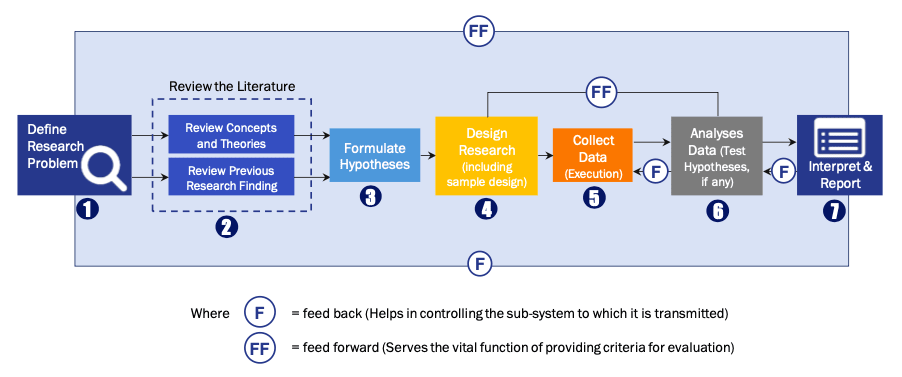
Extensive primary research was conducted to gain a deeper insight of the market and industry performance. The analysis is based on both primary and secondary research as well as years of professional expertise in the respective industries.

In addition to analysing current and historical trends, our analysts predict where the market is headed over the next five years.

It varies by segment for these categories geographically presented in the list of market tables. Speaking about this particular report we have conducted primary surveys (interviews) with the key level executives (VP, CEO’s, Marketing Director, Business Development Manager and many more) of the major players active in the market.

Secondary Research

Secondary research was mainly used to collect and identify information useful for the extensive, technical, market-oriented, and Friend’s study of the Global Extra Neutral Alcohol. It was also used to obtain key information about major players, market classification and segmentation according to the industry trends, geographical markets, and developments related to the market and technology perspectives. For this study, analysts have gathered information from various credible sources, such as annual reports, sec filings, journals, white papers, SOFT presentations, and company web sites.

Market Size Estimation

Both, top-down and bottom-up approaches were used to estimate and validate the size of the Global market and to estimate the size of various other dependent submarkets in the overall Extra Neutral Alcohol. The key players in the market were identified through secondary research and their market contributions in the respective geographies were determined through primary and secondary research.

Forecast Model

research-methodology2

Happy to Assist You

If you have a question?

[email protected]

IND : +91 955 279 0357

Browse Related Reports