Silicon Metal Market Overview and Definition

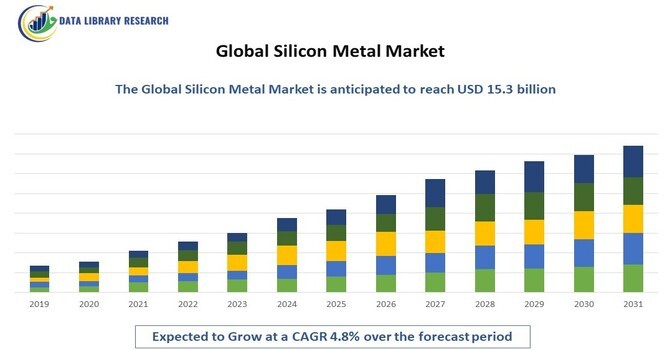
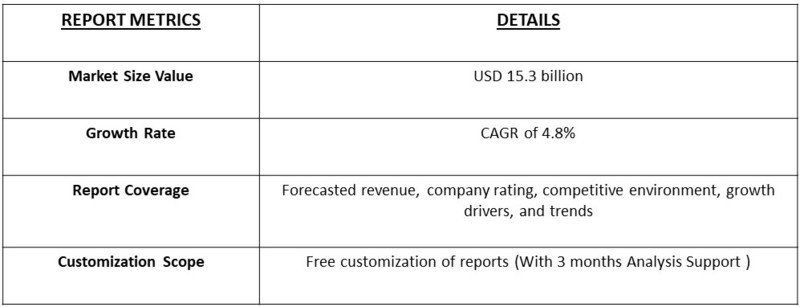
The global silicon metal market is anticipated to reach a market value of USD 10.7 billion in 2023 and is projected to grow to USD 15.3 billion by 2031, with a compound annual growth rate (CAGR) of 4.8% from 2023 to 2031.

Silicon Metal Market

Get Complete Analysis Of The Report - Download Free Sample PDF

This growth is driven by increasing demand in various industries, particularly in the production of aluminum, solar cells, and silicones, alongside advancements in production technologies and rising awareness of silicon's versatile applications.

Silicon metal is a key raw material primarily used in the manufacturing of aluminum alloys, solar panels, and silicones. It is produced through the reduction of silica in a furnace, yielding a high-purity product. Silicon's unique properties, such as high melting point, thermal conductivity, and corrosion resistance, make it an essential component in numerous applications, from construction materials to electronics and renewable energy.

The global silicon metal market is propelled by several key factors, including the growing demand for lightweight and energy-efficient materials in the automotive and aerospace sectors, increased investments in renewable energy sources, particularly solar power, and the rising usage of silicones in construction and consumer goods. Moreover, the expansion of electric vehicle (EV) production and advancements in battery technology further amplify the demand for silicon metal, as it is increasingly used in battery anodes. As a result, the silicon metal market is expected to witness robust growth over the coming years.

Silicon Metal Market Trends

The global silicon metal market is characterized by several notable trends shaping its future. One prominent trend is the rising demand for sustainable and environmentally friendly materials, driving manufacturers to explore innovative production methods and alternative raw materials. Additionally, advancements in silicon production technologies, including cleaner and more efficient processes, are gaining traction.

There is also an increasing focus on the integration of silicon metal in energy storage solutions, particularly in the burgeoning electric vehicle market, where silicon anodes are being explored to enhance battery performance. Moreover, as the construction industry continues to evolve, the demand for high-performance silicones in construction applications is rising, reflecting a shift towards modern building materials. Furthermore, the growing interest in renewable energy technologies, particularly solar photovoltaic systems, is expected to drive silicon metal consumption in the coming years, positioning the market for continued expansion.

Market Segmentation

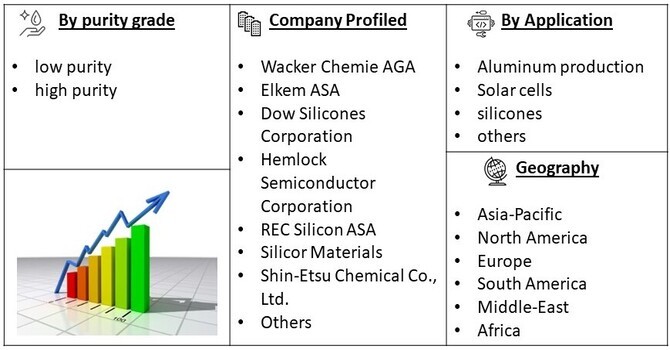
The global silicon metal market is segmented by application (aluminum production, solar cells, silicones, and others), by purity grade (low purity, high purity), and by geography (North America, Europe, Asia-Pacific, South America, and the Middle East and Africa). The report provides market size and forecasts for revenue (USD million) for all these segments.

Silicon Metal Market Segment

For Detailed Market Segmentation - Get a Free Sample PDF

Market Drivers

  • Increasing Demand from the Aluminum Industry

The rising demand for aluminum, driven by its lightweight and corrosion-resistant properties, is a significant driver for the silicon metal market. Silicon metal is a key alloying agent in aluminum production, improving the strength and durability of aluminum products used in transportation, construction, and packaging industries. As the global aluminum market expands, particularly in the automotive and aerospace sectors, the demand for silicon metal is expected to increase correspondingly.

  • Growth in Renewable Energy Sector

The global push towards renewable energy sources, particularly solar power, is fueling the demand for silicon metal. Silicon is the primary material used in the production of solar photovoltaic (PV) cells. As governments and organizations worldwide invest in solar energy to reduce carbon emissions and promote sustainability, the consumption of silicon metal is set to rise. This trend is reinforced by technological advancements that enhance the efficiency and affordability of solar panels, further solidifying silicon’s position in the renewable energy landscape.

  • Advancements in Technology

Ongoing innovations in silicon production technologies are enhancing the efficiency and sustainability of silicon metal manufacturing. The development of cleaner production processes, such as the use of renewable energy in silicon production, is gaining momentum. These advancements not only reduce the environmental impact of silicon production but also improve profit margins for manufacturers, making silicon metal an increasingly attractive material for various applications.

Market Restraints

  • Fluctuating Raw Material Prices

The silicon metal market faces challenges due to the volatility of raw material prices, particularly silica. Price fluctuations can impact the profitability of silicon producers and may lead to increased costs for end-users. Such unpredictability in pricing can deter investments in the silicon sector and hinder market growth. Environmental Concerns

The production of silicon metal involves significant energy consumption and carbon emissions, raising environmental concerns among regulators and consumers. As sustainability becomes a critical focus for industries worldwide, producers may face pressure to adopt greener practices and reduce their carbon footprint. Failure to comply with environmental regulations can lead to operational challenges and impact market growth.

COVID-19 Impact On the Silicon Metal Market

The COVID-19 pandemic had a notable impact on the global silicon metal market, disrupting supply chains and production capabilities. Lockdowns led to reduced manufacturing output, particularly in sectors like automotive and electronics, which are key consumers of silicon. Consequently, demand fluctuated, causing price volatility. However, as economies began to recover, the push for renewable energy technologies and electric vehicles spurred renewed interest in silicon for photovoltaic cells and battery applications. Additionally, the pandemic accelerated trends toward digitization and technological advancement, further driving demand for silicon in electronics. Overall, while the market faced short-term challenges, the long-term outlook remains positive, supported by increasing applications in sustainable technologies.

Segmental Analysis

  • High Purity Silicon Metal Segment Expected to Witness Significant Growth

The high purity silicon metal segment is anticipated to experience substantial growth over the forecast period. This segment is primarily driven by the increasing demand for high-performance materials in the electronics and solar industries. High purity silicon is essential for producing high-efficiency solar cells and advanced semiconductor devices, which are crucial for the growing renewable energy and electronics sectors. Additionally, advancements in purification technologies and the increasing trend towards miniaturization in electronics further bolster the demand for high purity silicon metal.

  • Aluminum Production Segment Expected to Lead

The aluminum production segment is projected to hold the largest share of the global silicon metal market. As the demand for lightweight and durable aluminum products continues to rise in various industries, particularly in automotive and construction, silicon metal’s role as an alloying agent becomes increasingly important. The ongoing growth of the aluminum market, fueled by the shift towards energy-efficient and sustainable materials, ensures a steady demand for silicon metal in aluminum manufacturing.

  • Asia-Pacific Expected to Dominate the Market

The Asia-Pacific region is expected to dominate the global silicon metal market, driven by rapid industrialization, rising demand for aluminum, and significant investments in renewable energy projects, particularly solar power. Countries such as China and India are major contributors to the regional market, with their expanding manufacturing sectors and growing population driving demand for silicon metal in various applications. Furthermore, the increasing focus on sustainable energy solutions in these countries is likely to bolster the demand for silicon in solar panel production.

Silicon Metal Market Table

To Learn More About This Report - Request a Free Sample Copy

Silicon Metal Market Competitive Landscape

The competitive landscape of the global silicon metal market features a mix of established players and emerging companies striving for market share through innovation, sustainability initiatives, and enhanced product offerings.

Key industry leaders include:

  • Wacker Chemie AGA
  • Elkem ASA
  • Dow Silicones Corporation
  • Hemlock Semiconductor Corporation
  • REC Silicon ASA
  • Silicor Materials
  • Shin-Etsu Chemical Co., Ltd
  • Norsk Hydro ASA
  • China National BlueStar (Group) Co., Ltd.
  • Mitsubishi Materials Corporation
  • Qinghai Yangguang Silicon Co., Ltd.
  • Daqo New Energy Corp
  • GCL-Poly Energy Holdings Limited
  • SunEdison, Inc.
  • Wuxi Shangji Automation Co., Ltd.

Recent Developments

  1. In March 2024, Wacker Chemie AG announced the expansion of its high-purity silicon production facilities in Tennessee, USA, to meet the growing demand from the solar and semiconductor industries. This investment aims to increase capacity and enhance the company’s competitive position in the global silicon market.
  2. In May 2024, Elkem ASA launched a new line of eco-friendly silicone products designed for the construction industry. This innovative range focuses on sustainability, utilizing renewable materials and cleaner production methods, reflecting the company’s commitment to environmental responsibility.


Frequently Asked Questions (FAQ) :

Q1. What are the driving factors for the Global Silicon Metal Market?

The global silicon metal market is driven by the increasing demand from the aluminum industry, growth in the renewable energy sector, particularly solar power, and advancements in production technologies that enhance efficiency and sustainability.

Q2. What are the restraining factors for the Global Silicon Metal Market?

The market faces challenges such as fluctuating raw material prices, environmental concerns related to production emissions, and competition from alternative materials and technologies.

Q3. Which segment is projected to hold the largest share in the Global Silicon Metal Market?

The aluminum production segment is projected to hold the largest share, driven by the growing demand for lightweight and durable aluminum products across various industries.

Q4. Which region holds the largest share of the Global Silicon Metal Market?

The Asia-Pacific region is expected to hold the largest share, fueled by rapid industrialization, investments in renewable energy, and significant demand for aluminum products.

Q5. Which are the prominent players in the Global Silicon Metal Market?

Key players include Wacker Chemie AG, Elkem ASA, Dow Silicones Corporation, Hemlock Semiconductor Corporation, REC Silicon ASA, Silicor Materials, Shin-Etsu Chemical Co., Ltd., Norsk Hydro ASA, China National BlueStar (Group) Co., Ltd., Mitsubishi Materials Corporation, Qinghai Yangguang Silicon Co., Ltd., Daqo New Energy Corp., GCL-Poly Energy Holdings Limited, SunEdison, Inc., and Wuxi Shangji Automation Co., Ltd.

1. EXECUTIVE SUMMARY

  • 1.1. Market Overview
  • 1.2. Key Findings
  • 1.3. Market Segmentation
  • 1.4. Competitive Landscape
  • 1.5. Challenges and Opportunities
  • 1.6. Future Outlook

2. MARKET INTRODUCTION

  • 2.1. Definition
  • 2.2. Scope of the study
    • 2.2.1. Research Objective
    • 2.2.2. Assumption
    • 2.2.3. Limitations

3. RESEARCH METHODOLOGY

  • 3.1. Overview
  • 3.2. Data Mining
  • 3.3. Secondary Research
  • 3.4. Primary Research
    • 3.4.1. Primary Interviews and Information Gathering Process
    • 3.4.2. Breakdown of Primary Respondents
  • 3.5. Forecasting Model
  • 3.6. Market Size Estimation
    • 3.6.1. Bottom-Up Approach
    • 3.6.2. Top-Down Approach
  • 3.7. Data Triangulation
  • 3.8. Validation

4. MARKET DYNAMICS

  • 4.1. Overview
  • 4.2. Drivers
  • 4.3. Restraints
  • 4.4. Opportunities

5. MARKET FACTOR ANALYSIS

  • 5.1. Value chain Analysis
  • 5.2. Porter's Five Forces Analysis
    • 5.2.1. Bargaining Power of Suppliers
    • 5.2.2. Bargaining Power of Buyers
    • 5.2.3. Threat of New Entrants
    • 5.2.4. Threat of Substitutes
    • 5.2.5. Intensity of Rivalry
  • 5.3. COVID-19 Impact Analysis
    • 5.3.1. Market Impact Analysis
    • 5.3.2. Regional Impact
    • 5.3.3. Opportunity and Threat Analysis

6. SILICON METAL MARKET, BY PURITY (USD BILLION)

  • 6.1. 95-99%
  • 6.2. 99-99.95%
  • 6.3. 99.95-99.99%
  • 6.4. 99.99% and above

7. SILICON METAL MARKET, BY GRANULARITY (USD BILLION)

  • 7.1. Lump
  • 7.2. Granular
  • 7.3. Powders

8. SILICON METAL MARKET, BY END-USE APPLICATION (USD BILLION)

  • 8.1. Photovoltaic Industry
  • 8.2. Semiconductors
  • 8.3. Chemical Industry
  • 8.4. Aluminum Alloys
  • 8.5. Others

9. SILICON METAL MARKET, BY PRODUCTION PROCESS (USD BILLION)

  • 9.1. Silica Reduction
  • 9.2. Magnetothermal Process
  • 9.3. Other Less Common Processes

10. SILICON METAL MARKET, BY REGIONAL (USD BILLION)

  • 10.1. North America
    • 10.1.1. US
    • 10.1.2. Canada
  • 10.2. Europe
    • 10.2.1. Germany
    • 10.2.2. UK
    • 10.2.3. France
    • 10.2.4. Russia
    • 10.2.5. Italy
    • 10.2.6. Spain
    • 10.2.7. Rest of Europe
  • 10.3. APAC
    • 10.3.1. China
    • 10.3.2. India
    • 10.3.3. Japan
    • 10.3.4. South Korea
    • 10.3.5. Malaysia
    • 10.3.6. Thailand
    • 10.3.7. Indonesia
    • 10.3.8. Rest of APAC
  • 10.4. South America
    • 10.4.1. Brazil
    • 10.4.2. Mexico
    • 10.4.3. Argentina
    • 10.4.4. Rest of South America
  • 10.5. MEA
    • 10.5.1. GCC Countries
    • 10.5.2. South Africa
    • 10.5.3. Rest of MEA

11. COMPETITIVE LANDSCAPE

  • 11.1. Overview
  • 11.2. Competitive Analysis
  • 11.3. Market share Analysis
  • 11.4. Major Growth Strategy in the Silicon Metal Market
  • 11.5. Competitive Benchmarking
  • 11.6. Leading Players in Terms of Number of Developments in the Silicon Metal Market
  • 11.7. Key developments and growth strategies
    • 11.7.1. New Product Launch/Service Deployment
    • 11.7.2. Merger & Acquisitions
    • 11.7.3. Joint Ventures
  • 11.8. Major Players Financial Matrix
    • 11.8.1. Sales and Operating Income
    • 11.8.2. Major Players R&D Expenditure. 2023

12. COMPANY PROFILES

  • 12.1. Mitsubishi Materials Corporation
    • 12.1.1. Financial Overview
    • 12.1.2. Products Offered
    • 12.1.3. Key Developments
    • 12.1.4. SWOT Analysis
    • 12.1.5. Key Strategies
  • 12.2. SK Siltron
    • 12.2.1. Financial Overview
    • 12.2.2. Products Offered
    • 12.2.3. Key Developments
    • 12.2.4. SWOT Analysis
    • 12.2.5. Key Strategies
  • 12.3. Wacker Chemie AG
    • 12.3.1. Financial Overview
    • 12.3.2. Products Offered
    • 12.3.3. Key Developments
    • 12.3.4. SWOT Analysis
    • 12.3.5. Key Strategies
  • 12.4. Sichuan Yonghan Technology Co. Ltd.
    • 12.4.1. Financial Overview
    • 12.4.2. Products Offered
    • 12.4.3. Key Developments
    • 12.4.4. SWOT Analysis
    • 12.4.5. Key Strategies
  • 12.5. GCLPoly
    • 12.5.1. Financial Overview
    • 12.5.2. Products Offered
    • 12.5.3. Key Developments
    • 12.5.4. SWOT Analysis
    • 12.5.5. Key Strategies
  • 12.6. REC Silicon ASA
    • 12.6.1. Financial Overview
    • 12.6.2. Products Offered
    • 12.6.3. Key Developments
    • 12.6.4. SWOT Analysis
    • 12.6.5. Key Strategies
  • 12.7. Elkem
    • 12.7.1. Financial Overview
    • 12.7.2. Products Offered
    • 12.7.3. Key Developments
    • 12.7.4. SWOT Analysis
    • 12.7.5. Key Strategies
  • 12.8. Tokuyama Corporation
    • 12.8.1. Financial Overview
    • 12.8.2. Products Offered
    • 12.8.3. Key Developments
    • 12.8.4. SWOT Analysis
    • 12.8.5. Key Strategies
  • 12.9. Yibin Tianyuan New Material Technology
    • 12.9.1. Financial Overview
    • 12.9.2. Products Offered
    • 12.9.3. Key Developments
    • 12.9.4. SWOT Analysis
    • 12.9.5. Key Strategies
  • 12.10. Ferroglobe
    • 12.10.1. Financial Overview
    • 12.10.2. Products Offered
    • 12.10.3. Key Developments
    • 12.10.4. SWOT Analysis
    • 12.10.5. Key Strategies
  • 12.11. OCI Company Ltd.
    • 12.11.1. Financial Overview
    • 12.11.2. Products Offered
    • 12.11.3. Key Developments
    • 12.11.4. SWOT Analysis
    • 12.11.5. Key Strategies
  • 12.12. Sumitomo Chemical Co. Ltd.
    • 12.12.1. Financial Overview
    • 12.12.2. Products Offered
    • 12.12.3. Key Developments
    • 12.12.4. SWOT Analysis
    • 12.12.5. Key Strategies
  • 12.13. Hemlock Semiconductor
    • 12.13.1. Financial Overview
    • 12.13.2. Products Offered
    • 12.13.3. Key Developments
    • 12.13.4. SWOT Analysis
    • 12.13.5. Key Strategies
  • 12.14. Hoshine Silicon Industry Co. Ltd.
    • 12.14.1. Financial Overview
    • 12.14.2. Products Offered
    • 12.14.3. Key Developments
    • 12.14.4. SWOT Analysis
    • 12.14.5. Key Strategies

13. APPENDIX

  • 13.1. References
FIGURE 1. MARKET SYNOPSIS
FIGURE 2. NORTH AMERICA SILICON METAL MARKET ANALYSIS
FIGURE 3. US SILICON METAL MARKET ANALYSIS BY PURITY
FIGURE 4. US SILICON METAL MARKET ANALYSIS BY GRANULARITY
FIGURE 5. US SILICON METAL MARKET ANALYSIS BY END-USE APPLICATION
FIGURE 6. US SILICON METAL MARKET ANALYSIS BY PRODUCTION PROCESS
FIGURE 7. US SILICON METAL MARKET ANALYSIS BY REGIONAL
FIGURE 8. CANADA SILICON METAL MARKET ANALYSIS BY PURITY
FIGURE 9. CANADA SILICON METAL MARKET ANALYSIS BY GRANULARITY
FIGURE 10. CANADA SILICON METAL MARKET ANALYSIS BY END-USE APPLICATION
FIGURE 11. CANADA SILICON METAL MARKET ANALYSIS BY PRODUCTION PROCESS
FIGURE 12. CANADA SILICON METAL MARKET ANALYSIS BY REGIONAL
FIGURE 13. EUROPE SILICON METAL MARKET ANALYSIS
FIGURE 14. GERMANY SILICON METAL MARKET ANALYSIS BY PURITY
FIGURE 15. GERMANY SILICON METAL MARKET ANALYSIS BY GRANULARITY
FIGURE 16. GERMANY SILICON METAL MARKET ANALYSIS BY END-USE APPLICATION
FIGURE 17. GERMANY SILICON METAL MARKET ANALYSIS BY PRODUCTION PROCESS
FIGURE 18. GERMANY SILICON METAL MARKET ANALYSIS BY REGIONAL
FIGURE 19. UK SILICON METAL MARKET ANALYSIS BY PURITY
FIGURE 20. UK SILICON METAL MARKET ANALYSIS BY GRANULARITY
FIGURE 21. UK SILICON METAL MARKET ANALYSIS BY END-USE APPLICATION
FIGURE 22. UK SILICON METAL MARKET ANALYSIS BY PRODUCTION PROCESS
FIGURE 23. UK SILICON METAL MARKET ANALYSIS BY REGIONAL
FIGURE 24. FRANCE SILICON METAL MARKET ANALYSIS BY PURITY
FIGURE 25. FRANCE SILICON METAL MARKET ANALYSIS BY GRANULARITY
FIGURE 26. FRANCE SILICON METAL MARKET ANALYSIS BY END-USE APPLICATION
FIGURE 27. FRANCE SILICON METAL MARKET ANALYSIS BY PRODUCTION PROCESS
FIGURE 28. FRANCE SILICON METAL MARKET ANALYSIS BY REGIONAL
FIGURE 29. RUSSIA SILICON METAL MARKET ANALYSIS BY PURITY
FIGURE 30. RUSSIA SILICON METAL MARKET ANALYSIS BY GRANULARITY
FIGURE 31. RUSSIA SILICON METAL MARKET ANALYSIS BY END-USE APPLICATION
FIGURE 32. RUSSIA SILICON METAL MARKET ANALYSIS BY PRODUCTION PROCESS
FIGURE 33. RUSSIA SILICON METAL MARKET ANALYSIS BY REGIONAL
FIGURE 34. ITALY SILICON METAL MARKET ANALYSIS BY PURITY
FIGURE 35. ITALY SILICON METAL MARKET ANALYSIS BY GRANULARITY
FIGURE 36. ITALY SILICON METAL MARKET ANALYSIS BY END-USE APPLICATION
FIGURE 37. ITALY SILICON METAL MARKET ANALYSIS BY PRODUCTION PROCESS
FIGURE 38. ITALY SILICON METAL MARKET ANALYSIS BY REGIONAL
FIGURE 39. SPAIN SILICON METAL MARKET ANALYSIS BY PURITY
FIGURE 40. SPAIN SILICON METAL MARKET ANALYSIS BY GRANULARITY
FIGURE 41. SPAIN SILICON METAL MARKET ANALYSIS BY END-USE APPLICATION
FIGURE 42. SPAIN SILICON METAL MARKET ANALYSIS BY PRODUCTION PROCESS
FIGURE 43. SPAIN SILICON METAL MARKET ANALYSIS BY REGIONAL
FIGURE 44. REST OF EUROPE SILICON METAL MARKET ANALYSIS BY PURITY
FIGURE 45. REST OF EUROPE SILICON METAL MARKET ANALYSIS BY GRANULARITY
FIGURE 46. REST OF EUROPE SILICON METAL MARKET ANALYSIS BY END-USE APPLICATION
FIGURE 47. REST OF EUROPE SILICON METAL MARKET ANALYSIS BY PRODUCTION PROCESS
FIGURE 48. REST OF EUROPE SILICON METAL MARKET ANALYSIS BY REGIONAL
FIGURE 49. APAC SILICON METAL MARKET ANALYSIS
FIGURE 50. CHINA SILICON METAL MARKET ANALYSIS BY PURITY
FIGURE 51. CHINA SILICON METAL MARKET ANALYSIS BY GRANULARITY
FIGURE 52. CHINA SILICON METAL MARKET ANALYSIS BY END-USE APPLICATION
FIGURE 53. CHINA SILICON METAL MARKET ANALYSIS BY PRODUCTION PROCESS
FIGURE 54. CHINA SILICON METAL MARKET ANALYSIS BY REGIONAL
FIGURE 55. INDIA SILICON METAL MARKET ANALYSIS BY PURITY
FIGURE 56. INDIA SILICON METAL MARKET ANALYSIS BY GRANULARITY
FIGURE 57. INDIA SILICON METAL MARKET ANALYSIS BY END-USE APPLICATION
FIGURE 58. INDIA SILICON METAL MARKET ANALYSIS BY PRODUCTION PROCESS
FIGURE 59. INDIA SILICON METAL MARKET ANALYSIS BY REGIONAL
FIGURE 60. JAPAN SILICON METAL MARKET ANALYSIS BY PURITY
FIGURE 61. JAPAN SILICON METAL MARKET ANALYSIS BY GRANULARITY
FIGURE 62. JAPAN SILICON METAL MARKET ANALYSIS BY END-USE APPLICATION
FIGURE 63. JAPAN SILICON METAL MARKET ANALYSIS BY PRODUCTION PROCESS
FIGURE 64. JAPAN SILICON METAL MARKET ANALYSIS BY REGIONAL
FIGURE 65. SOUTH KOREA SILICON METAL MARKET ANALYSIS BY PURITY
FIGURE 66. SOUTH KOREA SILICON METAL MARKET ANALYSIS BY GRANULARITY
FIGURE 67. SOUTH KOREA SILICON METAL MARKET ANALYSIS BY END-USE APPLICATION
FIGURE 68. SOUTH KOREA SILICON METAL MARKET ANALYSIS BY PRODUCTION PROCESS
FIGURE 69. SOUTH KOREA SILICON METAL MARKET ANALYSIS BY REGIONAL
FIGURE 70. MALAYSIA SILICON METAL MARKET ANALYSIS BY PURITY
FIGURE 71. MALAYSIA SILICON METAL MARKET ANALYSIS BY GRANULARITY
FIGURE 72. MALAYSIA SILICON METAL MARKET ANALYSIS BY END-USE APPLICATION
FIGURE 73. MALAYSIA SILICON METAL MARKET ANALYSIS BY PRODUCTION PROCESS
FIGURE 74. MALAYSIA SILICON METAL MARKET ANALYSIS BY REGIONAL
FIGURE 75. THAILAND SILICON METAL MARKET ANALYSIS BY PURITY
FIGURE 76. THAILAND SILICON METAL MARKET ANALYSIS BY GRANULARITY
FIGURE 77. THAILAND SILICON METAL MARKET ANALYSIS BY END-USE APPLICATION
FIGURE 78. THAILAND SILICON METAL MARKET ANALYSIS BY PRODUCTION PROCESS
FIGURE 79. THAILAND SILICON METAL MARKET ANALYSIS BY REGIONAL
FIGURE 80. INDONESIA SILICON METAL MARKET ANALYSIS BY PURITY
FIGURE 81. INDONESIA SILICON METAL MARKET ANALYSIS BY GRANULARITY
FIGURE 82. INDONESIA SILICON METAL MARKET ANALYSIS BY END-USE APPLICATION
FIGURE 83. INDONESIA SILICON METAL MARKET ANALYSIS BY PRODUCTION PROCESS
FIGURE 84. INDONESIA SILICON METAL MARKET ANALYSIS BY REGIONAL
FIGURE 85. REST OF APAC SILICON METAL MARKET ANALYSIS BY PURITY
FIGURE 86. REST OF APAC SILICON METAL MARKET ANALYSIS BY GRANULARITY
FIGURE 87. REST OF APAC SILICON METAL MARKET ANALYSIS BY END-USE APPLICATION
FIGURE 88. REST OF APAC SILICON METAL MARKET ANALYSIS BY PRODUCTION PROCESS
FIGURE 89. REST OF APAC SILICON METAL MARKET ANALYSIS BY REGIONAL
FIGURE 90. SOUTH AMERICA SILICON METAL MARKET ANALYSIS
FIGURE 91. BRAZIL SILICON METAL MARKET ANALYSIS BY PURITY
FIGURE 92. BRAZIL SILICON METAL MARKET ANALYSIS BY GRANULARITY
FIGURE 93. BRAZIL SILICON METAL MARKET ANALYSIS BY END-USE APPLICATION
FIGURE 94. BRAZIL SILICON METAL MARKET ANALYSIS BY PRODUCTION PROCESS
FIGURE 95. BRAZIL SILICON METAL MARKET ANALYSIS BY REGIONAL
FIGURE 96. MEXICO SILICON METAL MARKET ANALYSIS BY PURITY
FIGURE 97. MEXICO SILICON METAL MARKET ANALYSIS BY GRANULARITY
FIGURE 98. MEXICO SILICON METAL MARKET ANALYSIS BY END-USE APPLICATION
FIGURE 99. MEXICO SILICON METAL MARKET ANALYSIS BY PRODUCTION PROCESS
FIGURE 100. MEXICO SILICON METAL MARKET ANALYSIS BY REGIONAL
FIGURE 101. ARGENTINA SILICON METAL MARKET ANALYSIS BY PURITY
FIGURE 102. ARGENTINA SILICON METAL MARKET ANALYSIS BY GRANULARITY
FIGURE 103. ARGENTINA SILICON METAL MARKET ANALYSIS BY END-USE APPLICATION
FIGURE 104. ARGENTINA SILICON METAL MARKET ANALYSIS BY PRODUCTION PROCESS
FIGURE 105. ARGENTINA SILICON METAL MARKET ANALYSIS BY REGIONAL
FIGURE 106. REST OF SOUTH AMERICA SILICON METAL MARKET ANALYSIS BY PURITY
FIGURE 107. REST OF SOUTH AMERICA SILICON METAL MARKET ANALYSIS BY GRANULARITY
FIGURE 108. REST OF SOUTH AMERICA SILICON METAL MARKET ANALYSIS BY END-USE APPLICATION
FIGURE 109. REST OF SOUTH AMERICA SILICON METAL MARKET ANALYSIS BY PRODUCTION PROCESS
FIGURE 110. REST OF SOUTH AMERICA SILICON METAL MARKET ANALYSIS BY REGIONAL
FIGURE 111. MEA SILICON METAL MARKET ANALYSIS
FIGURE 112. GCC COUNTRIES SILICON METAL MARKET ANALYSIS BY PURITY
FIGURE 113. GCC COUNTRIES SILICON METAL MARKET ANALYSIS BY GRANULARITY
FIGURE 114. GCC COUNTRIES SILICON METAL MARKET ANALYSIS BY END-USE APPLICATION
FIGURE 115. GCC COUNTRIES SILICON METAL MARKET ANALYSIS BY PRODUCTION PROCESS
FIGURE 116. GCC COUNTRIES SILICON METAL MARKET ANALYSIS BY REGIONAL
FIGURE 117. SOUTH AFRICA SILICON METAL MARKET ANALYSIS BY PURITY
FIGURE 118. SOUTH AFRICA SILICON METAL MARKET ANALYSIS BY GRANULARITY
FIGURE 119. SOUTH AFRICA SILICON METAL MARKET ANALYSIS BY END-USE APPLICATION
FIGURE 120. SOUTH AFRICA SILICON METAL MARKET ANALYSIS BY PRODUCTION PROCESS
FIGURE 121. SOUTH AFRICA SILICON METAL MARKET ANALYSIS BY REGIONAL
FIGURE 122. REST OF MEA SILICON METAL MARKET ANALYSIS BY PURITY
FIGURE 123. REST OF MEA SILICON METAL MARKET ANALYSIS BY GRANULARITY
FIGURE 124. REST OF MEA SILICON METAL MARKET ANALYSIS BY END-USE APPLICATION
FIGURE 125. REST OF MEA SILICON METAL MARKET ANALYSIS BY PRODUCTION PROCESS
FIGURE 126. REST OF MEA SILICON METAL MARKET ANALYSIS BY REGIONAL
FIGURE 127. KEY BUYING CRITERIA OF SILICON METAL MARKET
FIGURE 128. RESEARCH PROCESS OF MRFR
FIGURE 129. DRO ANALYSIS OF SILICON METAL MARKET
FIGURE 130. DRIVERS IMPACT ANALYSIS: SILICON METAL MARKET
FIGURE 131. RESTRAINTS IMPACT ANALYSIS: SILICON METAL MARKET
FIGURE 132. SUPPLY / VALUE CHAIN: SILICON METAL MARKET
FIGURE 133. SILICON METAL MARKET, BY PURITY, 2024 (% SHARE)
FIGURE 134. SILICON METAL MARKET, BY PURITY, 2020 TO 2034 (USD Billions)
FIGURE 135. SILICON METAL MARKET, BY GRANULARITY, 2024 (% SHARE)
FIGURE 136. SILICON METAL MARKET, BY GRANULARITY, 2020 TO 2034 (USD Billions)
FIGURE 137. SILICON METAL MARKET, BY END-USE APPLICATION, 2024 (% SHARE)
FIGURE 138. SILICON METAL MARKET, BY END-USE APPLICATION, 2020 TO 2034 (USD Billions)
FIGURE 139. SILICON METAL MARKET, BY PRODUCTION PROCESS, 2024 (% SHARE)
FIGURE 140. SILICON METAL MARKET, BY PRODUCTION PROCESS, 2020 TO 2034 (USD Billions)
FIGURE 141. SILICON METAL MARKET, BY REGIONAL, 2024 (% SHARE)
FIGURE 142. SILICON METAL MARKET, BY REGIONAL, 2020 TO 2034 (USD Billions)
FIGURE 143. BENCHMARKING OF MAJOR COMPETITORS
Research Process

Data Library Research are conducted by industry experts who offer insight on industry structure, market segmentations technology assessment and competitive landscape (CL), and penetration, as well as on emerging trends. Their analysis is based on primary interviews (~ 80%) and secondary research (~ 20%) as well as years of professional expertise in their respective industries. Adding to this, by analysing historical trends and current market positions, our analysts predict where the market will be headed for the next five years. Furthermore, the varying trends of segment & categories geographically presented are also studied and the estimated based on the primary & secondary research.

In this particular report from the supply side Data Library Research has conducted primary surveys (interviews) with the key level executives (VP, CEO’s, Marketing Director, Business Development Manager and SOFT) of the companies that active & prominent as well as the midsized organization

FIGURE 1: DLR RESEARH PROCESS

research-methodology1

Primary Research

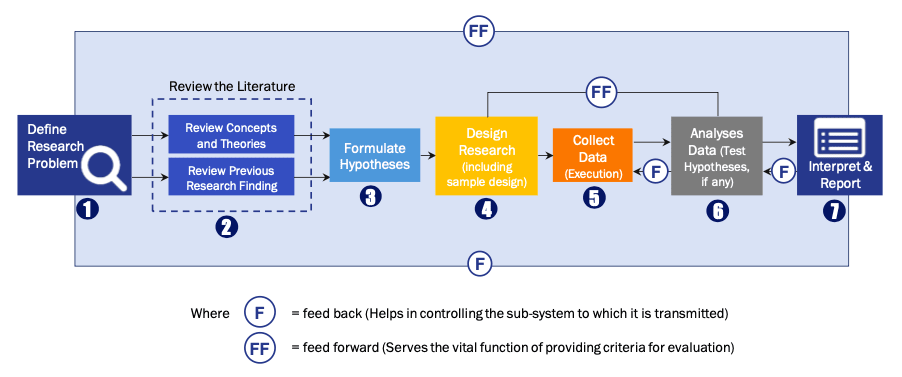
Extensive primary research was conducted to gain a deeper insight of the market and industry performance. The analysis is based on both primary and secondary research as well as years of professional expertise in the respective industries.

In addition to analysing current and historical trends, our analysts predict where the market is headed over the next five years.

It varies by segment for these categories geographically presented in the list of market tables. Speaking about this particular report we have conducted primary surveys (interviews) with the key level executives (VP, CEO’s, Marketing Director, Business Development Manager and many more) of the major players active in the market.

Secondary Research

Secondary research was mainly used to collect and identify information useful for the extensive, technical, market-oriented, and Friend’s study of the Global Extra Neutral Alcohol. It was also used to obtain key information about major players, market classification and segmentation according to the industry trends, geographical markets, and developments related to the market and technology perspectives. For this study, analysts have gathered information from various credible sources, such as annual reports, sec filings, journals, white papers, SOFT presentations, and company web sites.

Market Size Estimation

Both, top-down and bottom-up approaches were used to estimate and validate the size of the Global market and to estimate the size of various other dependent submarkets in the overall Extra Neutral Alcohol. The key players in the market were identified through secondary research and their market contributions in the respective geographies were determined through primary and secondary research.

Forecast Model

research-methodology2

Happy to Assist You

If you have a question?

[email protected]

IND : +91 955 279 0357

Browse Related Reports