Workwear and Uniforms Market Overview and Analysis:

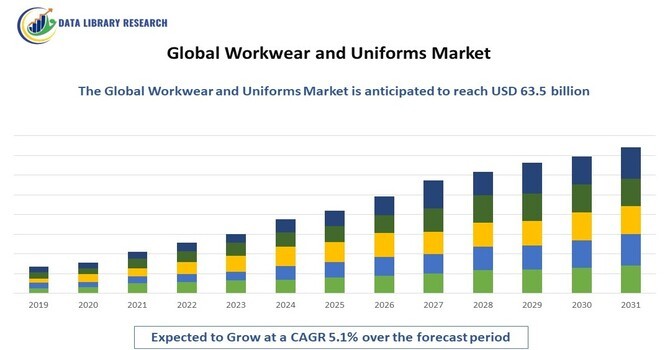
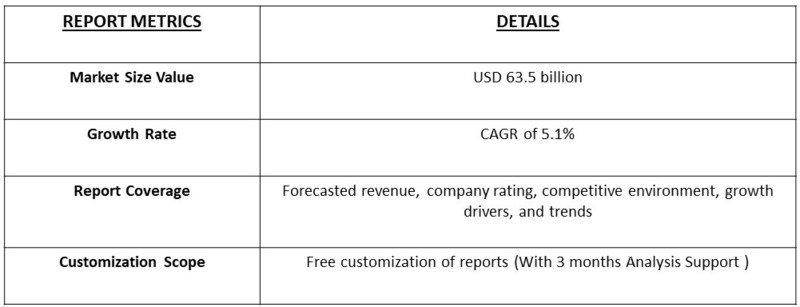
The global workwear and uniforms market is projected to reach a market value of USD 43.3 billion in 2023 and is expected to grow to USD 63.5 billion by 2031, registering a Compound Annual Growth Rate (CAGR) of 5.1% during the forecast period, 2023-2031.

Workwear and Uniforms Market

Get a Complete Analysis Of The Report - Download a Free Sample PDF

The Global Workwear and Uniforms Market encompasses the production, distribution, and sale of specialized clothing designed for various professional environments, including industrial, service, and healthcare sectors. This market includes a range of products such as safety workwear, corporate uniforms, and specialized apparel tailored for specific job functions and industry standards. Growth is driven by increasing regulatory requirements for workplace safety, the rising demand for branded and standardized corporate attire, and advancements in fabric technology for enhanced comfort and durability. The market is supported by trends toward customization, sustainability, and functional design innovations.

The Global Workwear and Uniforms Market is driven by several key factors. Increasing regulatory requirements for workplace safety are prompting organizations to invest in compliant workwear solutions. The demand for branded and standardized corporate uniforms is rising as companies seek to enhance brand identity and employee professionalism. Technological advancements in fabric and garment manufacturing are improving comfort, durability, and functionality of workwear. Additionally, the growing emphasis on sustainability and eco-friendly materials is influencing market dynamics, as companies adopt more environmentally responsible practices. These factors collectively contribute to the robust growth of the workwear and uniforms sector.

Workwear and Uniforms Market Trends:

The Global Workwear and Uniforms Market include a growing focus on sustainability, with increasing adoption of eco-friendly materials and manufacturing processes. There is also a rising demand for smart workwear incorporating wearable technology for improved safety and efficiency. Customization and personalization are becoming more prevalent, allowing companies to tailor uniforms to specific brand identities and employee needs. The market is seeing a shift towards multifunctional and ergonomic designs that enhance comfort and performance. Additionally, the integration of digital platforms for uniform management and ordering is streamlining procurement processes and improving supply chain efficiency.

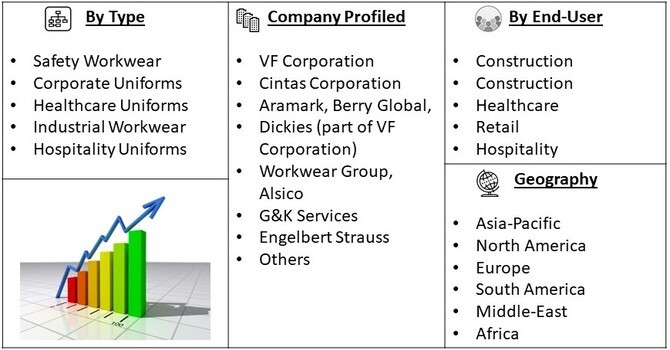
Market Segmentation: The Global Workwear and Uniforms Market is segmented by technology Type of Workwear (Safety Workwear, Corporate Uniforms, Healthcare Uniforms, Industrial Workwear, Hospitality Uniforms) End-User Industry (Construction, Construction, Healthcare, Retail, Hospitality) and geography (Asia-Pacific, North America, Europe, South America, and Middle-East and Africa). The report offers the market size and forecasts for revenue (USD million) for all the above segments.

Workwear and Uniforms Market Segment

For Detailed Market Segmentation - Get a Free Sample PDF

Market Drivers:

Growing demand for high-quality workwear:

The global workwear and uniforms market is driven by the growing demand for high-quality workwear that meets the needs of workers in various industries. Consumers are seeking durable, comfortable, and functional workwear that can withstand the rigors of their daily tasks. For instance, a leading workwear manufacturer has reported a 15% increase in sales of high-quality workwear in the past year, driven by consumer demand for premium products. This trend is expected to continue, driving demand for high-quality workwear and uniforms. As a result, the market is expected to see increased investment in research and development, as well as marketing and distribution efforts.

Increasing adoption of sustainable workwear:

The global workwear and uniforms market is driven by the growing demand for high-quality workwear that meets the needs of workers in various industries. Consumers are seeking durable, comfortable, and functional workwear that can withstand the rigors of their daily tasks. For instance, a leading workwear manufacturer has reported a 15% increase in sales of high-quality workwear in the past year, driven by consumer demand for premium products. This trend is expected to continue, driving demand for high-quality workwear and uniforms. As a result, the market is expected to see increased investment in research and development, as well as marketing and distribution efforts.

Market Restraints:

The global workwear and uniforms market is restrained by high production costs. The production of workwear and uniforms requires significant investments in materials, labor, and equipment, which can be a barrier to entry for new manufacturers. Additionally, the cost of sourcing high-quality materials, such as cotton and polyester, can be high. For instance, a leading workwear manufacturer has reported that the cost of producing a single workwear item can range from 5 to 15, which can make it challenging to maintain profitability. This high production cost can be a significant restraint on the market, limiting the ability of manufacturers to invest in research and development, marketing, and distribution. As a result, the market is expected to be characterized by a focus on efficiency and cost reduction.

COVID-19 Impact On Workwear and Uniforms Market:

The COVID-19 pandemic significantly impacted the Global Workwear and Uniforms Market, initially disrupting supply chains and causing delays in production and distribution. The pandemic accelerated the need for healthcare uniforms, including personal protective equipment (PPE), as frontline workers required enhanced protection. Concurrently, many businesses reduced their uniform purchases due to operational shutdowns and remote work arrangements, leading to a temporary decline in demand. However, as economies reopened and safety regulations evolved, there was a resurgence in demand for workwear across various sectors, particularly for hygiene and safety-related products. The market adapted by incorporating new safety features into uniforms and increasing the use of digital platforms for uniform management and procurement, driving a rebound in growth.

Segmental Analysis:

Safety Workwear Segment is Expected to Witness Significant Growth Over the Forecast Period

The automatic wash systems segment in the Global Car Washing Market has seen significant advancements with the introduction of sophisticated tunnel washers, conveyor systems, and robotic washers. These systems are designed to provide efficient, high-throughput washing solutions that cater to both individual and fleet needs. Recent developments include the integration of smart technology, which allows for real-time monitoring and automated adjustments to optimize wash quality and resource usage. The driving factors for this segment include increasing consumer demand for convenience, the desire for consistent and high-quality wash results, and the efficiency of automated systems in reducing labor costs and time. Additionally, technological innovations such as touchless and hybrid wash systems are enhancing customer satisfaction by minimizing vehicle damage and improving overall wash performance.

Healthcare Uniforms Segment is Expected to Witness Significant Growth Over the Forecast Period

Healthcare uniforms have seen significant innovation and demand growth, driven by the global focus on infection control and hygiene in medical settings. In 2024, companies like Barco Uniforms and FIGS launched new lines of antimicrobial scrubs and lab coats designed to enhance durability and comfort while providing enhanced protection against pathogens. The driving factors for this sub-segment include the ongoing global health crises, increased awareness of hygiene standards, and the need for comfortable, functional attire for medical professionals. Advances in fabric technology and a growing emphasis on healthcare worker well-being contribute to the expansion of this segment within the workwear market.

Asia Pacific Region is Expected to Witness Significant Growth Over the Forecast Period

The Asia-Pacific region is projected to experience significant growth in the workwear and uniforms market over the forecast period. This growth is driven by rapid industrialization and urbanization in key markets like China, India, and Southeast Asia, which are increasing the demand for both industrial and corporate workwear. Additionally, stringent safety regulations and rising standards for employee attire across various industries are contributing to market expansion. The growing middle class and rising disposable incomes in the region are leading to greater spending on quality workwear and uniforms. Furthermore, the development of retail and distribution networks, including the expansion of e-commerce platforms, is enhancing accessibility and driving market growth.

Workwear and Uniforms Market Table

To Learn More About This Report - Request a Free Sample Copy

Workwear and Uniforms Market Competitive Landscape:

The Global Workwear and Uniforms Market is characterized by a diverse range of key players focused on innovation, brand differentiation, and market expansion. Companies are investing in advanced materials, technology, and customization to meet the evolving needs of various industries.

Leading competitors include:

  • VF Corporation
  • Cintas Corporation
  • Aramark, Berry Global,
  • Dickies (part of VF Corporation)
  • Workwear Group, Alsico
  • G&K Services
  • Engelbert Strauss

Recent Development:

1) In 2023, VF Corporation launched a new line of eco-friendly workwear under its Dickies brand, focusing on sustainability and reducing environmental impact. This product line features garments made from recycled materials and incorporates advanced, environmentally responsible manufacturing processes. The initiative reflects VF Corporation’s commitment to sustainability and responds to the increasing demand for eco-conscious workwear solutions. The new line aims to cater to companies and organizations looking to enhance their corporate social responsibility and reduce their carbon footprint.

2) In early 2024, Cintas Corporation unveiled a new range of smart workwear integrating wearable technology. These garments include embedded sensors that monitor workers' vital signs and environmental conditions, providing real-time safety alerts and health data. This development aims to enhance worker safety and productivity, particularly in high-risk industries. By leveraging advancements in wearable technology, Cintas is positioning itself as a leader in the innovation of workwear, addressing growing concerns about occupational health and safety.


Frequently Asked Questions (FAQ) :

Q1. What are the driving factors for the Global Workwear and Uniform Market?

The global workwear and uniform market is primarily driven by the increasing demand for corporate branding and employee identification across various industries. Companies recognize that uniforms can enhance brand visibility and create a professional image, which is particularly important in sectors like hospitality, healthcare, and retail. Additionally, the focus on employee safety and comfort is prompting organizations to invest in high-quality, functional workwear that complies with safety regulations. The growth of e-commerce platforms has also made it easier for businesses to source customized uniforms. Moreover, the rising trend of remote work is influencing organizations to rethink their uniform policies, leading to a demand for more versatile workwear options.

Q2. What are the restraining factors for the Global Workwear and Uniform Market?

Despite its growth potential, the global workwear and uniform market faces several restraining factors. One of the main challenges is the high cost associated with sourcing high-quality materials and custom designs, which can deter smaller businesses from investing in uniforms. Additionally, the market is susceptible to fluctuations in raw material prices, affecting overall production costs. The increasing preference for casual wear in some workplaces may also reduce the demand for traditional uniforms. Furthermore, the lack of standardization in sizing and design can create challenges for manufacturers and customers alike. Finally, economic downturns can lead businesses to cut costs, including expenditures on workwear.

Q3. Which segment is projected to hold the largest share in the Global Workwear and Uniform Market?

The protective clothing segment is projected to hold the largest share in the global workwear and uniform market. This segment includes garments designed to ensure worker safety in hazardous environments, such as construction, manufacturing, and healthcare settings. The rising awareness of occupational safety and health regulations is driving demand for protective workwear, as companies seek to comply with legal requirements and protect their employees. Furthermore, innovations in fabric technology are enhancing the functionality and comfort of protective clothing, making it more appealing to businesses. As safety regulations become increasingly stringent, the protective clothing segment is expected to continue dominating the market.

Q4. Which region holds the largest share in the Global Workwear and Uniform Market?

North America is anticipated to hold the largest share in the global workwear and uniform market, primarily driven by the region's robust industrial sector and stringent safety regulations. The United States, in particular, has a strong demand for workwear across various industries, including construction, manufacturing, and healthcare. The increasing focus on employee safety and corporate branding further propels the demand for uniforms in North America. Additionally, the presence of key players and established supply chains enhances market accessibility. As companies increasingly invest in employee identity and safety measures, North America is well-positioned to maintain its leading position in the workwear and uniform market.

Q5. Which are the prominent players in the Global Workwear and Uniform Market?

Prominent players in the global workwear and uniform market include well-established companies such as Aramark, Cintas Corporation, and VF Corporation. These companies are recognized for their extensive range of workwear solutions and commitment to quality. Additionally, firms like Dickies, Carhartt, and Engelbert Strauss have gained significant market presence by focusing on specific sectors and offering durable, functional products. These players are actively investing in innovation and sustainability initiatives to cater to evolving consumer preferences. Collaborations with businesses for custom uniform solutions further enhance their market positions, allowing them to adapt to diverse industry needs.

1. EXECUTIVE SUMMARY

  • 1.1. Market Overview
  • 1.2. Key Findings
  • 1.3. Market Segmentation
  • 1.4. Competitive Landscape
  • 1.5. Challenges and Opportunities
  • 1.6. Future Outlook

2. MARKET INTRODUCTION

  • 2.1. Definition
  • 2.2. Scope of the study
    • 2.2.1. Research Objective
    • 2.2.2. Assumption
    • 2.2.3. Limitations

3. RESEARCH METHODOLOGY

  • 3.1. Overview
  • 3.2. Data Mining
  • 3.3. Secondary Research
  • 3.4. Primary Research
    • 3.4.1. Primary Interviews and Information Gathering Process
    • 3.4.2. Breakdown of Primary Respondents
  • 3.5. Forecasting Model
  • 3.6. Market Size Estimation
    • 3.6.1. Bottom-Up Approach
    • 3.6.2. Top-Down Approach
  • 3.7. Data Triangulation
  • 3.8. Validation

4. MARKET DYNAMICS

  • 4.1. Overview
  • 4.2. Drivers
  • 4.3. Restraints
  • 4.4. Opportunities

5. MARKET FACTOR ANALYSIS

  • 5.1. Value chain Analysis
  • 5.2. Porter's Five Forces Analysis
    • 5.2.1. Bargaining Power of Suppliers
    • 5.2.2. Bargaining Power of Buyers
    • 5.2.3. Threat of New Entrants
    • 5.2.4. Threat of Substitutes
    • 5.2.5. Intensity of Rivalry
  • 5.3. COVID-19 Impact Analysis
    • 5.3.1. Market Impact Analysis
    • 5.3.2. Regional Impact
    • 5.3.3. Opportunity and Threat Analysis

6. WORKWEAR AND UNIFORMS MARKET, BY WORKWEAR TYPE (USD BILLION)

  • 6.1. Protective Clothing
  • 6.2. Uniforms
  • 6.3. Flame-resistant Clothing
  • 6.4. High-visibility Clothing
  • 6.5. Footwear
  • 6.6. Accessories

7. WORKWEAR AND UNIFORMS MARKET, BY END-USE INDUSTRY (USD BILLION)

  • 7.1. Construction
  • 7.2. Manufacturing
  • 7.3. Transportation
  • 7.4. Healthcare
  • 7.5. Energy
  • 7.6. Mining
  • 7.7. Hospitality

8. WORKWEAR AND UNIFORMS MARKET, BY DISTRIBUTION CHANNEL (USD BILLION)

  • 8.1. Online
  • 8.2. Retail Stores
  • 8.3. Wholesalers and Distributors
  • 8.4. Direct Sales

9. WORKWEAR AND UNIFORMS MARKET, BY MATERIAL (USD BILLION)

  • 9.1. Cotton
  • 9.2. Polyester
  • 9.3. Nylon
  • 9.4. Kevlar
  • 9.5. Nomex
  • 9.6. Leather

10. WORKWEAR AND UNIFORMS MARKET, BY SAFETY STANDARD (USD BILLION)

  • 10.1. ANSI
  • 10.2. OSHA
  • 10.3. NFPA
  • 10.4. ASTM
  • 10.5. EN
  • 10.6. ISO

11. WORKWEAR AND UNIFORMS MARKET, BY REGIONAL (USD BILLION)

  • 11.1. North America
    • 11.1.1. US
    • 11.1.2. Canada
  • 11.2. Europe
    • 11.2.1. Germany
    • 11.2.2. UK
    • 11.2.3. France
    • 11.2.4. Russia
    • 11.2.5. Italy
    • 11.2.6. Spain
    • 11.2.7. Rest of Europe
  • 11.3. APAC
    • 11.3.1. China
    • 11.3.2. India
    • 11.3.3. Japan
    • 11.3.4. South Korea
    • 11.3.5. Malaysia
    • 11.3.6. Thailand
    • 11.3.7. Indonesia
    • 11.3.8. Rest of APAC
  • 11.4. South America
    • 11.4.1. Brazil
    • 11.4.2. Mexico
    • 11.4.3. Argentina
    • 11.4.4. Rest of South America
  • 11.5. MEA
    • 11.5.1. GCC Countries
    • 11.5.2. South Africa
    • 11.5.3. Rest of MEA

12. COMPETITIVE LANDSCAPE

  • 12.1. Overview
  • 12.2. Competitive Analysis
  • 12.3. Market share Analysis
  • 12.4. Major Growth Strategy in the WORKWEAR AND UNIFORMS MARKET
  • 12.5. Competitive Benchmarking
  • 12.6. Leading Players in Terms of Number of Developments in the WORKWEAR AND UNIFORMS MARKET
  • 12.7. Key developments and growth strategies
    • 12.7.1. New Product Launch/Service Deployment
    • 12.7.2. Merger & Acquisitions
    • 12.7.3. Joint Ventures
  • 12.8. Major Players Financial Matrix
    • 12.8.1. Sales and Operating Income
    • 12.8.2. Major Players R&D Expenditure. 2023

13. COMPANY PROFILES

  • 13.1. Cintas
    • 13.1.1. Financial Overview
    • 13.1.2. Products Offered
    • 13.1.3. Key Developments
    • 13.1.4. SWOT Analysis
    • 13.1.5. Key Strategies
  • 13.2. Dickies
    • 13.2.1. Financial Overview
    • 13.2.2. Products Offered
    • 13.2.3. Key Developments
    • 13.2.4. SWOT Analysis
    • 13.2.5. Key Strategies
  • 13.3. UniFirst Corporation
    • 13.3.1. Financial Overview
    • 13.3.2. Products Offered
    • 13.3.3. Key Developments
    • 13.3.4. SWOT Analysis
    • 13.3.5. Key Strategies
  • 13.4. Fristads Kansas
    • 13.4.1. Financial Overview
    • 13.4.2. Products Offered
    • 13.4.3. Key Developments
    • 13.4.4. SWOT Analysis
    • 13.4.5. Key Strategies
  • 13.5. Portwest
    • 13.5.1. Financial Overview
    • 13.5.2. Products Offered
    • 13.5.3. Key Developments
    • 13.5.4. SWOT Analysis
    • 13.5.5. Key Strategies
  • 13.6. Pega SAS
    • 13.6.1. Financial Overview
    • 13.6.2. Products Offered
    • 13.6.3. Key Developments
    • 13.6.4. SWOT Analysis
    • 13.6.5. Key Strategies
  • 13.7. VF Corporation
    • 13.7.1. Financial Overview
    • 13.7.2. Products Offered
    • 13.7.3. Key Developments
    • 13.7.4. SWOT Analysis
    • 13.7.5. Key Strategies
  • 13.8. Sioen Industries
    • 13.8.1. Financial Overview
    • 13.8.2. Products Offered
    • 13.8.3. Key Developments
    • 13.8.4. SWOT Analysis
    • 13.8.5. Key Strategies
  • 13.9. Aramark
    • 13.9.1. Financial Overview
    • 13.9.2. Products Offered
    • 13.9.3. Key Developments
    • 13.9.4. SWOT Analysis
    • 13.9.5. Key Strategies
  • 13.10. Helly Hansen
    • 13.10.1. Financial Overview
    • 13.10.2. Products Offered
    • 13.10.3. Key Developments
    • 13.10.4. SWOT Analysis
    • 13.10.5. Key Strategies
  • 13.11. Mascot International
    • 13.11.1. Financial Overview
    • 13.11.2. Products Offered
    • 13.11.3. Key Developments
    • 13.11.4. SWOT Analysis
    • 13.11.5. Key Strategies
  • 13.12. Benetton Group
    • 13.12.1. Financial Overview
    • 13.12.2. Products Offered
    • 13.12.3. Key Developments
    • 13.12.4. SWOT Analysis
    • 13.12.5. Key Strategies
  • 13.13. Carhartt
    • 13.13.1. Financial Overview
    • 13.13.2. Products Offered
    • 13.13.3. Key Developments
    • 13.13.4. SWOT Analysis
    • 13.13.5. Key Strategies
  • 13.14. Stanley Black Decker
    • 13.14.1. Financial Overview
    • 13.14.2. Products Offered
    • 13.14.3. Key Developments
    • 13.14.4. SWOT Analysis
    • 13.14.5. Key Strategies
  • 13.15. Red Kap
    • 13.15.1. Financial Overview
    • 13.15.2. Products Offered
    • 13.15.3. Key Developments
    • 13.15.4. SWOT Analysis
    • 13.15.5. Key Strategies

14. APPENDIX

  • 14.1. References
FIGURE 1. MARKET SYNOPSIS
FIGURE 2. NORTH AMERICA WORKWEAR MARKET ANALYSIS
FIGURE 3. US WORKWEAR MARKET ANALYSIS BY WORKWEAR TYPE
FIGURE 4. US WORKWEAR MARKET ANALYSIS BY END-USE INDUSTRY
FIGURE 5. US WORKWEAR MARKET ANALYSIS BY DISTRIBUTION CHANNEL
FIGURE 6. US WORKWEAR MARKET ANALYSIS BY MATERIAL
FIGURE 7. US WORKWEAR MARKET ANALYSIS BY SAFETY STANDARD
FIGURE 8. US WORKWEAR MARKET ANALYSIS BY REGIONAL
FIGURE 9. CANADA WORKWEAR MARKET ANALYSIS BY WORKWEAR TYPE
FIGURE 10. CANADA WORKWEAR MARKET ANALYSIS BY END-USE INDUSTRY
FIGURE 11. CANADA WORKWEAR MARKET ANALYSIS BY DISTRIBUTION CHANNEL
FIGURE 12. CANADA WORKWEAR MARKET ANALYSIS BY MATERIAL
FIGURE 13. CANADA WORKWEAR MARKET ANALYSIS BY SAFETY STANDARD
FIGURE 14. CANADA WORKWEAR MARKET ANALYSIS BY REGIONAL
FIGURE 15. EUROPE WORKWEAR MARKET ANALYSIS
FIGURE 16. GERMANY WORKWEAR MARKET ANALYSIS BY WORKWEAR TYPE
FIGURE 17. GERMANY WORKWEAR MARKET ANALYSIS BY END-USE INDUSTRY
FIGURE 18. GERMANY WORKWEAR MARKET ANALYSIS BY DISTRIBUTION CHANNEL
FIGURE 19. GERMANY WORKWEAR MARKET ANALYSIS BY MATERIAL
FIGURE 20. GERMANY WORKWEAR MARKET ANALYSIS BY SAFETY STANDARD
FIGURE 21. GERMANY WORKWEAR MARKET ANALYSIS BY REGIONAL
FIGURE 22. UK WORKWEAR MARKET ANALYSIS BY WORKWEAR TYPE
FIGURE 23. UK WORKWEAR MARKET ANALYSIS BY END-USE INDUSTRY
FIGURE 24. UK WORKWEAR MARKET ANALYSIS BY DISTRIBUTION CHANNEL
FIGURE 25. UK WORKWEAR MARKET ANALYSIS BY MATERIAL
FIGURE 26. UK WORKWEAR MARKET ANALYSIS BY SAFETY STANDARD
FIGURE 27. UK WORKWEAR MARKET ANALYSIS BY REGIONAL
FIGURE 28. FRANCE WORKWEAR MARKET ANALYSIS BY WORKWEAR TYPE
FIGURE 29. FRANCE WORKWEAR MARKET ANALYSIS BY END-USE INDUSTRY
FIGURE 30. FRANCE WORKWEAR MARKET ANALYSIS BY DISTRIBUTION CHANNEL
FIGURE 31. FRANCE WORKWEAR MARKET ANALYSIS BY MATERIAL
FIGURE 32. FRANCE WORKWEAR MARKET ANALYSIS BY SAFETY STANDARD
FIGURE 33. FRANCE WORKWEAR MARKET ANALYSIS BY REGIONAL
FIGURE 34. RUSSIA WORKWEAR MARKET ANALYSIS BY WORKWEAR TYPE
FIGURE 35. RUSSIA WORKWEAR MARKET ANALYSIS BY END-USE INDUSTRY
FIGURE 36. RUSSIA WORKWEAR MARKET ANALYSIS BY DISTRIBUTION CHANNEL
FIGURE 37. RUSSIA WORKWEAR MARKET ANALYSIS BY MATERIAL
FIGURE 38. RUSSIA WORKWEAR MARKET ANALYSIS BY SAFETY STANDARD
FIGURE 39. RUSSIA WORKWEAR MARKET ANALYSIS BY REGIONAL
FIGURE 40. ITALY WORKWEAR MARKET ANALYSIS BY WORKWEAR TYPE
FIGURE 41. ITALY WORKWEAR MARKET ANALYSIS BY END-USE INDUSTRY
FIGURE 42. ITALY WORKWEAR MARKET ANALYSIS BY DISTRIBUTION CHANNEL
FIGURE 43. ITALY WORKWEAR MARKET ANALYSIS BY MATERIAL
FIGURE 44. ITALY WORKWEAR MARKET ANALYSIS BY SAFETY STANDARD
FIGURE 45. ITALY WORKWEAR MARKET ANALYSIS BY REGIONAL
FIGURE 46. SPAIN WORKWEAR MARKET ANALYSIS BY WORKWEAR TYPE
FIGURE 47. SPAIN WORKWEAR MARKET ANALYSIS BY END-USE INDUSTRY
FIGURE 48. SPAIN WORKWEAR MARKET ANALYSIS BY DISTRIBUTION CHANNEL
FIGURE 49. SPAIN WORKWEAR MARKET ANALYSIS BY MATERIAL
FIGURE 50. SPAIN WORKWEAR MARKET ANALYSIS BY SAFETY STANDARD
FIGURE 51. SPAIN WORKWEAR MARKET ANALYSIS BY REGIONAL
FIGURE 52. REST OF EUROPE WORKWEAR MARKET ANALYSIS BY WORKWEAR TYPE
FIGURE 53. REST OF EUROPE WORKWEAR MARKET ANALYSIS BY END-USE INDUSTRY
FIGURE 54. REST OF EUROPE WORKWEAR MARKET ANALYSIS BY DISTRIBUTION CHANNEL
FIGURE 55. REST OF EUROPE WORKWEAR MARKET ANALYSIS BY MATERIAL
FIGURE 56. REST OF EUROPE WORKWEAR MARKET ANALYSIS BY SAFETY STANDARD
FIGURE 57. REST OF EUROPE WORKWEAR MARKET ANALYSIS BY REGIONAL
FIGURE 58. APAC WORKWEAR MARKET ANALYSIS
FIGURE 59. CHINA WORKWEAR MARKET ANALYSIS BY WORKWEAR TYPE
FIGURE 60. CHINA WORKWEAR MARKET ANALYSIS BY END-USE INDUSTRY
FIGURE 61. CHINA WORKWEAR MARKET ANALYSIS BY DISTRIBUTION CHANNEL
FIGURE 62. CHINA WORKWEAR MARKET ANALYSIS BY MATERIAL
FIGURE 63. CHINA WORKWEAR MARKET ANALYSIS BY SAFETY STANDARD
FIGURE 64. CHINA WORKWEAR MARKET ANALYSIS BY REGIONAL
FIGURE 65. INDIA WORKWEAR MARKET ANALYSIS BY WORKWEAR TYPE
FIGURE 66. INDIA WORKWEAR MARKET ANALYSIS BY END-USE INDUSTRY
FIGURE 67. INDIA WORKWEAR MARKET ANALYSIS BY DISTRIBUTION CHANNEL
FIGURE 68. INDIA WORKWEAR MARKET ANALYSIS BY MATERIAL
FIGURE 69. INDIA WORKWEAR MARKET ANALYSIS BY SAFETY STANDARD
FIGURE 70. INDIA WORKWEAR MARKET ANALYSIS BY REGIONAL
FIGURE 71. JAPAN WORKWEAR MARKET ANALYSIS BY WORKWEAR TYPE
FIGURE 72. JAPAN WORKWEAR MARKET ANALYSIS BY END-USE INDUSTRY
FIGURE 73. JAPAN WORKWEAR MARKET ANALYSIS BY DISTRIBUTION CHANNEL
FIGURE 74. JAPAN WORKWEAR MARKET ANALYSIS BY MATERIAL
FIGURE 75. JAPAN WORKWEAR MARKET ANALYSIS BY SAFETY STANDARD
FIGURE 76. JAPAN WORKWEAR MARKET ANALYSIS BY REGIONAL
FIGURE 77. SOUTH KOREA WORKWEAR MARKET ANALYSIS BY WORKWEAR TYPE
FIGURE 78. SOUTH KOREA WORKWEAR MARKET ANALYSIS BY END-USE INDUSTRY
FIGURE 79. SOUTH KOREA WORKWEAR MARKET ANALYSIS BY DISTRIBUTION CHANNEL
FIGURE 80. SOUTH KOREA WORKWEAR MARKET ANALYSIS BY MATERIAL
FIGURE 81. SOUTH KOREA WORKWEAR MARKET ANALYSIS BY SAFETY STANDARD
FIGURE 82. SOUTH KOREA WORKWEAR MARKET ANALYSIS BY REGIONAL
FIGURE 83. MALAYSIA WORKWEAR MARKET ANALYSIS BY WORKWEAR TYPE
FIGURE 84. MALAYSIA WORKWEAR MARKET ANALYSIS BY END-USE INDUSTRY
FIGURE 85. MALAYSIA WORKWEAR MARKET ANALYSIS BY DISTRIBUTION CHANNEL
FIGURE 86. MALAYSIA WORKWEAR MARKET ANALYSIS BY MATERIAL
FIGURE 87. MALAYSIA WORKWEAR MARKET ANALYSIS BY SAFETY STANDARD
FIGURE 88. MALAYSIA WORKWEAR MARKET ANALYSIS BY REGIONAL
FIGURE 89. THAILAND WORKWEAR MARKET ANALYSIS BY WORKWEAR TYPE
FIGURE 90. THAILAND WORKWEAR MARKET ANALYSIS BY END-USE INDUSTRY
FIGURE 91. THAILAND WORKWEAR MARKET ANALYSIS BY DISTRIBUTION CHANNEL
FIGURE 92. THAILAND WORKWEAR MARKET ANALYSIS BY MATERIAL
FIGURE 93. THAILAND WORKWEAR MARKET ANALYSIS BY SAFETY STANDARD
FIGURE 94. THAILAND WORKWEAR MARKET ANALYSIS BY REGIONAL
FIGURE 95. INDONESIA WORKWEAR MARKET ANALYSIS BY WORKWEAR TYPE
FIGURE 96. INDONESIA WORKWEAR MARKET ANALYSIS BY END-USE INDUSTRY
FIGURE 97. INDONESIA WORKWEAR MARKET ANALYSIS BY DISTRIBUTION CHANNEL
FIGURE 98. INDONESIA WORKWEAR MARKET ANALYSIS BY MATERIAL
FIGURE 99. INDONESIA WORKWEAR MARKET ANALYSIS BY SAFETY STANDARD
FIGURE 100. INDONESIA WORKWEAR MARKET ANALYSIS BY REGIONAL
FIGURE 101. REST OF APAC WORKWEAR MARKET ANALYSIS BY WORKWEAR TYPE
FIGURE 102. REST OF APAC WORKWEAR MARKET ANALYSIS BY END-USE INDUSTRY
FIGURE 103. REST OF APAC WORKWEAR MARKET ANALYSIS BY DISTRIBUTION CHANNEL
FIGURE 104. REST OF APAC WORKWEAR MARKET ANALYSIS BY MATERIAL
FIGURE 105. REST OF APAC WORKWEAR MARKET ANALYSIS BY SAFETY STANDARD
FIGURE 106. REST OF APAC WORKWEAR MARKET ANALYSIS BY REGIONAL
FIGURE 107. SOUTH AMERICA WORKWEAR MARKET ANALYSIS
FIGURE 108. BRAZIL WORKWEAR MARKET ANALYSIS BY WORKWEAR TYPE
FIGURE 109. BRAZIL WORKWEAR MARKET ANALYSIS BY END-USE INDUSTRY
FIGURE 110. BRAZIL WORKWEAR MARKET ANALYSIS BY DISTRIBUTION CHANNEL
FIGURE 111. BRAZIL WORKWEAR MARKET ANALYSIS BY MATERIAL
FIGURE 112. BRAZIL WORKWEAR MARKET ANALYSIS BY SAFETY STANDARD
FIGURE 113. BRAZIL WORKWEAR MARKET ANALYSIS BY REGIONAL
FIGURE 114. MEXICO WORKWEAR MARKET ANALYSIS BY WORKWEAR TYPE
FIGURE 115. MEXICO WORKWEAR MARKET ANALYSIS BY END-USE INDUSTRY
FIGURE 116. MEXICO WORKWEAR MARKET ANALYSIS BY DISTRIBUTION CHANNEL
FIGURE 117. MEXICO WORKWEAR MARKET ANALYSIS BY MATERIAL
FIGURE 118. MEXICO WORKWEAR MARKET ANALYSIS BY SAFETY STANDARD
FIGURE 119. MEXICO WORKWEAR MARKET ANALYSIS BY REGIONAL
FIGURE 120. ARGENTINA WORKWEAR MARKET ANALYSIS BY WORKWEAR TYPE
FIGURE 121. ARGENTINA WORKWEAR MARKET ANALYSIS BY END-USE INDUSTRY
FIGURE 122. ARGENTINA WORKWEAR MARKET ANALYSIS BY DISTRIBUTION CHANNEL
FIGURE 123. ARGENTINA WORKWEAR MARKET ANALYSIS BY MATERIAL
FIGURE 124. ARGENTINA WORKWEAR MARKET ANALYSIS BY SAFETY STANDARD
FIGURE 125. ARGENTINA WORKWEAR MARKET ANALYSIS BY REGIONAL
FIGURE 126. REST OF SOUTH AMERICA WORKWEAR MARKET ANALYSIS BY WORKWEAR TYPE
FIGURE 127. REST OF SOUTH AMERICA WORKWEAR MARKET ANALYSIS BY END-USE INDUSTRY
FIGURE 128. REST OF SOUTH AMERICA WORKWEAR MARKET ANALYSIS BY DISTRIBUTION CHANNEL
FIGURE 129. REST OF SOUTH AMERICA WORKWEAR MARKET ANALYSIS BY MATERIAL
FIGURE 130. REST OF SOUTH AMERICA WORKWEAR MARKET ANALYSIS BY SAFETY STANDARD
FIGURE 131. REST OF SOUTH AMERICA WORKWEAR MARKET ANALYSIS BY REGIONAL
FIGURE 132. MEA WORKWEAR MARKET ANALYSIS
FIGURE 133. GCC COUNTRIES WORKWEAR MARKET ANALYSIS BY WORKWEAR TYPE
FIGURE 134. GCC COUNTRIES WORKWEAR MARKET ANALYSIS BY END-USE INDUSTRY
FIGURE 135. GCC COUNTRIES WORKWEAR MARKET ANALYSIS BY DISTRIBUTION CHANNEL
FIGURE 136. GCC COUNTRIES WORKWEAR MARKET ANALYSIS BY MATERIAL
FIGURE 137. GCC COUNTRIES WORKWEAR MARKET ANALYSIS BY SAFETY STANDARD
FIGURE 138. GCC COUNTRIES WORKWEAR MARKET ANALYSIS BY REGIONAL
FIGURE 139. SOUTH AFRICA WORKWEAR MARKET ANALYSIS BY WORKWEAR TYPE
FIGURE 140. SOUTH AFRICA WORKWEAR MARKET ANALYSIS BY END-USE INDUSTRY
FIGURE 141. SOUTH AFRICA WORKWEAR MARKET ANALYSIS BY DISTRIBUTION CHANNEL
FIGURE 142. SOUTH AFRICA WORKWEAR MARKET ANALYSIS BY MATERIAL
FIGURE 143. SOUTH AFRICA WORKWEAR MARKET ANALYSIS BY SAFETY STANDARD
FIGURE 144. SOUTH AFRICA WORKWEAR MARKET ANALYSIS BY REGIONAL
FIGURE 145. REST OF MEA WORKWEAR MARKET ANALYSIS BY WORKWEAR TYPE
FIGURE 146. REST OF MEA WORKWEAR MARKET ANALYSIS BY END-USE INDUSTRY
FIGURE 147. REST OF MEA WORKWEAR MARKET ANALYSIS BY DISTRIBUTION CHANNEL
FIGURE 148. REST OF MEA WORKWEAR MARKET ANALYSIS BY MATERIAL
FIGURE 149. REST OF MEA WORKWEAR MARKET ANALYSIS BY SAFETY STANDARD
FIGURE 150. REST OF MEA WORKWEAR MARKET ANALYSIS BY REGIONAL
FIGURE 151. KEY BUYING CRITERIA OF WORKWEAR MARKET
FIGURE 152. RESEARCH PROCESS OF MRFR
FIGURE 153. DRO ANALYSIS OF WORKWEAR MARKET
FIGURE 154. DRIVERS IMPACT ANALYSIS: WORKWEAR MARKET
FIGURE 155. RESTRAINTS IMPACT ANALYSIS: WORKWEAR MARKET
FIGURE 156. SUPPLY / VALUE CHAIN: WORKWEAR MARKET
FIGURE 157. WORKWEAR MARKET, BY WORKWEAR TYPE, 2024 (% SHARE)
FIGURE 158. WORKWEAR MARKET, BY WORKWEAR TYPE, 2019 TO 2032 (USD Billions)
FIGURE 159. WORKWEAR MARKET, BY END-USE INDUSTRY, 2024 (% SHARE)
FIGURE 160. WORKWEAR MARKET, BY END-USE INDUSTRY, 2019 TO 2032 (USD Billions)
FIGURE 161. WORKWEAR MARKET, BY DISTRIBUTION CHANNEL, 2024 (% SHARE)
FIGURE 162. WORKWEAR MARKET, BY DISTRIBUTION CHANNEL, 2019 TO 2032 (USD Billions)
FIGURE 163. WORKWEAR MARKET, BY MATERIAL, 2024 (% SHARE)
FIGURE 164. WORKWEAR MARKET, BY MATERIAL, 2019 TO 2032 (USD Billions)
FIGURE 165. WORKWEAR MARKET, BY SAFETY STANDARD, 2024 (% SHARE)
FIGURE 166. WORKWEAR MARKET, BY SAFETY STANDARD, 2019 TO 2032 (USD Billions)
FIGURE 167. WORKWEAR MARKET, BY REGIONAL, 2024 (% SHARE)
FIGURE 168. WORKWEAR MARKET, BY REGIONAL, 2019 TO 2032 (USD Billions)
FIGURE 169. BENCHMARKING OF MAJOR COMPETITORS
Research Process

Data Library Research are conducted by industry experts who offer insight on industry structure, market segmentations technology assessment and competitive landscape (CL), and penetration, as well as on emerging trends. Their analysis is based on primary interviews (~ 80%) and secondary research (~ 20%) as well as years of professional expertise in their respective industries. Adding to this, by analysing historical trends and current market positions, our analysts predict where the market will be headed for the next five years. Furthermore, the varying trends of segment & categories geographically presented are also studied and the estimated based on the primary & secondary research.

In this particular report from the supply side Data Library Research has conducted primary surveys (interviews) with the key level executives (VP, CEO’s, Marketing Director, Business Development Manager and SOFT) of the companies that active & prominent as well as the midsized organization

FIGURE 1: DLR RESEARH PROCESS

research-methodology1

Primary Research

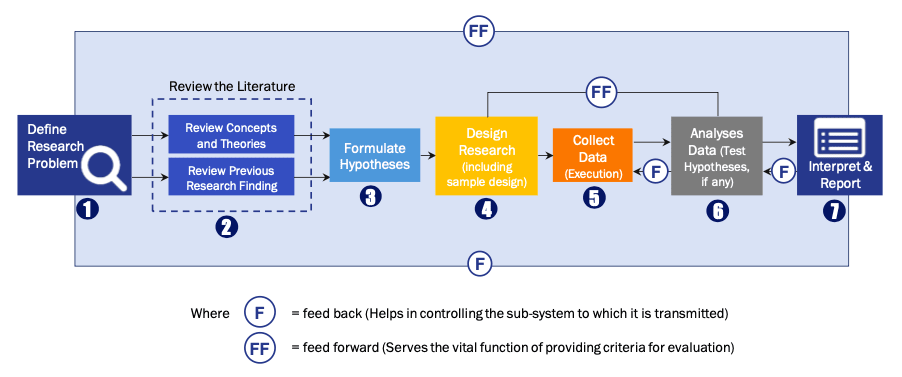
Extensive primary research was conducted to gain a deeper insight of the market and industry performance. The analysis is based on both primary and secondary research as well as years of professional expertise in the respective industries.

In addition to analysing current and historical trends, our analysts predict where the market is headed over the next five years.

It varies by segment for these categories geographically presented in the list of market tables. Speaking about this particular report we have conducted primary surveys (interviews) with the key level executives (VP, CEO’s, Marketing Director, Business Development Manager and many more) of the major players active in the market.

Secondary Research

Secondary research was mainly used to collect and identify information useful for the extensive, technical, market-oriented, and Friend’s study of the Global Extra Neutral Alcohol. It was also used to obtain key information about major players, market classification and segmentation according to the industry trends, geographical markets, and developments related to the market and technology perspectives. For this study, analysts have gathered information from various credible sources, such as annual reports, sec filings, journals, white papers, SOFT presentations, and company web sites.

Market Size Estimation

Both, top-down and bottom-up approaches were used to estimate and validate the size of the Global market and to estimate the size of various other dependent submarkets in the overall Extra Neutral Alcohol. The key players in the market were identified through secondary research and their market contributions in the respective geographies were determined through primary and secondary research.

Forecast Model

research-methodology2

Happy to Assist You

If you have a question?

[email protected]

IND : +91 955 279 0357

Browse Related Reports