Aircraft Battery Charging And Testing Market Overview and Analysis
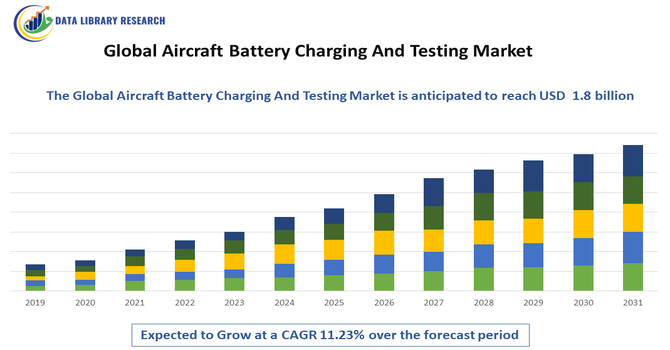
- The Global Aircraft Battery Charging and Testing Market size was valued at USD 662.57 million in 2026 and is expected to reach USD 1.8 billion in 2033, growing with a CAGR of 11.23% from 2026 to 2033.
Get Complete Analysis Of The Report - Download Updated Free Sample PDF
The Global Aircraft Battery Charging and Testing Market encompasses the systems, equipment, and services used to charge, maintain, and assess aircraft batteries—critical for safe and reliable aircraft operations. This market includes battery chargers, test benches, analyzers, and diagnostic tools designed for various aircraft battery types such as lead-acid, nickel-cadmium, and lithium-ion. Growth is driven by increasing air traffic, fleet modernization, and stringent aviation safety standards requiring regular battery performance verification. The market also benefits from advancements in battery technology, predictive maintenance, and automation.
Aircraft Battery Charging And Testing Market Latest Trends
The Global Aircraft Battery Charging and Testing Market has been shaped by technological advancements and the increasing adoption of advanced battery systems, particularly lithium-ion and other high-density chemistries, which offer better energy efficiency and lighter weight. Demand has been driven by the expanding aviation sector and stringent safety regulations from bodies such as the FAA and EASA that emphasize regular, precise battery diagnostics and maintenance. Smart charging units, AI-enabled health-monitoring systems, and portable test equipment have gained traction as airlines and MRO providers seek operational efficiency and compliance.
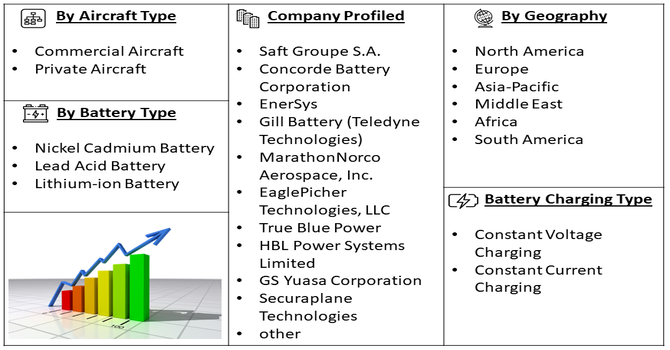
Segmentation: The Global Aircraft Battery Charging and Testing Market is segmented by Aircraft Type (Commercial Aircraft and Private Aircraft), Battery Type (Nickel Cadmium Battery, Lead Acid Battery and Lithium-ion Battery), Battery Charging Type (Constant Voltage Charging and Constant Current Charging), Battery Testing Type (Capacity Test and Charge Acceptance Test), and Geography (North America, Europe, Asia-Pacific, Middle East and Africa, and South America). The report provides the value (in USD million) for the above segments.
For Detailed Market Segmentation - Get a Free Sample PDF
Market Drivers:
- Increasing Air Traffic and Fleet Expansion
The global rise in air travel and growing aircraft fleets have directly boosted demand for battery charging and testing systems. As airlines expand routes and modernize fleets, the need for reliable battery maintenance grows to ensure operational safety and minimize downtime. Regular charging and diagnostic testing are essential for pre-flight readiness, especially for aircraft using auxiliary power units and electrical systems. Additionally, fleet growth increases the volume of maintenance, repair, and overhaul (MRO) activities, creating steady demand for charging equipment and testing tools across airports and MRO facilities worldwide. This expansion supports sustained market growth.
- Stricter Aviation Safety Regulations and Compliance
Stringent regulatory standards from authorities like the FAA, EASA, and ICAO have intensified the need for accurate battery testing and maintenance procedures. Aircraft batteries are critical for emergency power, start-up, and onboard systems, and any failure can lead to safety risks. Regulations require routine inspection, capacity testing, and performance validation, driving demand for advanced charging and testing equipment. The increasing adoption of lithium-ion and other high-energy batteries also necessitates specialized chargers and diagnostics to prevent overcharging, thermal runaway, and degradation. As compliance requirements become more rigorous, airlines and MRO providers invest in modern battery testing solutions.
Market Restraints
- High Costs of Advanced Charging and Testing Equipment
Despite growing demand, the market faces constraints due to the high capital costs of sophisticated charging and testing systems. Advanced equipment designed for lithium-ion and high-capacity batteries often requires significant investment in technology, calibration, and skilled personnel. Smaller airlines and regional operators may find it challenging to justify these costs, leading to slower adoption or reliance on third-party MRO providers. Additionally, ongoing maintenance, software updates, and compliance certifications add to operational expenses. This cost barrier can limit market growth, particularly in developing regions where budget constraints restrict large-scale equipment procurement and upgrades.
Socioeconomic Impact on Aircraft Battery Charging And Testing Market
The aircraft battery charging and testing market supports aviation safety, reliability, and job creation across manufacturing, maintenance, repair, and overhaul (MRO) sectors. As air travel grows globally, reliable battery systems and testing services have become essential for maintaining aircraft operations, directly impacting airline performance and passenger safety. The market’s growth stimulates investment in engineering skills and high-tech manufacturing, particularly in regions expanding their aviation infrastructure. Additionally, the push toward more efficient and environmentally friendly battery technologies aligns with broader socioeconomic goals of reducing emissions and improving energy use, contributing to advancements in sustainable aviation practices.
Segmental Analysis:
- Commercial Aircraft segment is expected to witness the highest growth over the forecast period
The commercial aircraft segment was projected to register the fastest growth in the Global Aircraft Battery Charging and Testing Market due to the rapid expansion of passenger air travel and increased aircraft deliveries. Commercial airlines require frequent, reliable battery maintenance to ensure operational efficiency, safety, and regulatory compliance, driving demand for advanced charging and testing equipment. With more flights and larger fleets worldwide, commercial operators prioritized robust battery systems and scheduled performance diagnostics. This segment’s dominance reflects its substantial share, supported by global aviation growth and continued investments in airline operations and fleet modernization.
- Lead Acid Battery segment is expected to witness the highest growth over the forecast period
The lead acid battery segment was anticipated to witness significant growth during the forecast period due to its cost-effectiveness, established use in aviation, and reliable performance in smaller and legacy aircraft. Despite the increasing adoption of newer battery technologies, lead acid batteries remained an important part of aircraft power systems, especially where cost constraints and proven reliability were priorities. Technological enhancements improved their energy density and charging characteristics, boosting their continued use in general aviation and maintenance environments. Demand for lead acid charging and testing solutions grew as operators sought dependable, affordable battery management options in diverse aviation applications.
- Constant Voltage Charging segment is expected to witness the highest growth over the forecast period
The constant voltage charging segment was expected to exhibit notable growth as it remained a widely used method for aircraft battery charging due to its ability to maintain stable voltage inputs necessary for safe and efficient battery maintenance. Many aircraft battery systems, particularly conventional lead acid and other onboard power units, required precise voltage regulation to avoid overcharge, extend battery lifespan, and ensure readiness. As operators adopted advanced charging units with sophisticated constant voltage control and monitoring functions, demand grew for equipment supporting regulated voltage supply and improved charging quality, reinforcing this segment’s strengthened market position.
- Charge Acceptance Test segment is expected to witness the highest growth over the forecast period
The charge acceptance test segment was projected to grow rapidly because of its critical role in evaluating battery efficiency and health by measuring the battery’s capability to accept charge under real conditions. With aviation safety regulations demanding rigorous testing protocols, charge acceptance testing became essential for both preventive maintenance and reliability assurance. Technological advancements in diagnostic tools allowed more accurate measurement of battery performance, enabling maintenance teams to detect degradation early, prevent in-flight failures, and optimize battery life cycles. This technical importance and regulatory emphasis supported strong growth for the charge acceptance test segment in the market.
- North America Region is expected to witness the highest growth over the forecast period
The North America region was expected to witness the highest growth in the Global Aircraft Battery Charging and Testing Market due to the presence of major aircraft manufacturers, high air traffic volumes, and substantial investments in aviation infrastructure. The U.S. dominated regional demand with significant airline fleets and stringent regulatory standards requiring comprehensive battery maintenance and testing.
Strong aerospace R&D, significant MRO activities, and skilled technical capabilities further solidified the region’s leading position. For instance, in 2024, Archer Aviation’s successful battery pack drop testing for its Midnight eVTOL at the National Institute for Aviation Research strengthened confidence in electric propulsion safety and certification readiness. This milestone increased demand for advanced battery charging and testing equipment in North America, as manufacturers and regulators intensified validation and maintenance requirements for emerging eVTOL platforms, supporting growth in the region’s aircraft battery testing market.
Continued expansion of commercial and general aviation, supported by corporate and defense aviation requirements, sustained robust demand for advanced battery charging and testing solutions. As fleets grew and flight operations increased, airlines and operators prioritized reliable battery performance to prevent downtime and ensure safety. Defense and business aviation also drove demand for high-performance, mission-critical power systems, prompting investments in sophisticated charging equipment and diagnostic tools.
| Report Matrics |
Details |
| Market Size Value |
USD 1.8 billion |
| Growth Rate |
CAGR of 11.23 % |
| Forecast |
2026-2033 |
| Historical data |
2021-2024 |
| Base Year |
2025 |
| Report Coverage |
Forecasted revenue, company rating, competitive environment, growth drivers, and trends |
| Segment Coverage |
Type, Application, End-User, Geography |
| Regional Scope |
North America, Europe, Asia Pacific, Middle East |
| Customized scope |
Free customization of reports (With 3 months' analysis support) |
| To Learn More About This Report |
Request a Free Sample Copy |
Aircraft Battery Charging And Testing Market Competitive Landscape
The competitive landscape of the aircraft battery charging and testing market includes established aerospace and battery technology firms as well as specialized service providers. Key players focus on product innovation, strategic partnerships, and expanded service portfolios to meet stringent regulatory requirements and diverse customer needs. Competition hinges on technological leadership in battery diagnostics, real-time monitoring, and integrated charging solutions capable of handling advanced battery chemistries. Mergers, collaborations with aircraft OEMs, and focused R&D investments are common strategies to enhance offerings and geographic reach. The market features both large aerospace incumbents and niche firms that leverage specialized testing capabilities to strengthen their positions.
The major players for the above market are:
- Saft Groupe S.A.
- Concorde Battery Corporation
- EnerSys
- Gill Battery (Teledyne Technologies)
- MarathonNorco Aerospace, Inc.
- EaglePicher Technologies, LLC
- True Blue Power
- HBL Power Systems Limited
- GS Yuasa Corporation
- Securaplane Technologies
- ATEQ Aviation
- Blue Skies Aviation
- Duncan Aviation
- Arbin Instruments
- The Boeing Company
- Sichuan Changhong Battery Co., Ltd.
- Kokam Co., Ltd.
- ACME Aerospace, Inc.
- Aero Design Labs
Recent Development
- In September 2025, ATEQ Aviation’s distribution agreement with Pilot John International expanded access to its aviation testing equipment across airlines, OEMs, military, and general aviation operators. By leveraging Pilot John’s network, ATEQ strengthened market reach for battery testers and related test sets, boosting equipment availability and competitive distribution. This partnership supported growth in the global aircraft battery charging and testing market by improving service penetration and customer access.
- In June 2025, Pratt & Whitney Canada’s milestone in testing the RTX Hybrid-Electric Flight Demonstrator’s integrated propulsion system and batteries, along with AeroTEC’s selection for future flight testing, accelerated development of hybrid-electric aircraft technology. This progress increased demand for advanced battery charging and testing solutions, as emerging electric propulsion systems required rigorous validation and maintenance support, strengthening growth in the global aircraft battery charging and testing market.
Frequently Asked Questions (FAQ) :
Q1. What are the main growth-driving factors for this market?
The market is primarily driven by the rapid expansion of global commercial aviation fleets and the increasing adoption of More Electric Aircraft (MEA) architectures. As airlines transition to advanced lithium-ion battery systems to reduce weight and improve efficiency, the demand for sophisticated, high-precision charging and diagnostic equipment grows to ensure operational safety.
Q2. What are the main restraining factors for this market?
High initial capital investment for advanced testing infrastructure and the stringent regulatory certifications required by aviation authorities act as significant barriers. Furthermore, the technical complexity of maintaining diverse battery chemistries—ranging from traditional lead-acid to advanced lithium—requires specialized technician training, which can limit market adoption in developing regional aviation sectors.
Q3. Which segment is expected to witness high growth?
The Lithium-ion battery segment is expected to witness the highest growth. This surge is fueled by the aviation industry’s shift toward sustainable, lightweight power solutions that offer higher energy density. Consequently, there is an urgent need for specialized chargers and testers capable of managing the unique thermal and balancing requirements of these cells.
Q4. Who are the top major players for this market?
Key players leading the market include Marathon Norco Aerospace, Saft (TotalEnergies), and Christie Electric Corp. Other prominent contributors are AeroDesign Services, Lamar Technologies, and Avicenna. These companies focus on developing universal charging systems and automated testing solutions that can interface with multiple battery types to streamline maintenance for global airline operators.
Q5. Which country is the largest player?
The United States is the largest player in this market, holding a dominant share due to its massive aerospace manufacturing base led by giants like Boeing. The country’s sophisticated MRO (Maintenance, Repair, and Overhaul) infrastructure and early adoption of advanced battery technologies in military and commercial sectors sustain its market leadership.
List of Figures
Figure 1: Global Aircraft Battery Charging And Testing Market Revenue Breakdown (USD Billion, %) by Region, 2022 & 2029
Figure 2: Global Aircraft Battery Charging And Testing Market Value Share (%), By Segment 1, 2022 & 2029
Figure 3: Global Aircraft Battery Charging And Testing Market Forecast (USD Billion), by Sub-Segment 1, 2018-2029
Figure 4: Global Aircraft Battery Charging And Testing Market Forecast (USD Billion), by Sub-Segment 2, 2018-2029
Figure 5: Global Aircraft Battery Charging And Testing Market Value Share (%), By Segment 2, 2022 & 2029
Figure 6: Global Aircraft Battery Charging And Testing Market Forecast (USD Billion), by Sub-Segment 1, 2018-2029
Figure 7: Global Aircraft Battery Charging And Testing Market Forecast (USD Billion), by Sub-Segment 2, 2018-2029
Figure 8: Global Aircraft Battery Charging And Testing Market Forecast (USD Billion), by Sub-Segment 3, 2018-2029
Figure 9: Global Aircraft Battery Charging And Testing Market Forecast (USD Billion), by Others, 2018-2029
Figure 10: Global Aircraft Battery Charging And Testing Market Value Share (%), By Segment 3, 2022 & 2029
Figure 11: Global Aircraft Battery Charging And Testing Market Forecast (USD Billion), by Sub-Segment 1, 2018-2029
Figure 12: Global Aircraft Battery Charging And Testing Market Forecast (USD Billion), by Sub-Segment 2, 2018-2029
Figure 13: Global Aircraft Battery Charging And Testing Market Forecast (USD Billion), by Sub-Segment 3, 2018-2029
Figure 14: Global Aircraft Battery Charging And Testing Market Forecast (USD Billion), by Others, 2018-2029
Figure 15: Global Aircraft Battery Charging And Testing Market Value (USD Billion), by Region, 2022 & 2029
Figure 16: North America Aircraft Battery Charging And Testing Market Value Share (%), By Segment 1, 2022 & 2029
Figure 17: North America Aircraft Battery Charging And Testing Market Forecast (USD Billion), by Sub-Segment 1, 2018-2029
Figure 18: North America Aircraft Battery Charging And Testing Market Forecast (USD Billion), by Sub-Segment 2, 2018-2029
Figure 19: North America Aircraft Battery Charging And Testing Market Value Share (%), By Segment 2, 2022 & 2029
Figure 20: North America Aircraft Battery Charging And Testing Market Forecast (USD Billion), by Sub-Segment 1, 2018-2029
Figure 21: North America Aircraft Battery Charging And Testing Market Forecast (USD Billion), by Sub-Segment 2, 2018-2029
Figure 22: North America Aircraft Battery Charging And Testing Market Forecast (USD Billion), by Sub-Segment 3, 2018-2029
Figure 23: North America Aircraft Battery Charging And Testing Market Forecast (USD Billion), by Others, 2018-2029
Figure 24: North America Aircraft Battery Charging And Testing Market Value Share (%), By Segment 3, 2022 & 2029
Figure 25: North America Aircraft Battery Charging And Testing Market Forecast (USD Billion), by Sub-Segment 1, 2018-2029
Figure 26: North America Aircraft Battery Charging And Testing Market Forecast (USD Billion), by Sub-Segment 2, 2018-2029
Figure 27: North America Aircraft Battery Charging And Testing Market Forecast (USD Billion), by Sub-Segment 3, 2018-2029
Figure 28: North America Aircraft Battery Charging And Testing Market Forecast (USD Billion), by Others, 2018-2029
Figure 29: North America Aircraft Battery Charging And Testing Market Forecast (USD Billion), by U.S., 2018-2029
Figure 30: North America Aircraft Battery Charging And Testing Market Forecast (USD Billion), by Canada, 2018-2029
Figure 31: Latin America Aircraft Battery Charging And Testing Market Value Share (%), By Segment 1, 2022 & 2029
Figure 32: Latin America Aircraft Battery Charging And Testing Market Forecast (USD Billion), by Sub-Segment 1, 2018-2029
Figure 33: Latin America Aircraft Battery Charging And Testing Market Forecast (USD Billion), by Sub-Segment 2, 2018-2029
Figure 34: Latin America Aircraft Battery Charging And Testing Market Value Share (%), By Segment 2, 2022 & 2029
Figure 35: Latin America Aircraft Battery Charging And Testing Market Forecast (USD Billion), by Sub-Segment 1, 2018-2029
Figure 36: Latin America Aircraft Battery Charging And Testing Market Forecast (USD Billion), by Sub-Segment 2, 2018-2029
Figure 37: Latin America Aircraft Battery Charging And Testing Market Forecast (USD Billion), by Sub-Segment 3, 2018-2029
Figure 38: Latin America Aircraft Battery Charging And Testing Market Forecast (USD Billion), by Others, 2018-2029
Figure 39: Latin America Aircraft Battery Charging And Testing Market Value Share (%), By Segment 3, 2022 & 2029
Figure 40: Latin America Aircraft Battery Charging And Testing Market Forecast (USD Billion), by Sub-Segment 1, 2018-2029
Figure 41: Latin America Aircraft Battery Charging And Testing Market Forecast (USD Billion), by Sub-Segment 2, 2018-2029
Figure 42: Latin America Aircraft Battery Charging And Testing Market Forecast (USD Billion), by Sub-Segment 3, 2018-2029
Figure 43: Latin America Aircraft Battery Charging And Testing Market Forecast (USD Billion), by Others, 2018-2029
Figure 44: Latin America Aircraft Battery Charging And Testing Market Forecast (USD Billion), by Brazil, 2018-2029
Figure 45: Latin America Aircraft Battery Charging And Testing Market Forecast (USD Billion), by Mexico, 2018-2029
Figure 46: Latin America Aircraft Battery Charging And Testing Market Forecast (USD Billion), by Rest of Latin America, 2018-2029
Figure 47: Europe Aircraft Battery Charging And Testing Market Value Share (%), By Segment 1, 2022 & 2029
Figure 48: Europe Aircraft Battery Charging And Testing Market Forecast (USD Billion), by Sub-Segment 1, 2018-2029
Figure 49: Europe Aircraft Battery Charging And Testing Market Forecast (USD Billion), by Sub-Segment 2, 2018-2029
Figure 50: Europe Aircraft Battery Charging And Testing Market Value Share (%), By Segment 2, 2022 & 2029
Figure 51: Europe Aircraft Battery Charging And Testing Market Forecast (USD Billion), by Sub-Segment 1, 2018-2029
Figure 52: Europe Aircraft Battery Charging And Testing Market Forecast (USD Billion), by Sub-Segment 2, 2018-2029
Figure 53: Europe Aircraft Battery Charging And Testing Market Forecast (USD Billion), by Sub-Segment 3, 2018-2029
Figure 54: Europe Aircraft Battery Charging And Testing Market Forecast (USD Billion), by Others, 2018-2029
Figure 55: Europe Aircraft Battery Charging And Testing Market Value Share (%), By Segment 3, 2022 & 2029
Figure 56: Europe Aircraft Battery Charging And Testing Market Forecast (USD Billion), by Sub-Segment 1, 2018-2029
Figure 57: Europe Aircraft Battery Charging And Testing Market Forecast (USD Billion), by Sub-Segment 2, 2018-2029
Figure 58: Europe Aircraft Battery Charging And Testing Market Forecast (USD Billion), by Sub-Segment 3, 2018-2029
Figure 59: Europe Aircraft Battery Charging And Testing Market Forecast (USD Billion), by Others, 2018-2029
Figure 60: Europe Aircraft Battery Charging And Testing Market Forecast (USD Billion), by U.K., 2018-2029
Figure 61: Europe Aircraft Battery Charging And Testing Market Forecast (USD Billion), by Germany, 2018-2029
Figure 62: Europe Aircraft Battery Charging And Testing Market Forecast (USD Billion), by France, 2018-2029
Figure 63: Europe Aircraft Battery Charging And Testing Market Forecast (USD Billion), by Italy, 2018-2029
Figure 64: Europe Aircraft Battery Charging And Testing Market Forecast (USD Billion), by Spain, 2018-2029
Figure 65: Europe Aircraft Battery Charging And Testing Market Forecast (USD Billion), by Russia, 2018-2029
Figure 66: Europe Aircraft Battery Charging And Testing Market Forecast (USD Billion), by Rest of Europe, 2018-2029
Figure 67: Asia Pacific Aircraft Battery Charging And Testing Market Value Share (%), By Segment 1, 2022 & 2029
Figure 68: Asia Pacific Aircraft Battery Charging And Testing Market Forecast (USD Billion), by Sub-Segment 1, 2018-2029
Figure 69: Asia Pacific Aircraft Battery Charging And Testing Market Forecast (USD Billion), by Sub-Segment 2, 2018-2029
Figure 70: Asia Pacific Aircraft Battery Charging And Testing Market Value Share (%), By Segment 2, 2022 & 2029
Figure 71: Asia Pacific Aircraft Battery Charging And Testing Market Forecast (USD Billion), by Sub-Segment 1, 2018-2029
Figure 72: Asia Pacific Aircraft Battery Charging And Testing Market Forecast (USD Billion), by Sub-Segment 2, 2018-2029
Figure 73: Asia Pacific Aircraft Battery Charging And Testing Market Forecast (USD Billion), by Sub-Segment 3, 2018-2029
Figure 74: Asia Pacific Aircraft Battery Charging And Testing Market Forecast (USD Billion), by Others, 2018-2029
Figure 75: Asia Pacific Aircraft Battery Charging And Testing Market Value Share (%), By Segment 3, 2022 & 2029
Figure 76: Asia Pacific Aircraft Battery Charging And Testing Market Forecast (USD Billion), by Sub-Segment 1, 2018-2029
Figure 77: Asia Pacific Aircraft Battery Charging And Testing Market Forecast (USD Billion), by Sub-Segment 2, 2018-2029
Figure 78: Asia Pacific Aircraft Battery Charging And Testing Market Forecast (USD Billion), by Sub-Segment 3, 2018-2029
Figure 79: Asia Pacific Aircraft Battery Charging And Testing Market Forecast (USD Billion), by Others, 2018-2029
Figure 80: Asia Pacific Aircraft Battery Charging And Testing Market Forecast (USD Billion), by China, 2018-2029
Figure 81: Asia Pacific Aircraft Battery Charging And Testing Market Forecast (USD Billion), by India, 2018-2029
Figure 82: Asia Pacific Aircraft Battery Charging And Testing Market Forecast (USD Billion), by Japan, 2018-2029
Figure 83: Asia Pacific Aircraft Battery Charging And Testing Market Forecast (USD Billion), by Australia, 2018-2029
Figure 84: Asia Pacific Aircraft Battery Charging And Testing Market Forecast (USD Billion), by Southeast Asia, 2018-2029
Figure 85: Asia Pacific Aircraft Battery Charging And Testing Market Forecast (USD Billion), by Rest of Asia Pacific, 2018-2029
Figure 86: Middle East & Africa Aircraft Battery Charging And Testing Market Value Share (%), By Segment 1, 2022 & 2029
Figure 87: Middle East & Africa Aircraft Battery Charging And Testing Market Forecast (USD Billion), by Sub-Segment 1, 2018-2029
Figure 88: Middle East & Africa Aircraft Battery Charging And Testing Market Forecast (USD Billion), by Sub-Segment 2, 2018-2029
Figure 89: Middle East & Africa Aircraft Battery Charging And Testing Market Value Share (%), By Segment 2, 2022 & 2029
Figure 90: Middle East & Africa Aircraft Battery Charging And Testing Market Forecast (USD Billion), by Sub-Segment 1, 2018-2029
Figure 91: Middle East & Africa Aircraft Battery Charging And Testing Market Forecast (USD Billion), by Sub-Segment 2, 2018-2029
Figure 92: Middle East & Africa Aircraft Battery Charging And Testing Market Forecast (USD Billion), by Sub-Segment 3, 2018-2029
Figure 93: Middle East & Africa Aircraft Battery Charging And Testing Market Forecast (USD Billion), by Others, 2018-2029
Figure 94: Middle East & Africa Aircraft Battery Charging And Testing Market Value Share (%), By Segment 3, 2022 & 2029
Figure 95: Middle East & Africa Aircraft Battery Charging And Testing Market Forecast (USD Billion), by Sub-Segment 1, 2018-2029
Figure 96: Middle East & Africa Aircraft Battery Charging And Testing Market Forecast (USD Billion), by Sub-Segment 2, 2018-2029
Figure 97: Middle East & Africa Aircraft Battery Charging And Testing Market Forecast (USD Billion), by Sub-Segment 3, 2018-2029
Figure 98: Middle East & Africa Aircraft Battery Charging And Testing Market Forecast (USD Billion), by Others, 2018-2029
Figure 99: Middle East & Africa Aircraft Battery Charging And Testing Market Forecast (USD Billion), by GCC, 2018-2029
Figure 100: Middle East & Africa Aircraft Battery Charging And Testing Market Forecast (USD Billion), by South Africa, 2018-2029
Figure 101: Middle East & Africa Aircraft Battery Charging And Testing Market Forecast (USD Billion), by Rest of Middle East & Africa, 2018-2029
List of Tables
Table 1: Global Aircraft Battery Charging And Testing Market Revenue (USD Billion) Forecast, by Segment 1, 2018-2029
Table 2: Global Aircraft Battery Charging And Testing Market Revenue (USD Billion) Forecast, by Segment 2, 2018-2029
Table 3: Global Aircraft Battery Charging And Testing Market Revenue (USD Billion) Forecast, by Segment 3, 2018-2029
Table 4: Global Aircraft Battery Charging And Testing Market Revenue (USD Billion) Forecast, by Region, 2018-2029
Table 5: North America Aircraft Battery Charging And Testing Market Revenue (USD Billion) Forecast, by Segment 1, 2018-2029
Table 6: North America Aircraft Battery Charging And Testing Market Revenue (USD Billion) Forecast, by Segment 2, 2018-2029
Table 7: North America Aircraft Battery Charging And Testing Market Revenue (USD Billion) Forecast, by Segment 3, 2018-2029
Table 8: North America Aircraft Battery Charging And Testing Market Revenue (USD Billion) Forecast, by Country, 2018-2029
Table 9: Europe Aircraft Battery Charging And Testing Market Revenue (USD Billion) Forecast, by Segment 1, 2018-2029
Table 10: Europe Aircraft Battery Charging And Testing Market Revenue (USD Billion) Forecast, by Segment 2, 2018-2029
Table 11: Europe Aircraft Battery Charging And Testing Market Revenue (USD Billion) Forecast, by Segment 3, 2018-2029
Table 12: Europe Aircraft Battery Charging And Testing Market Revenue (USD Billion) Forecast, by Country, 2018-2029
Table 13: Latin America Aircraft Battery Charging And Testing Market Revenue (USD Billion) Forecast, by Segment 1, 2018-2029
Table 14: Latin America Aircraft Battery Charging And Testing Market Revenue (USD Billion) Forecast, by Segment 2, 2018-2029
Table 15: Latin America Aircraft Battery Charging And Testing Market Revenue (USD Billion) Forecast, by Segment 3, 2018-2029
Table 16: Latin America Aircraft Battery Charging And Testing Market Revenue (USD Billion) Forecast, by Country, 2018-2029
Table 17: Asia Pacific Aircraft Battery Charging And Testing Market Revenue (USD Billion) Forecast, by Segment 1, 2018-2029
Table 18: Asia Pacific Aircraft Battery Charging And Testing Market Revenue (USD Billion) Forecast, by Segment 2, 2018-2029
Table 19: Asia Pacific Aircraft Battery Charging And Testing Market Revenue (USD Billion) Forecast, by Segment 3, 2018-2029
Table 20: Asia Pacific Aircraft Battery Charging And Testing Market Revenue (USD Billion) Forecast, by Country, 2018-2029
Table 21: Middle East & Africa Aircraft Battery Charging And Testing Market Revenue (USD Billion) Forecast, by Segment 1, 2018-2029
Table 22: Middle East & Africa Aircraft Battery Charging And Testing Market Revenue (USD Billion) Forecast, by Segment 2, 2018-2029
Table 23: Middle East & Africa Aircraft Battery Charging And Testing Market Revenue (USD Billion) Forecast, by Segment 3, 2018-2029
Table 24: Middle East & Africa Aircraft Battery Charging And Testing Market Revenue (USD Billion) Forecast, by Country, 2018-2029
Research Process
Data Library Research are conducted by industry experts who offer insight on
industry structure, market segmentations technology assessment and competitive landscape (CL), and penetration, as well as on emerging trends. Their analysis is based on primary interviews (~ 80%) and secondary research (~ 20%) as well as years of professional expertise in their respective industries. Adding to this, by analysing historical trends and current market positions, our analysts predict where the market will be headed for the next five years. Furthermore, the varying trends of segment & categories geographically presented are also studied and the estimated based on the primary & secondary research.
In this particular report from the supply side Data Library Research has conducted primary surveys (interviews) with the key level executives (VP, CEO’s, Marketing Director, Business Development Manager
and SOFT) of the companies that active & prominent as well as the midsized organization
FIGURE 1: DLR RESEARH PROCESS
![research-methodology1]()
Primary Research
Extensive primary research was conducted to gain a deeper insight of the market and industry performance. The analysis is based on both primary and secondary research as well as years of professional expertise in the respective industries.
In addition to analysing current and historical trends, our analysts predict where the market is headed over the next five years.
It varies by segment for these categories geographically presented in the list of market tables. Speaking about this particular report we have conducted primary surveys (interviews) with the key level executives (VP, CEO’s, Marketing Director, Business Development Manager and many more) of the major players active in the market.
Secondary Research
Secondary research was mainly used to collect and identify information useful for the extensive, technical, market-oriented, and Friend’s study of the Global Extra Neutral Alcohol. It was also used to obtain key information about major players, market classification and segmentation according to the industry trends, geographical markets, and developments related to the market and technology perspectives. For this study, analysts have gathered information from various credible sources, such as annual reports, sec filings, journals, white papers, SOFT presentations, and company web sites.
Market Size Estimation
Both, top-down and bottom-up approaches were used to estimate and validate the size of the Global market and to estimate the size of various other dependent submarkets in the overall Extra Neutral Alcohol. The key players in the market were identified through secondary research and their market contributions in the respective geographies were determined through primary and secondary research.
Forecast Model
![research-methodology2]()