At-Home Prostate Cancer Testing Market Overview and Analysis
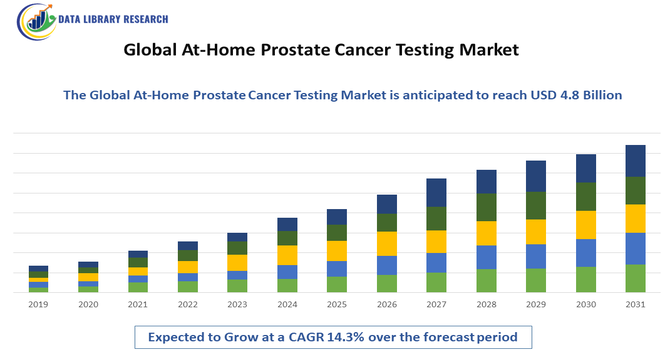
- At-Home Prostate Cancer Testing Market size stood at USD 2.07 billion in 2025 and is forecast to achieve USD 4.8 billion by 2032, registering a 14.3% CAGR, from 2025 to 2032.
Get Complete Analysis Of The Report - Download Updated Free Sample PDF
The growth of the Global At-Home Prostate Cancer Testing Market is driven by the increasing emphasis on early cancer detection and preventive healthcare, coupled with rising awareness of prostate cancer among aging male populations worldwide. Growing preference for convenient, non-invasive, and privacy-focused diagnostic solutions is encouraging the adoption of at-home testing kits. Technological advancements in biomarker-based assays and sample collection methods, along with improved accuracy and reliability of test results, are further supporting market expansion.
At-Home Prostate Cancer Testing Market Latest Trends
The Global At-Home Prostate Cancer Testing Market is witnessing notable trends driven by the shift toward personalized and decentralized healthcare diagnostics. There is increasing adoption of PSA-based and advanced biomarker testing kits that allow reliable sample collection from home with improved accuracy. Integration of digital health platforms, mobile apps, and teleconsultation services is enabling users to receive test results, medical guidance, and follow-up recommendations remotely. Companies are also focusing on user-friendly sample collection methods, such as finger-prick blood tests and urine-based assays, to enhance compliance.
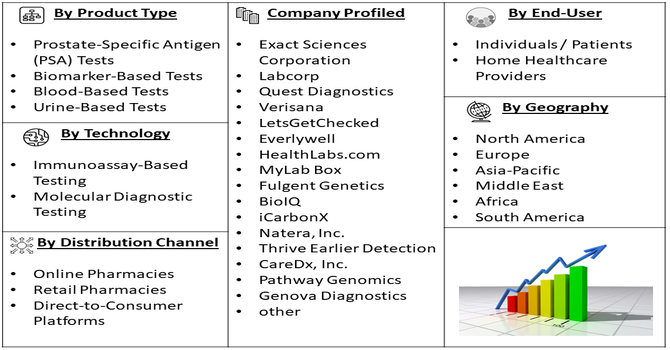
Segmentation: Global At-Home Prostate Cancer Testing Market is segmented By Test Type (Prostate-Specific Antigen (PSA) Tests, Biomarker-Based Tests), Sample Type (Blood-Based Tests, Urine-Based Tests), Distribution Channel (Online Pharmacies, Retail Pharmacies, Direct-to-Consumer Platforms), End-User (Individuals / Patients, Home Healthcare Providers), Technology (Immunoassay-Based Testing, Molecular Diagnostic Testing), and Geography (North America, Europe, Asia-Pacific, Middle East and Africa, and South America). The report provides the value (in USD million) for the above segments.
For Detailed Market Segmentation - Get a Free Sample PDF
Market Drivers:
- Rising Awareness and Need for Early Prostate Cancer Detection
Growing awareness about prostate cancer, particularly among aging male populations, is a major driver of the at-home testing market. For instance, Cancer Globocan reported that Prostate cancer cases are rising globally, with approximately 1.4-1.5 million new cases annually (2022 ) and projections reaching ~2.9 million by 2040 due to aging populations. Early detection significantly improves treatment outcomes and survival rates, prompting healthcare providers and public health organizations to encourage routine screening.
At-home prostate cancer testing kits offer a convenient and private alternative to traditional clinical screenings, reducing psychological barriers such as discomfort or stigma. For instance, in March 2025, the U.S. FDA had granted Breakthrough Device Designation to an AI-powered PSA diagnostic platform developed by Exact Check Diagnostics. The innovative test combined PSA measurements with machine learning algorithms to enhance specificity, minimize false positives, and improve the accuracy of early prostate cancer detection. Thus, the increased health education campaigns and screening initiatives are motivating individuals to proactively monitor prostate health, thereby driving sustained demand for at-home testing solutions.
- Expansion of Telehealth and Direct-to-Consumer Diagnostic Models
The rapid growth of telehealth services and direct-to-consumer healthcare platforms is accelerating adoption of at-home prostate cancer testing. These models enable users to order test kits online, collect samples at home, and receive results digitally, often accompanied by virtual medical consultations.
In July 2023, Quest Diagnostics, through its subspecialty pathology division, had developed a new prostate cancer biomarker test named AmeriPath. The company had collaborated with Australian clinical diagnostics firm Envision Sciences Pty Ltd to advance the test, aiming to improve early detection and diagnostic accuracy for prostate cancer patients. This approach improves accessibility, especially for individuals in remote or underserved areas, while reducing dependency on hospital visits. The integration of digital reporting, remote physician support, and personalized health insights is enhancing user confidence and driving market growth.
Market Restraints:
- Limited Regulatory Standardization and Clinical Acceptance
Regulatory approval processes and clinical acceptance of at-home prostate cancer testing vary across regions, posing a significant restraint. In some markets, lack of clear regulatory frameworks for direct-to-consumer diagnostic kits raises concerns about test quality, reliability, and data security. Additionally, some healthcare professionals remain cautious about relying on at-home test results without confirmatory clinical testing. This hesitation, combined with inconsistent reimbursement policies, can restrict market penetration and slow adoption, particularly in highly regulated healthcare systems.
Socioeconomic Impact on the At-Home Prostate Cancer Testing Market
The global at-home prostate cancer testing market has had a meaningful socioeconomic impact by improving early detection, healthcare accessibility, and patient empowerment, particularly among aging male populations and those in remote or underserved areas. By reducing dependence on hospital visits, these tests lowered healthcare costs, minimized time away from work, and eased pressure on public health systems. Increased awareness and early diagnosis supported better treatment outcomes, potentially reducing long-term medical expenses and productivity losses. The market also stimulated innovation, job creation in diagnostics and digital health, and promoted preventive healthcare behaviors, contributing to improved quality of life and broader economic efficiency.
Segmental Analysis:
- Prostate-Specific Antigen (PSA) Tests segment is expected to witness the highest growth over the forecast period
PSA tests represent a widely adopted at-home screening method due to their clinical relevance, ease of use, and established role in early prostate cancer detection. These tests measure PSA levels in blood samples collected at home, enabling individuals to monitor prostate health without visiting healthcare facilities.
Growing awareness of routine screening and improvements in test accuracy are supporting continued demand for PSA-based at-home kits. For instance, in January 2025, Roche Diagnostics announced the commercial launch of a high-sensitivity PSA assay within its Cobas diagnostic systems. The upgraded assay allowed healthcare providers to detect minor variations in PSA levels, enhancing patient monitoring and supporting earlier intervention strategies for improved prostate cancer management.
- Blood-Based Tests segment is expected to witness the highest growth over the forecast period
Blood-based tests dominate the market as PSA detection primarily relies on blood samples. Advances in finger-prick collection devices have improved sample reliability and user convenience. These tests offer relatively high accuracy and are compatible with telehealth-supported diagnostic workflows, making them a preferred choice among consumers seeking early prostate health assessment.
- Direct-to-Consumer Platforms segment is expected to witness the highest growth over the forecast period
Direct-to-consumer platforms are gaining strong traction by offering easy online ordering, home delivery, and digital result reporting. These platforms often integrate educational resources and teleconsultation services, enhancing user engagement and trust. Their ability to reach a broad consumer base without intermediaries is driving significant market growth.
- Individuals / Patients segment is expected to witness the highest growth over the forecast period
Individuals and patients form the largest end-user group, driven by increasing health awareness and preference for private and convenient testing options. At-home testing empowers users to proactively manage prostate health, particularly among aging male populations and those with limited access to traditional healthcare facilities.
- Immunoassay-Based Testing segment is expected to witness highest growth over the forecast period
Immunoassay-based testing is widely used due to its cost-effectiveness, reliability, and compatibility with PSA detection. These technologies enable accurate measurement of biomarkers and are well-suited for at-home diagnostic kits, supporting scalability and widespread adoption.
- North America segment is expected to witness highest growth over the forecast period
North America represents a key regional segment owing to high awareness of prostate cancer, advanced healthcare infrastructure, and strong adoption of at-home diagnostic solutions. Favorable regulatory frameworks and widespread use of telehealth services further support market growth in this region. Additionally, the region’s well-established insurance coverage and reimbursement policies for diagnostic tests have encouraged greater adoption of at-home prostate cancer testing. For instance, in August 2023, the U.S. Food and Drug Administration (FDA) had approved FoundationOneCDx as a companion diagnostic for Janssen's AKEEGA (abiraterone acetate Dual Action Tablet and niraparib). The approval targeted patients with BRCA-positive metastatic castration-resistant prostate cancer, enabling more precise, personalized treatment options based on genetic profiling.
Similarly, in September 2023, MDxHealth SA had partnered with the University of Oxford to investigate the correlation between its Genomic Prostate Score (GPS) test and prostate cancer progression following treatment for localized disease. The collaboration aimed to enhance understanding of disease outcomes and support personalized treatment strategies through genomic risk assessment. Thus, the rising investments in research and development, coupled with collaborations between diagnostic companies and healthcare providers, have accelerated the availability of innovative, convenient, and accurate testing solutions, further driving market expansion in North America.
| Report Matrics |
Details |
| Market Size Value |
USD 4.8 billion |
| Growth Rate |
CAGR of 14.3% |
| Forecast |
2026-2033 |
| Historical data |
2021-2024 |
| Base Year |
2025 |
| Report Coverage |
Forecasted revenue, company rating, competitive environment, growth drivers, and trends |
| Segment Coverage |
Type, Application, End-User, Geography |
| Regional Scope |
North America, Europe, Asia Pacific, Middle East |
| Customized scope |
Free customization of reports (With 3 months Analysis Support ) |
| To Learn More About This Report |
Request a Free Sample Copy |
At-Home Prostate Cancer Testing Market Competitive Landscape
The competitive landscape of the Global At-Home Prostate Cancer Testing Market is characterized by the presence of diagnostic kit manufacturers, biotech firms, and direct-to-consumer healthcare providers focusing on innovations in PSA and biomarker-based testing. Companies compete based on accuracy, ease of use, sample collection methods, integration with telehealth platforms, and regulatory compliance. Strategic collaborations, partnerships with healthcare providers, and investments in research and development for next-generation at-home diagnostic solutions are key strategies to gain market share. The market is witnessing rapid adoption due to growing awareness, technological advancements, and increasing consumer preference for convenient and private testing options.
Key Players:
- Exact Sciences Corporation
- Labcorp
- Quest Diagnostics
- Verisana
- LetsGetChecked
- Everlywell
- HealthLabs.com
- MyLab Box
- Fulgent Genetics
- BioIQ
- iCarbonX
- Natera, Inc.
- Thrive Earlier Detection
- CareDx, Inc.
- Pathway Genomics
- Genova Diagnostics
- Cleveland HeartLab
- Analyte Health
- Helix
- Pixel by Labcorp
Recent Development
- In December 2025, Cleveland Diagnostics, Inc., a commercial-stage precision oncology company, announced that the U.S. Food and Drug Administration (FDA) had approved its IsoPSA in vitro diagnostic (IVD) kit via the Premarket Approval (PMA) process. IsoPSA, a blood-based test, was indicated to assist in biopsy decision-making for men aged 50 and above with elevated PSA levels.
- In Janaury 2025, The United Arab Emirates Ministry of Health and Prevention (MOHAP) had approved the Fortel Prostate Specific Antigen (PSA) Screening Test for rapid, at-home detection of early prostate cancer indicators. Using a finger-prick blood sample, the test delivered results in about 10 minutes, enabling early diagnosis, supporting proactive health management, reducing healthcare system burdens, and improving patient outcomes.
Frequently Asked Questions (FAQ) :
Q1. What are the main growth-driving factors for this market?
The primary driver is the accelerating increase in the global aging male population, which is the demographic most susceptible to prostate cancer. This factor, combined with rising public health awareness and the demand for convenient, non-invasive early detection methods like at-home kits and liquid biopsy technologies, fuels market expansion.
Q2. What are the main restraining factors for this market?
The major constraints include the high overall cost of advanced diagnostic tests and subsequent treatment, which limits access in developing regions. Furthermore, the lack of standardization and regulatory hurdles for new, non-traditional testing technologies pose challenges to widespread adoption and market growth.
Q3. Which segment is expected to witness high growth?
The blood-based tests segment was expected to witness the highest growth over the forecast period due to their high accuracy, ease of sample collection, and growing clinical acceptance, along with increasing awareness of early prostate cancer screening and advancements in biomarker-based diagnostic technologies.
Q4. Who are the top major players for this market?
Major players in the broader prostate cancer diagnostics and related molecular testing markets include large pharmaceutical and diagnostics companies. Key players often cited are F. Hoffmann-La Roche Ltd., Thermo Fisher Scientific, Myriad Genetics, Inc., and MDxHealth, which focus on developing advanced diagnostic platforms.
Q5. Which country is the largest player?
North America, specifically the United States, holds the largest revenue share in the global prostate cancer diagnostics market. This dominance is due to its advanced healthcare infrastructure, high awareness and screening rates, and favorable regulatory environment that facilitates the fast adoption of innovative and advanced diagnostic technologies.
List of Figures
Figure 1: Global At-Home Prostate Cancer Testing Market Revenue Breakdown (USD Billion, %) by Region, 2022 & 2029
Figure 2: Global At-Home Prostate Cancer Testing Market Value Share (%), By Segment 1, 2022 & 2029
Figure 3: Global At-Home Prostate Cancer Testing Market Forecast (USD Billion), by Sub-Segment 1, 2018-2029
Figure 4: Global At-Home Prostate Cancer Testing Market Forecast (USD Billion), by Sub-Segment 2, 2018-2029
Figure 5: Global At-Home Prostate Cancer Testing Market Value Share (%), By Segment 2, 2022 & 2029
Figure 6: Global At-Home Prostate Cancer Testing Market Forecast (USD Billion), by Sub-Segment 1, 2018-2029
Figure 7: Global At-Home Prostate Cancer Testing Market Forecast (USD Billion), by Sub-Segment 2, 2018-2029
Figure 8: Global At-Home Prostate Cancer Testing Market Forecast (USD Billion), by Sub-Segment 3, 2018-2029
Figure 9: Global At-Home Prostate Cancer Testing Market Forecast (USD Billion), by Others, 2018-2029
Figure 10: Global At-Home Prostate Cancer Testing Market Value Share (%), By Segment 3, 2022 & 2029
Figure 11: Global At-Home Prostate Cancer Testing Market Forecast (USD Billion), by Sub-Segment 1, 2018-2029
Figure 12: Global At-Home Prostate Cancer Testing Market Forecast (USD Billion), by Sub-Segment 2, 2018-2029
Figure 13: Global At-Home Prostate Cancer Testing Market Forecast (USD Billion), by Sub-Segment 3, 2018-2029
Figure 14: Global At-Home Prostate Cancer Testing Market Forecast (USD Billion), by Others, 2018-2029
Figure 15: Global At-Home Prostate Cancer Testing Market Value (USD Billion), by Region, 2022 & 2029
Figure 16: North America At-Home Prostate Cancer Testing Market Value Share (%), By Segment 1, 2022 & 2029
Figure 17: North America At-Home Prostate Cancer Testing Market Forecast (USD Billion), by Sub-Segment 1, 2018-2029
Figure 18: North America At-Home Prostate Cancer Testing Market Forecast (USD Billion), by Sub-Segment 2, 2018-2029
Figure 19: North America At-Home Prostate Cancer Testing Market Value Share (%), By Segment 2, 2022 & 2029
Figure 20: North America At-Home Prostate Cancer Testing Market Forecast (USD Billion), by Sub-Segment 1, 2018-2029
Figure 21: North America At-Home Prostate Cancer Testing Market Forecast (USD Billion), by Sub-Segment 2, 2018-2029
Figure 22: North America At-Home Prostate Cancer Testing Market Forecast (USD Billion), by Sub-Segment 3, 2018-2029
Figure 23: North America At-Home Prostate Cancer Testing Market Forecast (USD Billion), by Others, 2018-2029
Figure 24: North America At-Home Prostate Cancer Testing Market Value Share (%), By Segment 3, 2022 & 2029
Figure 25: North America At-Home Prostate Cancer Testing Market Forecast (USD Billion), by Sub-Segment 1, 2018-2029
Figure 26: North America At-Home Prostate Cancer Testing Market Forecast (USD Billion), by Sub-Segment 2, 2018-2029
Figure 27: North America At-Home Prostate Cancer Testing Market Forecast (USD Billion), by Sub-Segment 3, 2018-2029
Figure 28: North America At-Home Prostate Cancer Testing Market Forecast (USD Billion), by Others, 2018-2029
Figure 29: North America At-Home Prostate Cancer Testing Market Forecast (USD Billion), by U.S., 2018-2029
Figure 30: North America At-Home Prostate Cancer Testing Market Forecast (USD Billion), by Canada, 2018-2029
Figure 31: Latin America At-Home Prostate Cancer Testing Market Value Share (%), By Segment 1, 2022 & 2029
Figure 32: Latin America At-Home Prostate Cancer Testing Market Forecast (USD Billion), by Sub-Segment 1, 2018-2029
Figure 33: Latin America At-Home Prostate Cancer Testing Market Forecast (USD Billion), by Sub-Segment 2, 2018-2029
Figure 34: Latin America At-Home Prostate Cancer Testing Market Value Share (%), By Segment 2, 2022 & 2029
Figure 35: Latin America At-Home Prostate Cancer Testing Market Forecast (USD Billion), by Sub-Segment 1, 2018-2029
Figure 36: Latin America At-Home Prostate Cancer Testing Market Forecast (USD Billion), by Sub-Segment 2, 2018-2029
Figure 37: Latin America At-Home Prostate Cancer Testing Market Forecast (USD Billion), by Sub-Segment 3, 2018-2029
Figure 38: Latin America At-Home Prostate Cancer Testing Market Forecast (USD Billion), by Others, 2018-2029
Figure 39: Latin America At-Home Prostate Cancer Testing Market Value Share (%), By Segment 3, 2022 & 2029
Figure 40: Latin America At-Home Prostate Cancer Testing Market Forecast (USD Billion), by Sub-Segment 1, 2018-2029
Figure 41: Latin America At-Home Prostate Cancer Testing Market Forecast (USD Billion), by Sub-Segment 2, 2018-2029
Figure 42: Latin America At-Home Prostate Cancer Testing Market Forecast (USD Billion), by Sub-Segment 3, 2018-2029
Figure 43: Latin America At-Home Prostate Cancer Testing Market Forecast (USD Billion), by Others, 2018-2029
Figure 44: Latin America At-Home Prostate Cancer Testing Market Forecast (USD Billion), by Brazil, 2018-2029
Figure 45: Latin America At-Home Prostate Cancer Testing Market Forecast (USD Billion), by Mexico, 2018-2029
Figure 46: Latin America At-Home Prostate Cancer Testing Market Forecast (USD Billion), by Rest of Latin America, 2018-2029
Figure 47: Europe At-Home Prostate Cancer Testing Market Value Share (%), By Segment 1, 2022 & 2029
Figure 48: Europe At-Home Prostate Cancer Testing Market Forecast (USD Billion), by Sub-Segment 1, 2018-2029
Figure 49: Europe At-Home Prostate Cancer Testing Market Forecast (USD Billion), by Sub-Segment 2, 2018-2029
Figure 50: Europe At-Home Prostate Cancer Testing Market Value Share (%), By Segment 2, 2022 & 2029
Figure 51: Europe At-Home Prostate Cancer Testing Market Forecast (USD Billion), by Sub-Segment 1, 2018-2029
Figure 52: Europe At-Home Prostate Cancer Testing Market Forecast (USD Billion), by Sub-Segment 2, 2018-2029
Figure 53: Europe At-Home Prostate Cancer Testing Market Forecast (USD Billion), by Sub-Segment 3, 2018-2029
Figure 54: Europe At-Home Prostate Cancer Testing Market Forecast (USD Billion), by Others, 2018-2029
Figure 55: Europe At-Home Prostate Cancer Testing Market Value Share (%), By Segment 3, 2022 & 2029
Figure 56: Europe At-Home Prostate Cancer Testing Market Forecast (USD Billion), by Sub-Segment 1, 2018-2029
Figure 57: Europe At-Home Prostate Cancer Testing Market Forecast (USD Billion), by Sub-Segment 2, 2018-2029
Figure 58: Europe At-Home Prostate Cancer Testing Market Forecast (USD Billion), by Sub-Segment 3, 2018-2029
Figure 59: Europe At-Home Prostate Cancer Testing Market Forecast (USD Billion), by Others, 2018-2029
Figure 60: Europe At-Home Prostate Cancer Testing Market Forecast (USD Billion), by U.K., 2018-2029
Figure 61: Europe At-Home Prostate Cancer Testing Market Forecast (USD Billion), by Germany, 2018-2029
Figure 62: Europe At-Home Prostate Cancer Testing Market Forecast (USD Billion), by France, 2018-2029
Figure 63: Europe At-Home Prostate Cancer Testing Market Forecast (USD Billion), by Italy, 2018-2029
Figure 64: Europe At-Home Prostate Cancer Testing Market Forecast (USD Billion), by Spain, 2018-2029
Figure 65: Europe At-Home Prostate Cancer Testing Market Forecast (USD Billion), by Russia, 2018-2029
Figure 66: Europe At-Home Prostate Cancer Testing Market Forecast (USD Billion), by Rest of Europe, 2018-2029
Figure 67: Asia Pacific At-Home Prostate Cancer Testing Market Value Share (%), By Segment 1, 2022 & 2029
Figure 68: Asia Pacific At-Home Prostate Cancer Testing Market Forecast (USD Billion), by Sub-Segment 1, 2018-2029
Figure 69: Asia Pacific At-Home Prostate Cancer Testing Market Forecast (USD Billion), by Sub-Segment 2, 2018-2029
Figure 70: Asia Pacific At-Home Prostate Cancer Testing Market Value Share (%), By Segment 2, 2022 & 2029
Figure 71: Asia Pacific At-Home Prostate Cancer Testing Market Forecast (USD Billion), by Sub-Segment 1, 2018-2029
Figure 72: Asia Pacific At-Home Prostate Cancer Testing Market Forecast (USD Billion), by Sub-Segment 2, 2018-2029
Figure 73: Asia Pacific At-Home Prostate Cancer Testing Market Forecast (USD Billion), by Sub-Segment 3, 2018-2029
Figure 74: Asia Pacific At-Home Prostate Cancer Testing Market Forecast (USD Billion), by Others, 2018-2029
Figure 75: Asia Pacific At-Home Prostate Cancer Testing Market Value Share (%), By Segment 3, 2022 & 2029
Figure 76: Asia Pacific At-Home Prostate Cancer Testing Market Forecast (USD Billion), by Sub-Segment 1, 2018-2029
Figure 77: Asia Pacific At-Home Prostate Cancer Testing Market Forecast (USD Billion), by Sub-Segment 2, 2018-2029
Figure 78: Asia Pacific At-Home Prostate Cancer Testing Market Forecast (USD Billion), by Sub-Segment 3, 2018-2029
Figure 79: Asia Pacific At-Home Prostate Cancer Testing Market Forecast (USD Billion), by Others, 2018-2029
Figure 80: Asia Pacific At-Home Prostate Cancer Testing Market Forecast (USD Billion), by China, 2018-2029
Figure 81: Asia Pacific At-Home Prostate Cancer Testing Market Forecast (USD Billion), by India, 2018-2029
Figure 82: Asia Pacific At-Home Prostate Cancer Testing Market Forecast (USD Billion), by Japan, 2018-2029
Figure 83: Asia Pacific At-Home Prostate Cancer Testing Market Forecast (USD Billion), by Australia, 2018-2029
Figure 84: Asia Pacific At-Home Prostate Cancer Testing Market Forecast (USD Billion), by Southeast Asia, 2018-2029
Figure 85: Asia Pacific At-Home Prostate Cancer Testing Market Forecast (USD Billion), by Rest of Asia Pacific, 2018-2029
Figure 86: Middle East & Africa At-Home Prostate Cancer Testing Market Value Share (%), By Segment 1, 2022 & 2029
Figure 87: Middle East & Africa At-Home Prostate Cancer Testing Market Forecast (USD Billion), by Sub-Segment 1, 2018-2029
Figure 88: Middle East & Africa At-Home Prostate Cancer Testing Market Forecast (USD Billion), by Sub-Segment 2, 2018-2029
Figure 89: Middle East & Africa At-Home Prostate Cancer Testing Market Value Share (%), By Segment 2, 2022 & 2029
Figure 90: Middle East & Africa At-Home Prostate Cancer Testing Market Forecast (USD Billion), by Sub-Segment 1, 2018-2029
Figure 91: Middle East & Africa At-Home Prostate Cancer Testing Market Forecast (USD Billion), by Sub-Segment 2, 2018-2029
Figure 92: Middle East & Africa At-Home Prostate Cancer Testing Market Forecast (USD Billion), by Sub-Segment 3, 2018-2029
Figure 93: Middle East & Africa At-Home Prostate Cancer Testing Market Forecast (USD Billion), by Others, 2018-2029
Figure 94: Middle East & Africa At-Home Prostate Cancer Testing Market Value Share (%), By Segment 3, 2022 & 2029
Figure 95: Middle East & Africa At-Home Prostate Cancer Testing Market Forecast (USD Billion), by Sub-Segment 1, 2018-2029
Figure 96: Middle East & Africa At-Home Prostate Cancer Testing Market Forecast (USD Billion), by Sub-Segment 2, 2018-2029
Figure 97: Middle East & Africa At-Home Prostate Cancer Testing Market Forecast (USD Billion), by Sub-Segment 3, 2018-2029
Figure 98: Middle East & Africa At-Home Prostate Cancer Testing Market Forecast (USD Billion), by Others, 2018-2029
Figure 99: Middle East & Africa At-Home Prostate Cancer Testing Market Forecast (USD Billion), by GCC, 2018-2029
Figure 100: Middle East & Africa At-Home Prostate Cancer Testing Market Forecast (USD Billion), by South Africa, 2018-2029
Figure 101: Middle East & Africa At-Home Prostate Cancer Testing Market Forecast (USD Billion), by Rest of Middle East & Africa, 2018-2029
List of Tables
Table 1: Global At-Home Prostate Cancer Testing Market Revenue (USD Billion) Forecast, by Segment 1, 2018-2029
Table 2: Global At-Home Prostate Cancer Testing Market Revenue (USD Billion) Forecast, by Segment 2, 2018-2029
Table 3: Global At-Home Prostate Cancer Testing Market Revenue (USD Billion) Forecast, by Segment 3, 2018-2029
Table 4: Global At-Home Prostate Cancer Testing Market Revenue (USD Billion) Forecast, by Region, 2018-2029
Table 5: North America At-Home Prostate Cancer Testing Market Revenue (USD Billion) Forecast, by Segment 1, 2018-2029
Table 6: North America At-Home Prostate Cancer Testing Market Revenue (USD Billion) Forecast, by Segment 2, 2018-2029
Table 7: North America At-Home Prostate Cancer Testing Market Revenue (USD Billion) Forecast, by Segment 3, 2018-2029
Table 8: North America At-Home Prostate Cancer Testing Market Revenue (USD Billion) Forecast, by Country, 2018-2029
Table 9: Europe At-Home Prostate Cancer Testing Market Revenue (USD Billion) Forecast, by Segment 1, 2018-2029
Table 10: Europe At-Home Prostate Cancer Testing Market Revenue (USD Billion) Forecast, by Segment 2, 2018-2029
Table 11: Europe At-Home Prostate Cancer Testing Market Revenue (USD Billion) Forecast, by Segment 3, 2018-2029
Table 12: Europe At-Home Prostate Cancer Testing Market Revenue (USD Billion) Forecast, by Country, 2018-2029
Table 13: Latin America At-Home Prostate Cancer Testing Market Revenue (USD Billion) Forecast, by Segment 1, 2018-2029
Table 14: Latin America At-Home Prostate Cancer Testing Market Revenue (USD Billion) Forecast, by Segment 2, 2018-2029
Table 15: Latin America At-Home Prostate Cancer Testing Market Revenue (USD Billion) Forecast, by Segment 3, 2018-2029
Table 16: Latin America At-Home Prostate Cancer Testing Market Revenue (USD Billion) Forecast, by Country, 2018-2029
Table 17: Asia Pacific At-Home Prostate Cancer Testing Market Revenue (USD Billion) Forecast, by Segment 1, 2018-2029
Table 18: Asia Pacific At-Home Prostate Cancer Testing Market Revenue (USD Billion) Forecast, by Segment 2, 2018-2029
Table 19: Asia Pacific At-Home Prostate Cancer Testing Market Revenue (USD Billion) Forecast, by Segment 3, 2018-2029
Table 20: Asia Pacific At-Home Prostate Cancer Testing Market Revenue (USD Billion) Forecast, by Country, 2018-2029
Table 21: Middle East & Africa At-Home Prostate Cancer Testing Market Revenue (USD Billion) Forecast, by Segment 1, 2018-2029
Table 22: Middle East & Africa At-Home Prostate Cancer Testing Market Revenue (USD Billion) Forecast, by Segment 2, 2018-2029
Table 23: Middle East & Africa At-Home Prostate Cancer Testing Market Revenue (USD Billion) Forecast, by Segment 3, 2018-2029
Table 24: Middle East & Africa At-Home Prostate Cancer Testing Market Revenue (USD Billion) Forecast, by Country, 2018-2029
Research Process
Data Library Research are conducted by industry experts who offer insight on
industry structure, market segmentations technology assessment and competitive landscape (CL), and penetration, as well as on emerging trends. Their analysis is based on primary interviews (~ 80%) and secondary research (~ 20%) as well as years of professional expertise in their respective industries. Adding to this, by analysing historical trends and current market positions, our analysts predict where the market will be headed for the next five years. Furthermore, the varying trends of segment & categories geographically presented are also studied and the estimated based on the primary & secondary research.
In this particular report from the supply side Data Library Research has conducted primary surveys (interviews) with the key level executives (VP, CEO’s, Marketing Director, Business Development Manager
and SOFT) of the companies that active & prominent as well as the midsized organization
FIGURE 1: DLR RESEARH PROCESS
![research-methodology1]()
Primary Research
Extensive primary research was conducted to gain a deeper insight of the market and industry performance. The analysis is based on both primary and secondary research as well as years of professional expertise in the respective industries.
In addition to analysing current and historical trends, our analysts predict where the market is headed over the next five years.
It varies by segment for these categories geographically presented in the list of market tables. Speaking about this particular report we have conducted primary surveys (interviews) with the key level executives (VP, CEO’s, Marketing Director, Business Development Manager and many more) of the major players active in the market.
Secondary Research
Secondary research was mainly used to collect and identify information useful for the extensive, technical, market-oriented, and Friend’s study of the Global Extra Neutral Alcohol. It was also used to obtain key information about major players, market classification and segmentation according to the industry trends, geographical markets, and developments related to the market and technology perspectives. For this study, analysts have gathered information from various credible sources, such as annual reports, sec filings, journals, white papers, SOFT presentations, and company web sites.
Market Size Estimation
Both, top-down and bottom-up approaches were used to estimate and validate the size of the Global market and to estimate the size of various other dependent submarkets in the overall Extra Neutral Alcohol. The key players in the market were identified through secondary research and their market contributions in the respective geographies were determined through primary and secondary research.
Forecast Model
![research-methodology2]()