Standard Modular Hydropower Market Overview and Analysis

The Global Standard Modular Hydropower Market is projected to reach USD 317.6 billion by 2035, from USD 58.1 billion in 2026, growing with a CAGR of 12.34% from 2026-2034.

Standard Modular Hydropower Market

Get Complete Analysis Of The Report - Download Updated Free Sample PDF

The Global Standard Modular Hydropower Market refers to the worldwide industry for renewable energy systems that use pre designed, scalable hydropower modules to generate electricity with minimal site specific construction. These modular systems are manufactured off site and assembled quickly at project locations, offering cost effective, flexible, and environmentally friendly alternatives to traditional hydropower plants. The market includes a range of capacities and installation types for applications such as on grid and decentralized power generation.

Standard Modular Hydropower Market Latest Trends

The Global Standard Modular Hydropower Market is expanding as nations accelerate the shift toward renewable energy and decarbonization, with modular systems gaining appeal for their rapid deployment and lower capital intensity compared with conventional hydropower projects. Technological advancements—such as improved turbine designs, standardized components, and digital monitoring—enhance efficiency and flexibility, enabling applications from off-grid rural electrification to utility integration. Additionally, supportive government policies and rising investment in sustainable infrastructure catalyze adoption, while small-scale and decentralized hydropower solutions attract interest as part of broader energy diversification strategies.

Segmentation: The Global Standard Modular Hydropower Market is segmented by Application (Electricity Generation, Water Supply Management, Irrigation, Flood Control and Industrial/Commercial Power), Installation Type (On-Grid Systems, Off-Grid Systems and Pumped Storage), Turbine Type (Kaplan Turbine, Francis Turbine and Pelton Wheel), Capacity / Size (Small-Scale (e.g., 10–100 kW / up to ~1 MW), Medium-Scale (e.g., 100–500 kW / 1–10 MW) and Large-Scale (Above 500 kW / >10 MW)), and Geography (North America, Europe, Asia-Pacific, Middle East and Africa, and South America). The report provides the value (in USD million) for the above segments.

Standard Modular Hydropower Market segment

For Detailed Market Segmentation - Get a Free Sample PDF

Market Drivers:

  • Growing Demand for Renewable and Decentralized Energy

The increasing global focus on renewable energy and carbon reduction is a major driver for the standard modular hydropower market. Governments and utilities are prioritizing clean, reliable power sources to meet climate targets and reduce dependence on fossil fuels. Modular hydropower systems offer a sustainable solution by enabling electricity generation with minimal environmental disruption and faster deployment compared to conventional hydropower plants. Their suitability for decentralized and off-grid applications makes them particularly attractive for rural electrification and remote industrial operations, driving adoption across both developed and developing economies.

  • Technological Advancements and Cost Efficiency

Advancements in turbine efficiency, standardized components, and digital monitoring technologies are significantly driving market growth. Standard modular hydropower systems reduce project complexity, construction time, and upfront capital costs, making hydropower more economically viable for small and medium-scale projects. Innovations such as prefabricated units, plug-and-play designs, and remote performance monitoring improve reliability and operational efficiency.

In 2023, The IAEA launched the GloWAL Network to strengthen water data generation, policy formulation, and technical capacity building among member states. This initiative enhanced technological advancements and cost efficiency in water infrastructure planning, indirectly supporting the Global Standard Modular Hydropower Market by enabling data-driven system design, optimized resource utilization, and more economically viable modular hydropower deployments. These improvements allow developers to scale projects easily while lowering maintenance costs. As a result, modular hydropower is increasingly viewed as a cost-effective alternative to traditional hydropower installations.

Market Restraints:

  • High Initial Investment and Regulatory Challenges

Despite long-term cost benefits, high initial capital investment remains a key restraint for the global standard modular hydropower market. Project development often requires significant spending on site assessment, civil works, and grid integration, which can deter small developers and local communities. Additionally, complex regulatory frameworks, lengthy permitting processes, and environmental clearance requirements can delay project timelines and increase costs. In some regions, inconsistent policy support and limited financing options further restrict adoption. These challenges can slow market penetration, particularly in emerging economies with constrained infrastructure development budgets.

Socioeconomic Impact on Standard Modular Hydropower Market

Modular hydropower deployment contributes positively to socioeconomic development by broadening energy access and supporting energy security, particularly in remote and underserved regions where traditional grid extension is costly. Renewable hydropower systems reduce greenhouse gas emissions and reliance on fossil fuels, aligning with global climate goals and enhancing public health through lower pollution. Projects often stimulate local job creation in construction, maintenance, and operations, fostering skills development in emerging markets. Moreover, reliable and affordable electricity strengthens economic productivity across agriculture, industry, and services, enabling rural communities to participate more fully in economic growth.

Segmental Analysis:

  • Water Supply Management segment is expected to witness highest growth over the forecast period

The water supply management segment is expected to witness the highest growth over the forecast period due to rising global concerns over water scarcity, aging infrastructure, and the need for energy-efficient water distribution systems. Standard modular hydropower solutions are increasingly integrated into canals, pipelines, and water treatment facilities to recover energy from existing water flows without major civil construction. This dual benefit of improving water management efficiency while generating clean electricity makes modular hydropower highly attractive for utilities and municipalities. Government initiatives promoting sustainable water infrastructure and smart water management further accelerate adoption across both developed and emerging economies.

  • On-Grid Systems segment is expected to witness highest growth over the forecast period

The on-grid systems segment is projected to experience the highest growth over the forecast period, driven by increasing grid modernization and renewable energy integration efforts worldwide. Standard modular hydropower systems offer utilities a scalable and predictable power source that can be rapidly connected to existing grid infrastructure. Their ability to provide stable baseload power and support grid reliability complements intermittent renewable sources such as wind and solar. Favorable regulatory frameworks, feed-in tariffs, and utility-led investments in clean energy infrastructure are further accelerating the deployment of on-grid modular hydropower solutions.

  • Pelton Wheel segment is expected to witness highest growth over the forecast period

The Pelton wheel segment is expected to witness the highest growth during the forecast period, supported by rising demand for high-head, low-flow hydropower applications. Pelton turbines are particularly suited for mountainous and hilly regions where elevation differences are significant, making them ideal for modular and small-scale installations. Technological advancements have improved turbine efficiency, durability, and ease of integration into standardized modular systems. Growing renewable energy investments in regions with suitable topography, coupled with the need for flexible and decentralized power generation, are driving increased adoption of Pelton wheel-based modular hydropower systems.

  • Medium-Scale (e.g., 100–500 kW / 1–10 MW) segment is expected to witness highest growth over the forecast period

The medium-scale capacity segment is anticipated to register the highest growth over the forecast period due to its balance between economic viability and power output. These systems are well suited for supplying electricity to small towns, industrial facilities, and municipal infrastructure, including water and wastewater treatment plants. Standard modular hydropower in this range offers lower installation risk, shorter development timelines, and attractive returns on investment compared to large conventional projects. Increasing demand for reliable, grid-connected renewable energy solutions is further supporting growth in this capacity segment.

  • North America Region is expected to witness highest growth over the forecast period

North America is expected to witness the highest growth over the forecast period, driven by strong policy support for renewable energy, infrastructure modernization, and decarbonization initiatives. The region benefits from an extensive network of existing water infrastructure, such as dams, canals, and pipelines, which can be retrofitted with modular hydropower systems. For instance, in June 2025, The settlement between Southern California’s major water agencies marked improved regional cooperation and long-term planning certainty. This resolution enhanced coordinated water management, reduced regulatory and financial uncertainties, and improved infrastructure planning. As a result, it supported favorable conditions for the North America Standard Modular Hydropower Market by encouraging integrated water–energy projects, efficient resource utilization, and increased confidence in investing in modular hydropower systems.

Increasing investments by utilities and public agencies, coupled with favorable regulatory frameworks and technological innovation, are accelerating market expansion. Additionally, growing emphasis on energy recovery from water systems and grid resilience continues to boost adoption across the region.

Standard Modular Hydropower Market table

To Learn More About This Report - Request a Free Sample Copy
 

Standard Modular Hydropower Market Competitive Landscape

The competitive landscape in modular hydropower is dynamic, featuring a mix of established multinationals and innovative technology providers. Major energy and engineering firms invest heavily in modular solutions to capture growing demand, differentiate products, and expand geographic reach. Competition centers not only on price but also on technological performance, service offerings, and turnkey project capabilities. Strategic partnerships, mergers, and R&D collaborations are common as firms seek to enhance efficiency, integrate digital control systems, and deliver comprehensive lifecycle support. As market interest intensifies, both incumbents and new entrants vie to lead in scalable, cost-effective renewable hydropower solutions.

The major players are:

  • Andritz Hydro GmbH
  • GE Renewable Energy
  • Voith Group
  • Siemens Energy
  • Toshiba Energy Systems & Solutions Corporation
  • Mavel, a.s.
  • Bharat Heavy Electricals Limited (BHEL)
  • Gilbert Gilkes & Gordon Ltd (Gilkes)
  • Ossberger GmbH
  • Canyon Hydro
  • Canadian Hydro Components Ltd.
  • Litostroj Power Group
  • Rainpower AS
  • Zeco Hydropower
  • Kirloskar Brothers Limited
  • ATB Riva Calzoni S.p.A.
  • Hydro-Québec
  • Smart Hydro Power
  • Emrgy Inc.
  • PowerSpout

Recent Development

  • In September 2025, The Ministry of India reported that multiple states shared best practices on technologies for efficient water management, alongside grassroots participation from gram panchayats and water user associations across diverse regions. This inclusive knowledge exchange strengthened awareness and adoption of sustainable water infrastructure, positively influencing the Global Standard Modular Hydropower Market by supporting decentralized deployment, improved resource efficiency, and greater acceptance of modular hydropower solutions.


Frequently Asked Questions (FAQ) :

Q1. What are the main growth-driving factors for this market?

The market is driven by the global transition toward renewable energy to meet decarbonization targets. Standard modular hydropower offers reduced site-specific engineering costs and faster deployment compared to traditional dams. Additionally, the ability to maintain river connectivity and minimize ecological disruption makes it an attractive solution for environmentally conscious energy projects.

Q2. What are the main restraining factors for this market?

High initial capital intensity and complex regulatory frameworks for water usage remain significant barriers. Many regions lack clear permitting processes for modular designs, leading to project delays. Furthermore, technical challenges regarding sediment management and the need for specific site conditions can limit the widespread scalability of modular units in certain terrains.

Q3. Which segment is expected to witness high growth?

On-grid modular hydropower systems provide essential stability to national electricity networks by delivering a consistent, baseload power supply. These systems utilize existing grid infrastructure to sell surplus energy, improving project ROI. Their ability to balance intermittent renewables like wind and solar makes them vital for modernizing and decarbonizing utility-scale grids.

Q4. Who are the top major players for this market?

Key industry leaders include Voith Hydro, Andritz Hydro, and General Electric (Renewable Energy). These companies are joined by innovative specialized firms like Natel Energy and Turbulent, which focus specifically on fish-friendly, modular turbine designs. These players dominate through advanced material science and standardized manufacturing processes that lower overall project risks.

Q5. Which country is the largest player?

The United States is currently the largest player in the development and research of standard modular hydropower. Driven by Department of Energy initiatives and a vast network of non-powered dams, the U.S. leads in SMH innovation. China and Norway also hold significant shares due to their extensive existing hydropower infrastructure.

Standard Modular Hydropower MARKET STUDY GLOBAL MARKET ANALYSIS, INSIGHTS AND FORECAST, 2022-2029

    1. Introduction

    • 1.1. Research Scope
    • 1.2. Market Segmentation
    • 1.3. Research Methodology
    • 1.4. Definitions and Assumptions

    2. Executive Summary

      3. Market Dynamics

      • 3.1. Market Drivers
      • 3.2. Market Restraints
      • 3.3. Market Opportunities

      4. Key Insights

      • 4.1. Key Emerging Trends – For Major Countries
      • 4.2. Latest Technological Advancement
      • 4.3. Regulatory Landscape
      • 4.4. Industry SWOT Analysis
      • 4.5. Porters Five Forces Analysis

      5. Global Standard Modular Hydropower Market Analysis (USD Billion), Insights and Forecast, 2018-2029

      • 5.1. Key Findings / Summary
      • 5.2. Market Analysis, Insights and Forecast – By Segment 1
        • 5.2.1. Sub-Segment 1
        • 5.2.2. Sub-Segment 2
      • 5.3. Market Analysis, Insights and Forecast – By Segment 2
        • 5.3.1. Sub-Segment 1
        • 5.3.2. Sub-Segment 2
        • 5.3.3. Sub-Segment 3
        • 5.3.4. Others
      • 5.4. Market Analysis, Insights and Forecast – By Segment 3
        • 5.4.1. Sub-Segment 1
        • 5.4.2. Sub-Segment 2
        • 5.4.3. Sub-Segment 3
        • 5.4.4. Others
      • 5.5. Market Analysis, Insights and Forecast – By Region
        • 5.5.1. North America
        • 5.5.2. Latin America
        • 5.5.3. Europe
        • 5.5.4. Asia Pacific
        • 5.5.5. Middle East and Africa

      6. North America Standard Modular Hydropower Market Analysis (USD Billion), Insights and Forecast, 2018-2029

      • 6.1. Key Findings / Summary
      • 6.2. Market Analysis, Insights and Forecast – By Segment 1
        • 6.2.1. Sub-Segment 1
        • 6.2.2. Sub-Segment 2
      • 6.3. Market Analysis, Insights and Forecast – By Segment 2
        • 6.3.1. Sub-Segment 1
        • 6.3.2. Sub-Segment 2
        • 6.3.3. Sub-Segment 3
        • 6.3.4. Others
      • 6.4. Market Analysis, Insights and Forecast – By Segment 3
        • 6.4.1. Sub-Segment 1
        • 6.4.2. Sub-Segment 2
        • 6.4.3. Sub-Segment 3
        • 6.4.4. Others
      • 6.5. Market Analysis, Insights and Forecast – By Country
        • 6.5.1. U.S.
        • 6.5.2. Canada

      7. Latin America Standard Modular Hydropower Market Analysis (USD Billion), Insights and Forecast, 2018-2029

      • 7.1. Key Findings / Summary
      • 7.2. Market Analysis, Insights and Forecast – By Segment 1
        • 7.2.1. Sub-Segment 1
        • 7.2.2. Sub-Segment 2
      • 7.3. Market Analysis, Insights and Forecast – By Segment 2
        • 7.3.1. Sub-Segment 1
        • 7.3.2. Sub-Segment 2
        • 7.3.3. Sub-Segment 3
        • 7.3.4. Others
      • 7.4. Market Analysis, Insights and Forecast – By Segment 3
        • 7.4.1. Sub-Segment 1
        • 7.4.2. Sub-Segment 2
        • 7.4.3. Sub-Segment 3
        • 7.4.4. Others
      • 7.5. Insights and Forecast – By Country
        • 7.5.1. Brazil
        • 7.5.2. Mexico
        • 7.5.3. Rest of Latin America

      8. Europe Standard Modular Hydropower Market Analysis (USD Billion), Insights and Forecast, 2018-2029

      • 8.1. Key Findings / Summary
      • 8.2. Market Analysis, Insights and Forecast – By Segment 1
        • 8.2.1. Sub-Segment 1
        • 8.2.2. Sub-Segment 2
      • 8.3. Market Analysis, Insights and Forecast – By Segment 2
        • 8.3.1. Sub-Segment 1
        • 8.3.2. Sub-Segment 2
        • 8.3.3. Sub-Segment 3
        • 8.3.4. Others
      • 8.4. Market Analysis, Insights and Forecast – By Segment 3
        • 8.4.1. Sub-Segment 1
        • 8.4.2. Sub-Segment 2
        • 8.4.3. Sub-Segment 3
        • 8.4.4. Others
      • 8.5. Market Analysis, Insights and Forecast – By Country
        • 8.5.1. UK
        • 8.5.2. Germany
        • 8.5.3. France
        • 8.5.4. Italy
        • 8.5.5. Spain
        • 8.5.6. Russia
        • 8.5.7. Rest of Europe

      9. Asia Pacific Standard Modular Hydropower Market Analysis (USD Billion), Insights and Forecast, 2018-2029

      • 9.1. Key Findings / Summary
      • 9.2. Market Analysis, Insights and Forecast – By Segment 1
        • 9.2.1. Sub-Segment 1
        • 9.2.2. Sub-Segment 2
      • 9.3. Market Analysis, Insights and Forecast – By Segment 2
        • 9.3.1. Sub-Segment 1
        • 9.3.2. Sub-Segment 2
        • 9.3.3. Sub-Segment 3
        • 9.3.4. Others
      • 9.4. Market Analysis, Insights and Forecast – By Segment 3
        • 9.4.1. Sub-Segment 1
        • 9.4.2. Sub-Segment 2
        • 9.4.3. Sub-Segment 3
        • 9.4.4. Others
      • 9.5. Market Analysis, Insights and Forecast – By Country
        • 9.5.1. China
        • 9.5.2. India
        • 9.5.3. Japan
        • 9.5.4. Australia
        • 9.5.5. South East Asia
        • 9.5.6. Rest of Asia Pacific

      10. Middle East & Africa Standard Modular Hydropower Market Analysis (USD Billion), Insights and Forecast, 2018-2029

      • 10.1. Key Findings / Summary
      • 10.2. Market Analysis, Insights and Forecast – By Segment 1
        • 10.2.1. Sub-Segment 1
        • 10.2.2. Sub-Segment 2
      • 10.3. Market Analysis, Insights and Forecast – By Segment 2
        • 10.3.1. Sub-Segment 1
        • 10.3.2. Sub-Segment 2
        • 10.3.3. Sub-Segment 3
        • 10.3.4. Others
      • 10.4. Market Analysis, Insights and Forecast – By Segment 3
        • 10.4.1. Sub-Segment 1
        • 10.4.2. Sub-Segment 2
        • 10.4.3. Sub-Segment 3
        • 10.4.4. Others
      • 10.5. Market Analysis, Insights and Forecast – By Country
        • 10.5.1. GCC
        • 10.5.2. South Africa
        • 10.5.3. Rest of Middle East & Africa

      11. Competitive Analysis

      • 11.1. Company Market Share Analysis, 2018
      • 11.2. Key Industry Developments
      • 11.3. Company Profile
        • 11.3.1. Company 1
          • 11.3.1.1. Business Overview
          • 11.3.1.2. Segment 1 & Service Offering
          • 11.3.1.3. Overall Revenue
          • 11.3.1.4. Geographic Presence
          • 11.3.1.5. Recent Development
        *Similar details will be provided for the following companies
        • 11.3.2. Company 2
        • 11.3.3. Company 3
        • 11.3.4. Company 4
        • 11.3.5. Company 5
        • 11.3.6. Company 6
        • 11.3.7. Company 7
        • 11.3.8. Company 8
        • 11.3.9. Company 9
        • 11.3.10. Company 10
        • 11.3.11. Company 11
        • 11.3.12. Company 12
      List of Figures

      Figure 1: Global Standard Modular Hydropower Market Revenue Breakdown (USD Billion, %) by Region, 2022 & 2029
      Figure 2: Global Standard Modular Hydropower Market Value Share (%), By Segment 1, 2022 & 2029
      Figure 3: Global Standard Modular Hydropower Market Forecast (USD Billion), by Sub-Segment 1, 2018-2029
      Figure 4: Global Standard Modular Hydropower Market Forecast (USD Billion), by Sub-Segment 2, 2018-2029
      Figure 5: Global Standard Modular Hydropower Market Value Share (%), By Segment 2, 2022 & 2029
      Figure 6: Global Standard Modular Hydropower Market Forecast (USD Billion), by Sub-Segment 1, 2018-2029
      Figure 7: Global Standard Modular Hydropower Market Forecast (USD Billion), by Sub-Segment 2, 2018-2029
      Figure 8: Global Standard Modular Hydropower Market Forecast (USD Billion), by Sub-Segment 3, 2018-2029
      Figure 9: Global Standard Modular Hydropower Market Forecast (USD Billion), by Others, 2018-2029
      Figure 10: Global Standard Modular Hydropower Market Value Share (%), By Segment 3, 2022 & 2029
      Figure 11: Global Standard Modular Hydropower Market Forecast (USD Billion), by Sub-Segment 1, 2018-2029
      Figure 12: Global Standard Modular Hydropower Market Forecast (USD Billion), by Sub-Segment 2, 2018-2029
      Figure 13: Global Standard Modular Hydropower Market Forecast (USD Billion), by Sub-Segment 3, 2018-2029
      Figure 14: Global Standard Modular Hydropower Market Forecast (USD Billion), by Others, 2018-2029
      Figure 15: Global Standard Modular Hydropower Market Value (USD Billion), by Region, 2022 & 2029
      Figure 16: North America Standard Modular Hydropower Market Value Share (%), By Segment 1, 2022 & 2029
      Figure 17: North America Standard Modular Hydropower Market Forecast (USD Billion), by Sub-Segment 1, 2018-2029
      Figure 18: North America Standard Modular Hydropower Market Forecast (USD Billion), by Sub-Segment 2, 2018-2029
      Figure 19: North America Standard Modular Hydropower Market Value Share (%), By Segment 2, 2022 & 2029
      Figure 20: North America Standard Modular Hydropower Market Forecast (USD Billion), by Sub-Segment 1, 2018-2029
      Figure 21: North America Standard Modular Hydropower Market Forecast (USD Billion), by Sub-Segment 2, 2018-2029
      Figure 22: North America Standard Modular Hydropower Market Forecast (USD Billion), by Sub-Segment 3, 2018-2029
      Figure 23: North America Standard Modular Hydropower Market Forecast (USD Billion), by Others, 2018-2029
      Figure 24: North America Standard Modular Hydropower Market Value Share (%), By Segment 3, 2022 & 2029
      Figure 25: North America Standard Modular Hydropower Market Forecast (USD Billion), by Sub-Segment 1, 2018-2029
      Figure 26: North America Standard Modular Hydropower Market Forecast (USD Billion), by Sub-Segment 2, 2018-2029
      Figure 27: North America Standard Modular Hydropower Market Forecast (USD Billion), by Sub-Segment 3, 2018-2029
      Figure 28: North America Standard Modular Hydropower Market Forecast (USD Billion), by Others, 2018-2029
      Figure 29: North America Standard Modular Hydropower Market Forecast (USD Billion), by U.S., 2018-2029
      Figure 30: North America Standard Modular Hydropower Market Forecast (USD Billion), by Canada, 2018-2029
      Figure 31: Latin America Standard Modular Hydropower Market Value Share (%), By Segment 1, 2022 & 2029
      Figure 32: Latin America Standard Modular Hydropower Market Forecast (USD Billion), by Sub-Segment 1, 2018-2029
      Figure 33: Latin America Standard Modular Hydropower Market Forecast (USD Billion), by Sub-Segment 2, 2018-2029
      Figure 34: Latin America Standard Modular Hydropower Market Value Share (%), By Segment 2, 2022 & 2029
      Figure 35: Latin America Standard Modular Hydropower Market Forecast (USD Billion), by Sub-Segment 1, 2018-2029
      Figure 36: Latin America Standard Modular Hydropower Market Forecast (USD Billion), by Sub-Segment 2, 2018-2029
      Figure 37: Latin America Standard Modular Hydropower Market Forecast (USD Billion), by Sub-Segment 3, 2018-2029
      Figure 38: Latin America Standard Modular Hydropower Market Forecast (USD Billion), by Others, 2018-2029
      Figure 39: Latin America Standard Modular Hydropower Market Value Share (%), By Segment 3, 2022 & 2029
      Figure 40: Latin America Standard Modular Hydropower Market Forecast (USD Billion), by Sub-Segment 1, 2018-2029
      Figure 41: Latin America Standard Modular Hydropower Market Forecast (USD Billion), by Sub-Segment 2, 2018-2029
      Figure 42: Latin America Standard Modular Hydropower Market Forecast (USD Billion), by Sub-Segment 3, 2018-2029
      Figure 43: Latin America Standard Modular Hydropower Market Forecast (USD Billion), by Others, 2018-2029
      Figure 44: Latin America Standard Modular Hydropower Market Forecast (USD Billion), by Brazil, 2018-2029
      Figure 45: Latin America Standard Modular Hydropower Market Forecast (USD Billion), by Mexico, 2018-2029
      Figure 46: Latin America Standard Modular Hydropower Market Forecast (USD Billion), by Rest of Latin America, 2018-2029
      Figure 47: Europe Standard Modular Hydropower Market Value Share (%), By Segment 1, 2022 & 2029
      Figure 48: Europe Standard Modular Hydropower Market Forecast (USD Billion), by Sub-Segment 1, 2018-2029
      Figure 49: Europe Standard Modular Hydropower Market Forecast (USD Billion), by Sub-Segment 2, 2018-2029
      Figure 50: Europe Standard Modular Hydropower Market Value Share (%), By Segment 2, 2022 & 2029
      Figure 51: Europe Standard Modular Hydropower Market Forecast (USD Billion), by Sub-Segment 1, 2018-2029
      Figure 52: Europe Standard Modular Hydropower Market Forecast (USD Billion), by Sub-Segment 2, 2018-2029
      Figure 53: Europe Standard Modular Hydropower Market Forecast (USD Billion), by Sub-Segment 3, 2018-2029
      Figure 54: Europe Standard Modular Hydropower Market Forecast (USD Billion), by Others, 2018-2029
      Figure 55: Europe Standard Modular Hydropower Market Value Share (%), By Segment 3, 2022 & 2029
      Figure 56: Europe Standard Modular Hydropower Market Forecast (USD Billion), by Sub-Segment 1, 2018-2029
      Figure 57: Europe Standard Modular Hydropower Market Forecast (USD Billion), by Sub-Segment 2, 2018-2029
      Figure 58: Europe Standard Modular Hydropower Market Forecast (USD Billion), by Sub-Segment 3, 2018-2029
      Figure 59: Europe Standard Modular Hydropower Market Forecast (USD Billion), by Others, 2018-2029
      Figure 60: Europe Standard Modular Hydropower Market Forecast (USD Billion), by U.K., 2018-2029
      Figure 61: Europe Standard Modular Hydropower Market Forecast (USD Billion), by Germany, 2018-2029
      Figure 62: Europe Standard Modular Hydropower Market Forecast (USD Billion), by France, 2018-2029
      Figure 63: Europe Standard Modular Hydropower Market Forecast (USD Billion), by Italy, 2018-2029
      Figure 64: Europe Standard Modular Hydropower Market Forecast (USD Billion), by Spain, 2018-2029
      Figure 65: Europe Standard Modular Hydropower Market Forecast (USD Billion), by Russia, 2018-2029
      Figure 66: Europe Standard Modular Hydropower Market Forecast (USD Billion), by Rest of Europe, 2018-2029
      Figure 67: Asia Pacific Standard Modular Hydropower Market Value Share (%), By Segment 1, 2022 & 2029
      Figure 68: Asia Pacific Standard Modular Hydropower Market Forecast (USD Billion), by Sub-Segment 1, 2018-2029
      Figure 69: Asia Pacific Standard Modular Hydropower Market Forecast (USD Billion), by Sub-Segment 2, 2018-2029
      Figure 70: Asia Pacific Standard Modular Hydropower Market Value Share (%), By Segment 2, 2022 & 2029
      Figure 71: Asia Pacific Standard Modular Hydropower Market Forecast (USD Billion), by Sub-Segment 1, 2018-2029
      Figure 72: Asia Pacific Standard Modular Hydropower Market Forecast (USD Billion), by Sub-Segment 2, 2018-2029
      Figure 73: Asia Pacific Standard Modular Hydropower Market Forecast (USD Billion), by Sub-Segment 3, 2018-2029
      Figure 74: Asia Pacific Standard Modular Hydropower Market Forecast (USD Billion), by Others, 2018-2029
      Figure 75: Asia Pacific Standard Modular Hydropower Market Value Share (%), By Segment 3, 2022 & 2029
      Figure 76: Asia Pacific Standard Modular Hydropower Market Forecast (USD Billion), by Sub-Segment 1, 2018-2029
      Figure 77: Asia Pacific Standard Modular Hydropower Market Forecast (USD Billion), by Sub-Segment 2, 2018-2029
      Figure 78: Asia Pacific Standard Modular Hydropower Market Forecast (USD Billion), by Sub-Segment 3, 2018-2029
      Figure 79: Asia Pacific Standard Modular Hydropower Market Forecast (USD Billion), by Others, 2018-2029
      Figure 80: Asia Pacific Standard Modular Hydropower Market Forecast (USD Billion), by China, 2018-2029
      Figure 81: Asia Pacific Standard Modular Hydropower Market Forecast (USD Billion), by India, 2018-2029
      Figure 82: Asia Pacific Standard Modular Hydropower Market Forecast (USD Billion), by Japan, 2018-2029
      Figure 83: Asia Pacific Standard Modular Hydropower Market Forecast (USD Billion), by Australia, 2018-2029
      Figure 84: Asia Pacific Standard Modular Hydropower Market Forecast (USD Billion), by Southeast Asia, 2018-2029
      Figure 85: Asia Pacific Standard Modular Hydropower Market Forecast (USD Billion), by Rest of Asia Pacific, 2018-2029
      Figure 86: Middle East & Africa Standard Modular Hydropower Market Value Share (%), By Segment 1, 2022 & 2029
      Figure 87: Middle East & Africa Standard Modular Hydropower Market Forecast (USD Billion), by Sub-Segment 1, 2018-2029
      Figure 88: Middle East & Africa Standard Modular Hydropower Market Forecast (USD Billion), by Sub-Segment 2, 2018-2029
      Figure 89: Middle East & Africa Standard Modular Hydropower Market Value Share (%), By Segment 2, 2022 & 2029
      Figure 90: Middle East & Africa Standard Modular Hydropower Market Forecast (USD Billion), by Sub-Segment 1, 2018-2029
      Figure 91: Middle East & Africa Standard Modular Hydropower Market Forecast (USD Billion), by Sub-Segment 2, 2018-2029
      Figure 92: Middle East & Africa Standard Modular Hydropower Market Forecast (USD Billion), by Sub-Segment 3, 2018-2029
      Figure 93: Middle East & Africa Standard Modular Hydropower Market Forecast (USD Billion), by Others, 2018-2029
      Figure 94: Middle East & Africa Standard Modular Hydropower Market Value Share (%), By Segment 3, 2022 & 2029
      Figure 95: Middle East & Africa Standard Modular Hydropower Market Forecast (USD Billion), by Sub-Segment 1, 2018-2029
      Figure 96: Middle East & Africa Standard Modular Hydropower Market Forecast (USD Billion), by Sub-Segment 2, 2018-2029
      Figure 97: Middle East & Africa Standard Modular Hydropower Market Forecast (USD Billion), by Sub-Segment 3, 2018-2029
      Figure 98: Middle East & Africa Standard Modular Hydropower Market Forecast (USD Billion), by Others, 2018-2029
      Figure 99: Middle East & Africa Standard Modular Hydropower Market Forecast (USD Billion), by GCC, 2018-2029
      Figure 100: Middle East & Africa Standard Modular Hydropower Market Forecast (USD Billion), by South Africa, 2018-2029
      Figure 101: Middle East & Africa Standard Modular Hydropower Market Forecast (USD Billion), by Rest of Middle East & Africa, 2018-2029 
      List of Tables
      Table 1: Global Standard Modular Hydropower Market Revenue (USD Billion) Forecast, by Segment 1, 2018-2029
      Table 2: Global Standard Modular Hydropower Market Revenue (USD Billion) Forecast, by Segment 2, 2018-2029
      Table 3: Global Standard Modular Hydropower Market Revenue (USD Billion) Forecast, by Segment 3, 2018-2029
      Table 4: Global Standard Modular Hydropower Market Revenue (USD Billion) Forecast, by Region, 2018-2029
      Table 5: North America Standard Modular Hydropower Market Revenue (USD Billion) Forecast, by Segment 1, 2018-2029
      Table 6: North America Standard Modular Hydropower Market Revenue (USD Billion) Forecast, by Segment 2, 2018-2029
      Table 7: North America Standard Modular Hydropower Market Revenue (USD Billion) Forecast, by Segment 3, 2018-2029
      Table 8: North America Standard Modular Hydropower Market Revenue (USD Billion) Forecast, by Country, 2018-2029
      Table 9: Europe Standard Modular Hydropower Market Revenue (USD Billion) Forecast, by Segment 1, 2018-2029
      Table 10: Europe Standard Modular Hydropower Market Revenue (USD Billion) Forecast, by Segment 2, 2018-2029
      Table 11: Europe Standard Modular Hydropower Market Revenue (USD Billion) Forecast, by Segment 3, 2018-2029
      Table 12: Europe Standard Modular Hydropower Market Revenue (USD Billion) Forecast, by Country, 2018-2029
      Table 13: Latin America Standard Modular Hydropower Market Revenue (USD Billion) Forecast, by Segment 1, 2018-2029
      Table 14: Latin America Standard Modular Hydropower Market Revenue (USD Billion) Forecast, by Segment 2, 2018-2029
      Table 15: Latin America Standard Modular Hydropower Market Revenue (USD Billion) Forecast, by Segment 3, 2018-2029
      Table 16: Latin America Standard Modular Hydropower Market Revenue (USD Billion) Forecast, by Country, 2018-2029
      Table 17: Asia Pacific Standard Modular Hydropower Market Revenue (USD Billion) Forecast, by Segment 1, 2018-2029
      Table 18: Asia Pacific Standard Modular Hydropower Market Revenue (USD Billion) Forecast, by Segment 2, 2018-2029
      Table 19: Asia Pacific Standard Modular Hydropower Market Revenue (USD Billion) Forecast, by Segment 3, 2018-2029
      Table 20: Asia Pacific Standard Modular Hydropower Market Revenue (USD Billion) Forecast, by Country, 2018-2029
      Table 21: Middle East & Africa Standard Modular Hydropower Market Revenue (USD Billion) Forecast, by Segment 1, 2018-2029
      Table 22: Middle East & Africa Standard Modular Hydropower Market Revenue (USD Billion) Forecast, by Segment 2, 2018-2029
      Table 23: Middle East & Africa Standard Modular Hydropower Market Revenue (USD Billion) Forecast, by Segment 3, 2018-2029
      Table 24: Middle East & Africa Standard Modular Hydropower Market Revenue (USD Billion) Forecast, by Country, 2018-2029
      Research Process

      Data Library Research are conducted by industry experts who offer insight on industry structure, market segmentations technology assessment and competitive landscape (CL), and penetration, as well as on emerging trends. Their analysis is based on primary interviews (~ 80%) and secondary research (~ 20%) as well as years of professional expertise in their respective industries. Adding to this, by analysing historical trends and current market positions, our analysts predict where the market will be headed for the next five years. Furthermore, the varying trends of segment & categories geographically presented are also studied and the estimated based on the primary & secondary research.

      In this particular report from the supply side Data Library Research has conducted primary surveys (interviews) with the key level executives (VP, CEO’s, Marketing Director, Business Development Manager and SOFT) of the companies that active & prominent as well as the midsized organization

      FIGURE 1: DLR RESEARH PROCESS

      research-methodology1

      Primary Research

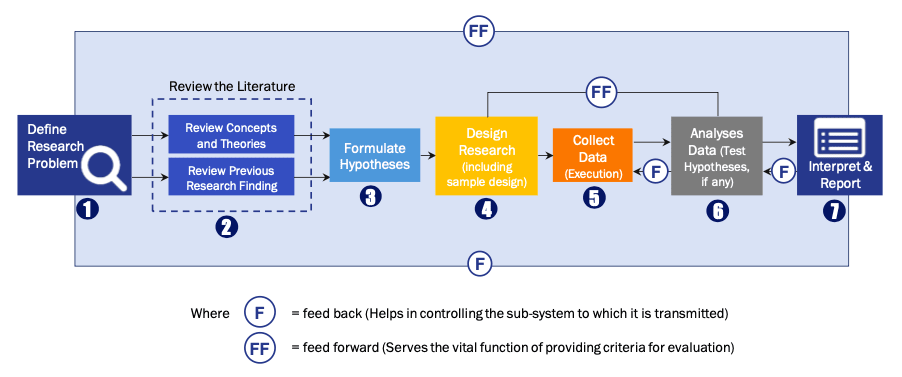
      Extensive primary research was conducted to gain a deeper insight of the market and industry performance. The analysis is based on both primary and secondary research as well as years of professional expertise in the respective industries.

      In addition to analysing current and historical trends, our analysts predict where the market is headed over the next five years.

      It varies by segment for these categories geographically presented in the list of market tables. Speaking about this particular report we have conducted primary surveys (interviews) with the key level executives (VP, CEO’s, Marketing Director, Business Development Manager and many more) of the major players active in the market.

      Secondary Research

      Secondary research was mainly used to collect and identify information useful for the extensive, technical, market-oriented, and Friend’s study of the Global Extra Neutral Alcohol. It was also used to obtain key information about major players, market classification and segmentation according to the industry trends, geographical markets, and developments related to the market and technology perspectives. For this study, analysts have gathered information from various credible sources, such as annual reports, sec filings, journals, white papers, SOFT presentations, and company web sites.

      Market Size Estimation

      Both, top-down and bottom-up approaches were used to estimate and validate the size of the Global market and to estimate the size of various other dependent submarkets in the overall Extra Neutral Alcohol. The key players in the market were identified through secondary research and their market contributions in the respective geographies were determined through primary and secondary research.

      Forecast Model

      research-methodology2