Rotary Uninterruptible Power Supply (UPS) Market Overview and Analysis:

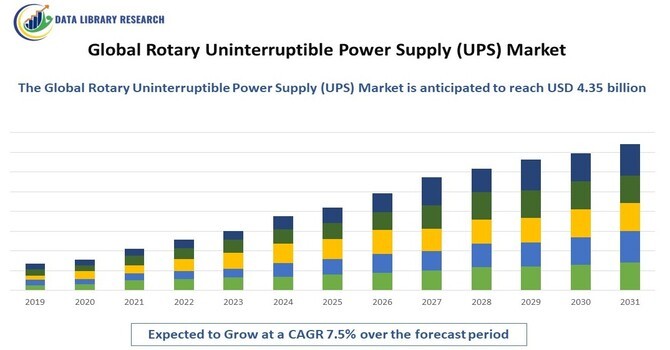
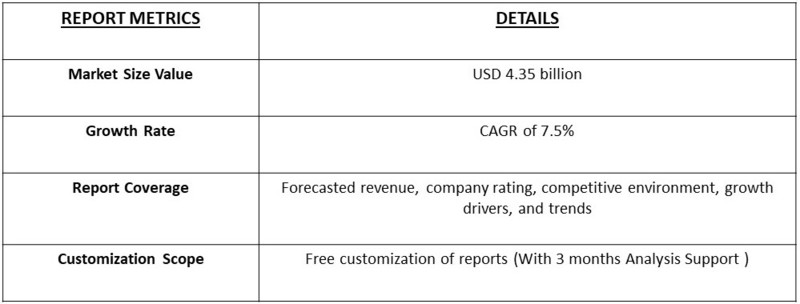
The global Rotary Uninterruptible Power Supply (UPS) Market is projected to reach a market value of USD 2.15 billion in 2023 and is expected to reach USD 4.35 billion by 2031, registering a Compound Annual Growth Rate (CAGR) of 7.5% during the forecast period, 2023-2031.

 Rotary Uninterruptible Power Supply (UPS) Market

Get a Complete Analysis Of The Report - Download a Free Sample PDF

The Global Rotary Uninterruptible Power Supply (UPS) Market encompasses the design, production, and distribution of rotary UPS systems that provide reliable backup power and voltage regulation for critical applications. Rotary UPS systems utilize rotating machinery to deliver continuous power during outages or fluctuations, ensuring a stable energy supply for essential operations in sectors like data centers, telecommunications, healthcare, and industrial processes. The market is driven by the increasing need for uninterrupted power supply to protect sensitive equipment and maintain operational continuity. Additionally, the growing reliance on digital infrastructure and the expansion of renewable energy sources are further propelling demand for advanced rotary UPS solutions.

The Global Rotary Uninterruptible Power Supply (UPS) Market is driven by several key factors, including the increasing reliance on digital infrastructure across various industries, which necessitates uninterrupted power supply to protect sensitive equipment. The growing frequency of power outages and voltage fluctuations in many regions further emphasizes the need for reliable backup systems. Additionally, the rise in data center operations and the expansion of telecommunications networks are propelling demand for robust power solutions. Furthermore, advancements in rotary UPS technology, which offer higher efficiency and lower maintenance costs, are attracting investments. Lastly, regulatory mandates for energy efficiency and sustainability are pushing businesses to adopt reliable power solutions, thereby boosting the market for rotary UPS systems.

Rotary Uninterruptible Power Supply (UPS) Market Trends:

The Global Rotary Uninterruptible Power Supply (UPS) Market is poised for significant growth, driven by the increasing demand for reliable and efficient power backup solutions. Key trends include the growing adoption of renewable energy sources and the need for grid stability, as well as the increasing use of UPS systems in data centers and cloud computing infrastructure. Additionally, the growing focus on energy efficiency and sustainability is also driving demand for rotary UPS systems, which offer higher efficiency and longer lifespan compared to traditional UPS systems. Furthermore, advancements in technology are enabling the development of more compact and cost-effective rotary UPS systems.

Market Segmentation

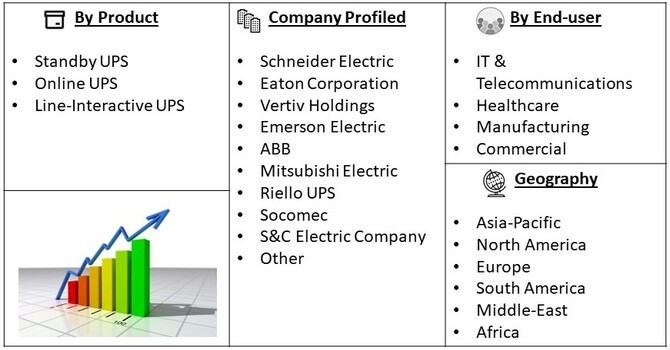
The Global Rotary Uninterruptible Power Supply (UPS) Market is segmented By Product Type (Standby UPS, Online UPS, Line-Interactive UPS) By End-use Industry (IT & Telecommunications, Healthcare, Manufacturing, Commercial) and geography (Asia-Pacific, North America, Europe, South America, and Middle-East and Africa). The report offers the market size and forecasts for revenue (USD million) for all the above segments.

 Rotary Uninterruptible Power Supply (UPS) Market Segment

For Detailed Market Segmentation - Get a Free Sample PDF

Market Drivers

  • Growing demand for renewable energy

The Global Rotary Uninterruptible Power Supply (UPS) Market is driven by the growing demand for renewable energy. As the world shifts towards cleaner and more sustainable energy sources, the need for reliable and efficient power backup solutions is increasing. According to a recent report by the International Energy Agency, renewable energy is expected to account for 30% of global energy production by 2030. As a result, companies are investing in rotary UPS systems to ensure reliable power backup for their renewable energy installations. Additionally, the growing demand for grid stability and resilience is also driving demand for rotary UPS systems, which offer higher efficiency and longer lifespan compared to traditional UPS systems.

  • Increasing use in data centres and cloud computing

The Global Rotary Uninterruptible Power Supply (UPS) Market is also driven by the increasing use of rotary UPS systems in data centers and cloud computing infrastructure. As data centers and cloud computing infrastructure continue to grow, the need for reliable and efficient power backup solutions is increasing. According to a recent report by Data Center Dynamics, the global data center market is expected to reach USD 200 billion by 2025. As a result, companies are investing in rotary UPS systems to ensure reliable power backup for their data centers and cloud computing infrastructure. Additionally, the growing demand for edge computing and IoT devices is also driving demand for rotary UPS systems, which offer higher efficiency and longer lifespan compared to traditional UPS systems.

Market Restraints:

The Global Rotary Uninterruptible Power Supply (UPS) Market is restrained by high initial investment costs. Rotary UPS systems are more expensive than traditional UPS systems, which can be a barrier to entry for some companies. According to a recent report by the UPS Market Report, the average cost of a rotary UPS system is around 10,000 to 50,000, depending on the size and capacity of the system. Additionally, the high upfront costs of rotary UPS systems can make it difficult for companies to justify the investment, especially for smaller businesses or startups. As a result, companies are being cautious in their investment decisions, which is restraining market growth.

COVID-19 Impact On Rotary Uninterruptible Power Supply (UPS) Market

The COVID-19 pandemic had a notable impact on the Global Rotary Uninterruptible Power Supply (UPS) Market. Initially, supply chain disruptions and manufacturing delays affected production schedules and product availability. However, as businesses transitioned to remote work and increased their reliance on digital infrastructure, the demand for reliable power solutions surged. Data centers and telecommunications providers faced heightened pressure to maintain uptime, leading to increased investments in UPS systems. Additionally, the pandemic highlighted the critical importance of uninterrupted power supply in healthcare facilities, prompting a shift in purchasing priorities. Overall, while the market faced short-term challenges, the long-term outlook remains positive as businesses recognize the necessity of robust power protection in a digital-first world.

Segmental Analysis

  • Online UPS Segment is Expected to Witness Significant Growth Over the Forecast Period

The online UPS sub-segment of the Global Rotary Uninterruptible Power Supply (UPS) Market is witnessing substantial growth, driven by the increasing demand for continuous power supply in critical applications. Online UPS systems provide a seamless transition to backup power, ensuring zero downtime for sensitive equipment, making them ideal for data centers, healthcare facilities, and telecommunications. In 2023, major players like Schneider Electric and Eaton launched advanced online UPS solutions equipped with smart monitoring features, enabling remote management and predictive maintenance. This trend is supported by the growing reliance on cloud computing and data storage, where even brief power interruptions can lead to significant data loss and operational disruptions. As businesses prioritize reliability and uptime, the online UPS sub-segment is expected to continue expanding, fueled by technological advancements and increasing awareness of power quality issues.

  • The Healthcare Sector Segment is Expected to Witness Significant Growth Over the Forecast Period

The healthcare sector is a significant end-user of the Global Rotary Uninterruptible Power Supply (UPS) Market, primarily due to its reliance on continuous power for critical medical equipment. Hospitals and clinics require UPS systems to ensure that life-support machines, imaging devices, and surgical tools remain operational during power outages. Recent developments in 2023 highlighted the importance of robust power solutions when the COVID-19 pandemic intensified the focus on healthcare infrastructure. Companies like Vertiv and APC by Schneider Electric introduced specialized UPS systems tailored for healthcare settings, featuring enhanced battery management and real-time monitoring capabilities. The driving factors for this sub-segment include regulatory requirements for power reliability in healthcare, increasing investments in hospital infrastructure, and the need for uninterrupted service to protect patient safety. As healthcare facilities expand and modernize, the demand for reliable UPS solutions is expected to rise, ensuring operational continuity in this critical sector.

  • Asia Pacific Region is Expected to Witness Significant Growth Over the Forecast Period

The Asia-Pacific region is projected to witness significant growth in the Global Rotary Uninterruptible Power Supply (UPS) Market over the forecast period. This growth is driven by rapid industrialization and urbanization in countries such as China and India, where there is an increasing demand for reliable power solutions across various sectors. The region's expanding data center operations and the rise of cloud computing are further fueling the need for UPS systems to ensure uninterrupted service and protect sensitive equipment. Additionally, government initiatives promoting infrastructure development and energy efficiency are creating a favorable environment for UPS adoption. As businesses recognize the critical importance of maintaining operational continuity, the Asia-Pacific region is set to become a key market for rotary UPS systems, driven by technological advancements and heightened awareness of power quality issues.

 Rotary Uninterruptible Power Supply (UPS) Market Table

To Learn More About This Report - Request a Free Sample Copy

Rotary Uninterruptible Power Supply (UPS) Market Competitive Landscape:

The competitive landscape of the Global Rotary Uninterruptible Power Supply (UPS) Market is marked by a diverse range of players focusing on innovation and customer-centric solutions. Key industry participants are investing heavily in research and development to enhance product efficiency and incorporate advanced technologies, such as IoT and AI for smart monitoring and predictive maintenance. Strategic partnerships and acquisitions are also common as companies seek to expand their market reach and diversify their product offerings.

Prominent competitors in this market include

  • Schneider Electric
  • Eaton Corporation
  • Vertiv Holdings
  • Emerson Electric
  • ABB
  • Mitsubishi Electric
  • Riello UPS
  • Socomec
  • S&C Electric Company

Recent Development:

  1. In 2023, Eaton Corporation announced the launch of its new range of rotary UPS systems designed for data centers and critical infrastructure applications. These systems feature advanced energy efficiency technologies that significantly reduce operational costs while providing reliable backup power. The new UPS models are equipped with enhanced monitoring capabilities that allow for real-time diagnostics and predictive maintenance, helping customers optimize their power management strategies. This development reflects Eaton's commitment to sustainability and innovation, positioning the company to better serve the growing demand for efficient power solutions in the digital era.
  2. In early 2024, Schneider Electric unveiled an upgraded version of its EcoStruxure Power platform, integrating advanced rotary UPS systems that offer improved scalability and efficiency for industrial applications. This platform enhancement includes smart connectivity features that enable remote monitoring and management of UPS systems, allowing businesses to proactively address power quality issues. The upgrade is aimed at meeting the increasing demand for robust power protection solutions in sectors like manufacturing and telecommunications. This initiative showcases Schneider Electric's dedication to enhancing operational reliability while promoting energy efficiency in power management systems.


Frequently Asked Questions (FAQ) :

Q1. What are the driving factors for the Global Rotatory UPS Market?

The Global Rotary UPS Market is primarily driven by the increasing demand for uninterrupted power supply (UPS) systems across various industries, including data centers, healthcare, and manufacturing. As organizations become increasingly reliant on digital infrastructure, the need for reliable power backup solutions has intensified. Rotary UPS systems are favored for their ability to provide long-duration backup power while offering high efficiency and lower total cost of ownership compared to traditional systems. Additionally, the growing adoption of renewable energy sources necessitates robust energy management solutions, where rotary UPS systems play a crucial role. Technological advancements, such as improved design and integration with smart grid technologies, further enhance their appeal, contributing to market growth.

Q2. What are the restraining factors for the Global Rotatory UPS Market?

Despite its advantages, the Global Rotary UPS Market faces several restraining factors. One of the main challenges is the high initial capital investment required for rotary UPS systems, which can be a barrier for small to medium-sized enterprises. Maintenance and operational costs associated with rotary systems may also deter potential users, especially when compared to simpler, less expensive alternatives like static UPS systems. Additionally, the increasing popularity of lithium-ion battery-based UPS solutions poses competitive pressure on rotary systems, which may be perceived as outdated by some customers. Moreover, the complexity of installation and integration into existing infrastructure can create additional hurdles for adoption, particularly in regions with less developed electrical grids.

Q3. Which segment is projected to hold the largest share in the Global Rotatory UPS Market?

The industrial rotary UPS segment is projected to hold the largest share in the Global Rotary UPS Market. This segment benefits from the high demand for reliable power backup in critical applications, such as data centers, manufacturing facilities, and large commercial operations. Industrial environments often require robust, long-lasting power solutions that can handle significant loads and fluctuations, making rotary UPS systems particularly suitable. Their ability to deliver high efficiency and reduced downtime is crucial in industries where continuous operation is essential. As industries increasingly prioritize energy efficiency and reliability, the industrial rotary UPS segment is expected to maintain its leading position in the market.

Q4. Which region holds the largest share in the Global Rotatory UPS Market?

North America currently holds the largest share in the Global Rotary UPS Market, driven by the presence of advanced infrastructure and a high concentration of data centers and critical facilities. The region’s emphasis on reliable power supply and stringent regulatory standards for data protection have led to increased investment in rotary UPS systems. Additionally, companies are actively seeking solutions to enhance energy efficiency and minimize downtime, further propelling market growth. While Asia-Pacific is rapidly expanding due to industrialization and growing infrastructure needs, North America's established market and technological advancements position it as the leader in the rotary UPS sector.

Q5. Which are the prominent players in the Global Rotatory UPS Market?

Prominent players in the Global Rotary UPS Market include Emerson Electric Co., known for its robust UPS solutions and extensive expertise in power management. Schneider Electric is another key player, offering a wide range of rotary UPS systems designed for various applications. Eaton Corporation provides innovative power management solutions, including rotary UPS systems, catering to industrial and commercial sectors. S&C Electric Company specializes in advanced electrical systems, including rotary UPS solutions. Other notable players include Mitsubishi Electric, General Electric, and Vertiv, all of which are actively involved in developing and enhancing rotary UPS technologies. These companies focus on innovation, efficiency, and reliability to meet the growing demands of the market.

1. EXECUTIVE SUMMARY

  • 1.1. Market Overview
  • 1.2. Key Findings
  • 1.3. Market Segmentation
  • 1.4. Competitive Landscape
  • 1.5. Challenges and Opportunities
  • 1.6. Future Outlook

2. MARKET INTRODUCTION

  • 2.1. Definition
  • 2.2. Scope of the study
    • 2.2.1. Research Objective
    • 2.2.2. Assumption
    • 2.2.3. Limitations

3. RESEARCH METHODOLOGY

  • 3.1. Overview
  • 3.2. Data Mining
  • 3.3. Secondary Research
  • 3.4. Primary Research
    • 3.4.1. Primary Interviews and Information Gathering Process
    • 3.4.2. Breakdown of Primary Respondents
  • 3.5. Forecasting Model
  • 3.6. Market Size Estimation
    • 3.6.1. Bottom-Up Approach
    • 3.6.2. Top-Down Approach
  • 3.7. Data Triangulation
  • 3.8. Validation

4. MARKET DYNAMICS

  • 4.1. Overview
  • 4.2. Drivers
  • 4.3. Restraints
  • 4.4. Opportunities

5. MARKET FACTOR ANALYSIS

  • 5.1. Value chain Analysis
  • 5.2. Porter's Five Forces Analysis
    • 5.2.1. Bargaining Power of Suppliers
    • 5.2.2. Bargaining Power of Buyers
    • 5.2.3. Threat of New Entrants
    • 5.2.4. Threat of Substitutes
    • 5.2.5. Intensity of Rivalry
  • 5.3. COVID-19 Impact Analysis
    • 5.3.1. Market Impact Analysis
    • 5.3.2. Regional Impact
    • 5.3.3. Opportunity and Threat Analysis

6. ROTARY UNINTERRUPTIBLE POWER SUPPLY MARKET, BY CAPACITY (USD BILLION)

  • 6.1. Below 10 kVA
  • 6.2. 10-100 kVA
  • 6.3. 100-500 kVA
  • 6.4. 500 kVA and above

7. ROTARY UNINTERRUPTIBLE POWER SUPPLY MARKET, BY INPUT VOLTAGE (USD BILLION)

  • 7.1. Below 230V
  • 7.2. 230-480V
  • 7.3. 480-690V
  • 7.4. 690V and above

8. ROTARY UNINTERRUPTIBLE POWER SUPPLY MARKET, BY OUTPUT VOLTAGE (USD BILLION)

  • 8.1. Single Phase
  • 8.2. Three Phase

9. ROTARY UNINTERRUPTIBLE POWER SUPPLY MARKET, BY TECHNOLOGY (USD BILLION)

  • 9.1. Online
  • 9.2. Offline
  • 9.3. Line Interactive

10. ROTARY UNINTERRUPTIBLE POWER SUPPLY MARKET, BY APPLICATION (USD BILLION)

  • 10.1. Data Centers
  • 10.2. Telecom
  • 10.3. Medical
  • 10.4. Industrial
  • 10.5. Commercial

11. ROTARY UNINTERRUPTIBLE POWER SUPPLY MARKET, BY REGIONAL (USD BILLION)

  • 11.1. North America
    • 11.1.1. US
    • 11.1.2. Canada
  • 11.2. Europe
    • 11.2.1. Germany
    • 11.2.2. UK
    • 11.2.3. France
    • 11.2.4. Russia
    • 11.2.5. Italy
    • 11.2.6. Spain
    • 11.2.7. Rest of Europe
  • 11.3. APAC
    • 11.3.1. China
    • 11.3.2. India
    • 11.3.3. Japan
    • 11.3.4. South Korea
    • 11.3.5. Malaysia
    • 11.3.6. Thailand
    • 11.3.7. Indonesia
    • 11.3.8. Rest of APAC
  • 11.4. South America
    • 11.4.1. Brazil
    • 11.4.2. Mexico
    • 11.4.3. Argentina
    • 11.4.4. Rest of South America
  • 11.5. MEA
    • 11.5.1. GCC Countries
    • 11.5.2. South Africa
    • 11.5.3. Rest of MEA

12. COMPETITIVE LANDSCAPE

  • 12.1. Overview
  • 12.2. Competitive Analysis
  • 12.3. Market share Analysis
  • 12.4. Major Growth Strategy in the Rotary Uninterruptible Power Supply Market
  • 12.5. Competitive Benchmarking
  • 12.6. Leading Players in Terms of Number of Developments in the Rotary Uninterruptible Power Supply Market
  • 12.7. Key developments and growth strategies
    • 12.7.1. New Product Launch/Service Deployment
    • 12.7.2. Merger & Acquisitions
    • 12.7.3. Joint Ventures
  • 12.8. Major Players Financial Matrix
    • 12.8.1. Sales and Operating Income
    • 12.8.2. Major Players R&D Expenditure. 2023

13. COMPANY PROFILES

  • 13.1. Emerson Electric
    • 13.1.1. Financial Overview
    • 13.1.2. Products Offered
    • 13.1.3. Key Developments
    • 13.1.4. SWOT Analysis
    • 13.1.5. Key Strategies
  • 13.2. ABB
    • 13.2.1. Financial Overview
    • 13.2.2. Products Offered
    • 13.2.3. Key Developments
    • 13.2.4. SWOT Analysis
    • 13.2.5. Key Strategies
  • 13.3. Legrand
    • 13.3.1. Financial Overview
    • 13.3.2. Products Offered
    • 13.3.3. Key Developments
    • 13.3.4. SWOT Analysis
    • 13.3.5. Key Strategies
  • 13.4. Delta Electronics
    • 13.4.1. Financial Overview
    • 13.4.2. Products Offered
    • 13.4.3. Key Developments
    • 13.4.4. SWOT Analysis
    • 13.4.5. Key Strategies
  • 13.5. Cummins
    • 13.5.1. Financial Overview
    • 13.5.2. Products Offered
    • 13.5.3. Key Developments
    • 13.5.4. SWOT Analysis
    • 13.5.5. Key Strategies
  • 13.6. Riello UPS
    • 13.6.1. Financial Overview
    • 13.6.2. Products Offered
    • 13.6.3. Key Developments
    • 13.6.4. SWOT Analysis
    • 13.6.5. Key Strategies
  • 13.7. Rittal
    • 13.7.1. Financial Overview
    • 13.7.2. Products Offered
    • 13.7.3. Key Developments
    • 13.7.4. SWOT Analysis
    • 13.7.5. Key Strategies
  • 13.8. General Electric (GE)
    • 13.8.1. Financial Overview
    • 13.8.2. Products Offered
    • 13.8.3. Key Developments
    • 13.8.4. SWOT Analysis
    • 13.8.5. Key Strategies
  • 13.9. Eaton Corporation
    • 13.9.1. Financial Overview
    • 13.9.2. Products Offered
    • 13.9.3. Key Developments
    • 13.9.4. SWOT Analysis
    • 13.9.5. Key Strategies
  • 13.10. Vertiv
    • 13.10.1. Financial Overview
    • 13.10.2. Products Offered
    • 13.10.3. Key Developments
    • 13.10.4. SWOT Analysis
    • 13.10.5. Key Strategies
  • 13.11. Mitsubishi Electric
    • 13.11.1. Financial Overview
    • 13.11.2. Products Offered
    • 13.11.3. Key Developments
    • 13.11.4. SWOT Analysis
    • 13.11.5. Key Strategies
  • 13.12. Kohler
    • 13.12.1. Financial Overview
    • 13.12.2. Products Offered
    • 13.12.3. Key Developments
    • 13.12.4. SWOT Analysis
    • 13.12.5. Key Strategies
  • 13.13. Schneider Electric
    • 13.13.1. Financial Overview
    • 13.13.2. Products Offered
    • 13.13.3. Key Developments
    • 13.13.4. SWOT Analysis
    • 13.13.5. Key Strategies
  • 13.14. Socomec
    • 13.14.1. Financial Overview
    • 13.14.2. Products Offered
    • 13.14.3. Key Developments
    • 13.14.4. SWOT Analysis
    • 13.14.5. Key Strategies
  • 13.15. Liebert
    • 13.15.1. Financial Overview
    • 13.15.2. Products Offered
    • 13.15.3. Key Developments
    • 13.15.4. SWOT Analysis
    • 13.15.5. Key Strategies

14. APPENDIX

  • 14.1. References
FIGURE 1. MARKET SYNOPSIS
FIGURE 2. NORTH AMERICA ROTARY UNINTERRUPTIBLE POWER SUPPLY MARKET ANALYSIS
FIGURE 3. US ROTARY UNINTERRUPTIBLE POWER SUPPLY MARKET ANALYSIS BY CAPACITY
FIGURE 4. US ROTARY UNINTERRUPTIBLE POWER SUPPLY MARKET ANALYSIS BY INPUT VOLTAGE
FIGURE 5. US ROTARY UNINTERRUPTIBLE POWER SUPPLY MARKET ANALYSIS BY OUTPUT VOLTAGE
FIGURE 6. US ROTARY UNINTERRUPTIBLE POWER SUPPLY MARKET ANALYSIS BY TECHNOLOGY
FIGURE 7. US ROTARY UNINTERRUPTIBLE POWER SUPPLY MARKET ANALYSIS BY APPLICATION
FIGURE 8. US ROTARY UNINTERRUPTIBLE POWER SUPPLY MARKET ANALYSIS BY REGIONAL
FIGURE 9. CANADA ROTARY UNINTERRUPTIBLE POWER SUPPLY MARKET ANALYSIS BY CAPACITY
FIGURE 10. CANADA ROTARY UNINTERRUPTIBLE POWER SUPPLY MARKET ANALYSIS BY INPUT VOLTAGE
FIGURE 11. CANADA ROTARY UNINTERRUPTIBLE POWER SUPPLY MARKET ANALYSIS BY OUTPUT VOLTAGE
FIGURE 12. CANADA ROTARY UNINTERRUPTIBLE POWER SUPPLY MARKET ANALYSIS BY TECHNOLOGY
FIGURE 13. CANADA ROTARY UNINTERRUPTIBLE POWER SUPPLY MARKET ANALYSIS BY APPLICATION
FIGURE 14. CANADA ROTARY UNINTERRUPTIBLE POWER SUPPLY MARKET ANALYSIS BY REGIONAL
FIGURE 15. EUROPE ROTARY UNINTERRUPTIBLE POWER SUPPLY MARKET ANALYSIS
FIGURE 16. GERMANY ROTARY UNINTERRUPTIBLE POWER SUPPLY MARKET ANALYSIS BY CAPACITY
FIGURE 17. GERMANY ROTARY UNINTERRUPTIBLE POWER SUPPLY MARKET ANALYSIS BY INPUT VOLTAGE
FIGURE 18. GERMANY ROTARY UNINTERRUPTIBLE POWER SUPPLY MARKET ANALYSIS BY OUTPUT VOLTAGE
FIGURE 19. GERMANY ROTARY UNINTERRUPTIBLE POWER SUPPLY MARKET ANALYSIS BY TECHNOLOGY
FIGURE 20. GERMANY ROTARY UNINTERRUPTIBLE POWER SUPPLY MARKET ANALYSIS BY APPLICATION
FIGURE 21. GERMANY ROTARY UNINTERRUPTIBLE POWER SUPPLY MARKET ANALYSIS BY REGIONAL
FIGURE 22. UK ROTARY UNINTERRUPTIBLE POWER SUPPLY MARKET ANALYSIS BY CAPACITY
FIGURE 23. UK ROTARY UNINTERRUPTIBLE POWER SUPPLY MARKET ANALYSIS BY INPUT VOLTAGE
FIGURE 24. UK ROTARY UNINTERRUPTIBLE POWER SUPPLY MARKET ANALYSIS BY OUTPUT VOLTAGE
FIGURE 25. UK ROTARY UNINTERRUPTIBLE POWER SUPPLY MARKET ANALYSIS BY TECHNOLOGY
FIGURE 26. UK ROTARY UNINTERRUPTIBLE POWER SUPPLY MARKET ANALYSIS BY APPLICATION
FIGURE 27. UK ROTARY UNINTERRUPTIBLE POWER SUPPLY MARKET ANALYSIS BY REGIONAL
FIGURE 28. FRANCE ROTARY UNINTERRUPTIBLE POWER SUPPLY MARKET ANALYSIS BY CAPACITY
FIGURE 29. FRANCE ROTARY UNINTERRUPTIBLE POWER SUPPLY MARKET ANALYSIS BY INPUT VOLTAGE
FIGURE 30. FRANCE ROTARY UNINTERRUPTIBLE POWER SUPPLY MARKET ANALYSIS BY OUTPUT VOLTAGE
FIGURE 31. FRANCE ROTARY UNINTERRUPTIBLE POWER SUPPLY MARKET ANALYSIS BY TECHNOLOGY
FIGURE 32. FRANCE ROTARY UNINTERRUPTIBLE POWER SUPPLY MARKET ANALYSIS BY APPLICATION
FIGURE 33. FRANCE ROTARY UNINTERRUPTIBLE POWER SUPPLY MARKET ANALYSIS BY REGIONAL
FIGURE 34. RUSSIA ROTARY UNINTERRUPTIBLE POWER SUPPLY MARKET ANALYSIS BY CAPACITY
FIGURE 35. RUSSIA ROTARY UNINTERRUPTIBLE POWER SUPPLY MARKET ANALYSIS BY INPUT VOLTAGE
FIGURE 36. RUSSIA ROTARY UNINTERRUPTIBLE POWER SUPPLY MARKET ANALYSIS BY OUTPUT VOLTAGE
FIGURE 37. RUSSIA ROTARY UNINTERRUPTIBLE POWER SUPPLY MARKET ANALYSIS BY TECHNOLOGY
FIGURE 38. RUSSIA ROTARY UNINTERRUPTIBLE POWER SUPPLY MARKET ANALYSIS BY APPLICATION
FIGURE 39. RUSSIA ROTARY UNINTERRUPTIBLE POWER SUPPLY MARKET ANALYSIS BY REGIONAL
FIGURE 40. ITALY ROTARY UNINTERRUPTIBLE POWER SUPPLY MARKET ANALYSIS BY CAPACITY
FIGURE 41. ITALY ROTARY UNINTERRUPTIBLE POWER SUPPLY MARKET ANALYSIS BY INPUT VOLTAGE
FIGURE 42. ITALY ROTARY UNINTERRUPTIBLE POWER SUPPLY MARKET ANALYSIS BY OUTPUT VOLTAGE
FIGURE 43. ITALY ROTARY UNINTERRUPTIBLE POWER SUPPLY MARKET ANALYSIS BY TECHNOLOGY
FIGURE 44. ITALY ROTARY UNINTERRUPTIBLE POWER SUPPLY MARKET ANALYSIS BY APPLICATION
FIGURE 45. ITALY ROTARY UNINTERRUPTIBLE POWER SUPPLY MARKET ANALYSIS BY REGIONAL
FIGURE 46. SPAIN ROTARY UNINTERRUPTIBLE POWER SUPPLY MARKET ANALYSIS BY CAPACITY
FIGURE 47. SPAIN ROTARY UNINTERRUPTIBLE POWER SUPPLY MARKET ANALYSIS BY INPUT VOLTAGE
FIGURE 48. SPAIN ROTARY UNINTERRUPTIBLE POWER SUPPLY MARKET ANALYSIS BY OUTPUT VOLTAGE
FIGURE 49. SPAIN ROTARY UNINTERRUPTIBLE POWER SUPPLY MARKET ANALYSIS BY TECHNOLOGY
FIGURE 50. SPAIN ROTARY UNINTERRUPTIBLE POWER SUPPLY MARKET ANALYSIS BY APPLICATION
FIGURE 51. SPAIN ROTARY UNINTERRUPTIBLE POWER SUPPLY MARKET ANALYSIS BY REGIONAL
FIGURE 52. REST OF EUROPE ROTARY UNINTERRUPTIBLE POWER SUPPLY MARKET ANALYSIS BY CAPACITY
FIGURE 53. REST OF EUROPE ROTARY UNINTERRUPTIBLE POWER SUPPLY MARKET ANALYSIS BY INPUT VOLTAGE
FIGURE 54. REST OF EUROPE ROTARY UNINTERRUPTIBLE POWER SUPPLY MARKET ANALYSIS BY OUTPUT VOLTAGE
FIGURE 55. REST OF EUROPE ROTARY UNINTERRUPTIBLE POWER SUPPLY MARKET ANALYSIS BY TECHNOLOGY
FIGURE 56. REST OF EUROPE ROTARY UNINTERRUPTIBLE POWER SUPPLY MARKET ANALYSIS BY APPLICATION
FIGURE 57. REST OF EUROPE ROTARY UNINTERRUPTIBLE POWER SUPPLY MARKET ANALYSIS BY REGIONAL
FIGURE 58. APAC ROTARY UNINTERRUPTIBLE POWER SUPPLY MARKET ANALYSIS
FIGURE 59. CHINA ROTARY UNINTERRUPTIBLE POWER SUPPLY MARKET ANALYSIS BY CAPACITY
FIGURE 60. CHINA ROTARY UNINTERRUPTIBLE POWER SUPPLY MARKET ANALYSIS BY INPUT VOLTAGE
FIGURE 61. CHINA ROTARY UNINTERRUPTIBLE POWER SUPPLY MARKET ANALYSIS BY OUTPUT VOLTAGE
FIGURE 62. CHINA ROTARY UNINTERRUPTIBLE POWER SUPPLY MARKET ANALYSIS BY TECHNOLOGY
FIGURE 63. CHINA ROTARY UNINTERRUPTIBLE POWER SUPPLY MARKET ANALYSIS BY APPLICATION
FIGURE 64. CHINA ROTARY UNINTERRUPTIBLE POWER SUPPLY MARKET ANALYSIS BY REGIONAL
FIGURE 65. INDIA ROTARY UNINTERRUPTIBLE POWER SUPPLY MARKET ANALYSIS BY CAPACITY
FIGURE 66. INDIA ROTARY UNINTERRUPTIBLE POWER SUPPLY MARKET ANALYSIS BY INPUT VOLTAGE
FIGURE 67. INDIA ROTARY UNINTERRUPTIBLE POWER SUPPLY MARKET ANALYSIS BY OUTPUT VOLTAGE
FIGURE 68. INDIA ROTARY UNINTERRUPTIBLE POWER SUPPLY MARKET ANALYSIS BY TECHNOLOGY
FIGURE 69. INDIA ROTARY UNINTERRUPTIBLE POWER SUPPLY MARKET ANALYSIS BY APPLICATION
FIGURE 70. INDIA ROTARY UNINTERRUPTIBLE POWER SUPPLY MARKET ANALYSIS BY REGIONAL
FIGURE 71. JAPAN ROTARY UNINTERRUPTIBLE POWER SUPPLY MARKET ANALYSIS BY CAPACITY
FIGURE 72. JAPAN ROTARY UNINTERRUPTIBLE POWER SUPPLY MARKET ANALYSIS BY INPUT VOLTAGE
FIGURE 73. JAPAN ROTARY UNINTERRUPTIBLE POWER SUPPLY MARKET ANALYSIS BY OUTPUT VOLTAGE
FIGURE 74. JAPAN ROTARY UNINTERRUPTIBLE POWER SUPPLY MARKET ANALYSIS BY TECHNOLOGY
FIGURE 75. JAPAN ROTARY UNINTERRUPTIBLE POWER SUPPLY MARKET ANALYSIS BY APPLICATION
FIGURE 76. JAPAN ROTARY UNINTERRUPTIBLE POWER SUPPLY MARKET ANALYSIS BY REGIONAL
FIGURE 77. SOUTH KOREA ROTARY UNINTERRUPTIBLE POWER SUPPLY MARKET ANALYSIS BY CAPACITY
FIGURE 78. SOUTH KOREA ROTARY UNINTERRUPTIBLE POWER SUPPLY MARKET ANALYSIS BY INPUT VOLTAGE
FIGURE 79. SOUTH KOREA ROTARY UNINTERRUPTIBLE POWER SUPPLY MARKET ANALYSIS BY OUTPUT VOLTAGE
FIGURE 80. SOUTH KOREA ROTARY UNINTERRUPTIBLE POWER SUPPLY MARKET ANALYSIS BY TECHNOLOGY
FIGURE 81. SOUTH KOREA ROTARY UNINTERRUPTIBLE POWER SUPPLY MARKET ANALYSIS BY APPLICATION
FIGURE 82. SOUTH KOREA ROTARY UNINTERRUPTIBLE POWER SUPPLY MARKET ANALYSIS BY REGIONAL
FIGURE 83. MALAYSIA ROTARY UNINTERRUPTIBLE POWER SUPPLY MARKET ANALYSIS BY CAPACITY
FIGURE 84. MALAYSIA ROTARY UNINTERRUPTIBLE POWER SUPPLY MARKET ANALYSIS BY INPUT VOLTAGE
FIGURE 85. MALAYSIA ROTARY UNINTERRUPTIBLE POWER SUPPLY MARKET ANALYSIS BY OUTPUT VOLTAGE
FIGURE 86. MALAYSIA ROTARY UNINTERRUPTIBLE POWER SUPPLY MARKET ANALYSIS BY TECHNOLOGY
FIGURE 87. MALAYSIA ROTARY UNINTERRUPTIBLE POWER SUPPLY MARKET ANALYSIS BY APPLICATION
FIGURE 88. MALAYSIA ROTARY UNINTERRUPTIBLE POWER SUPPLY MARKET ANALYSIS BY REGIONAL
FIGURE 89. THAILAND ROTARY UNINTERRUPTIBLE POWER SUPPLY MARKET ANALYSIS BY CAPACITY
FIGURE 90. THAILAND ROTARY UNINTERRUPTIBLE POWER SUPPLY MARKET ANALYSIS BY INPUT VOLTAGE
FIGURE 91. THAILAND ROTARY UNINTERRUPTIBLE POWER SUPPLY MARKET ANALYSIS BY OUTPUT VOLTAGE
FIGURE 92. THAILAND ROTARY UNINTERRUPTIBLE POWER SUPPLY MARKET ANALYSIS BY TECHNOLOGY
FIGURE 93. THAILAND ROTARY UNINTERRUPTIBLE POWER SUPPLY MARKET ANALYSIS BY APPLICATION
FIGURE 94. THAILAND ROTARY UNINTERRUPTIBLE POWER SUPPLY MARKET ANALYSIS BY REGIONAL
FIGURE 95. INDONESIA ROTARY UNINTERRUPTIBLE POWER SUPPLY MARKET ANALYSIS BY CAPACITY
FIGURE 96. INDONESIA ROTARY UNINTERRUPTIBLE POWER SUPPLY MARKET ANALYSIS BY INPUT VOLTAGE
FIGURE 97. INDONESIA ROTARY UNINTERRUPTIBLE POWER SUPPLY MARKET ANALYSIS BY OUTPUT VOLTAGE
FIGURE 98. INDONESIA ROTARY UNINTERRUPTIBLE POWER SUPPLY MARKET ANALYSIS BY TECHNOLOGY
FIGURE 99. INDONESIA ROTARY UNINTERRUPTIBLE POWER SUPPLY MARKET ANALYSIS BY APPLICATION
FIGURE 100. INDONESIA ROTARY UNINTERRUPTIBLE POWER SUPPLY MARKET ANALYSIS BY REGIONAL
FIGURE 101. REST OF APAC ROTARY UNINTERRUPTIBLE POWER SUPPLY MARKET ANALYSIS BY CAPACITY
FIGURE 102. REST OF APAC ROTARY UNINTERRUPTIBLE POWER SUPPLY MARKET ANALYSIS BY INPUT VOLTAGE
FIGURE 103. REST OF APAC ROTARY UNINTERRUPTIBLE POWER SUPPLY MARKET ANALYSIS BY OUTPUT VOLTAGE
FIGURE 104. REST OF APAC ROTARY UNINTERRUPTIBLE POWER SUPPLY MARKET ANALYSIS BY TECHNOLOGY
FIGURE 105. REST OF APAC ROTARY UNINTERRUPTIBLE POWER SUPPLY MARKET ANALYSIS BY APPLICATION
FIGURE 106. REST OF APAC ROTARY UNINTERRUPTIBLE POWER SUPPLY MARKET ANALYSIS BY REGIONAL
FIGURE 107. SOUTH AMERICA ROTARY UNINTERRUPTIBLE POWER SUPPLY MARKET ANALYSIS
FIGURE 108. BRAZIL ROTARY UNINTERRUPTIBLE POWER SUPPLY MARKET ANALYSIS BY CAPACITY
FIGURE 109. BRAZIL ROTARY UNINTERRUPTIBLE POWER SUPPLY MARKET ANALYSIS BY INPUT VOLTAGE
FIGURE 110. BRAZIL ROTARY UNINTERRUPTIBLE POWER SUPPLY MARKET ANALYSIS BY OUTPUT VOLTAGE
FIGURE 111. BRAZIL ROTARY UNINTERRUPTIBLE POWER SUPPLY MARKET ANALYSIS BY TECHNOLOGY
FIGURE 112. BRAZIL ROTARY UNINTERRUPTIBLE POWER SUPPLY MARKET ANALYSIS BY APPLICATION
FIGURE 113. BRAZIL ROTARY UNINTERRUPTIBLE POWER SUPPLY MARKET ANALYSIS BY REGIONAL
FIGURE 114. MEXICO ROTARY UNINTERRUPTIBLE POWER SUPPLY MARKET ANALYSIS BY CAPACITY
FIGURE 115. MEXICO ROTARY UNINTERRUPTIBLE POWER SUPPLY MARKET ANALYSIS BY INPUT VOLTAGE
FIGURE 116. MEXICO ROTARY UNINTERRUPTIBLE POWER SUPPLY MARKET ANALYSIS BY OUTPUT VOLTAGE
FIGURE 117. MEXICO ROTARY UNINTERRUPTIBLE POWER SUPPLY MARKET ANALYSIS BY TECHNOLOGY
FIGURE 118. MEXICO ROTARY UNINTERRUPTIBLE POWER SUPPLY MARKET ANALYSIS BY APPLICATION
FIGURE 119. MEXICO ROTARY UNINTERRUPTIBLE POWER SUPPLY MARKET ANALYSIS BY REGIONAL
FIGURE 120. ARGENTINA ROTARY UNINTERRUPTIBLE POWER SUPPLY MARKET ANALYSIS BY CAPACITY
FIGURE 121. ARGENTINA ROTARY UNINTERRUPTIBLE POWER SUPPLY MARKET ANALYSIS BY INPUT VOLTAGE
FIGURE 122. ARGENTINA ROTARY UNINTERRUPTIBLE POWER SUPPLY MARKET ANALYSIS BY OUTPUT VOLTAGE
FIGURE 123. ARGENTINA ROTARY UNINTERRUPTIBLE POWER SUPPLY MARKET ANALYSIS BY TECHNOLOGY
FIGURE 124. ARGENTINA ROTARY UNINTERRUPTIBLE POWER SUPPLY MARKET ANALYSIS BY APPLICATION
FIGURE 125. ARGENTINA ROTARY UNINTERRUPTIBLE POWER SUPPLY MARKET ANALYSIS BY REGIONAL
FIGURE 126. REST OF SOUTH AMERICA ROTARY UNINTERRUPTIBLE POWER SUPPLY MARKET ANALYSIS BY CAPACITY
FIGURE 127. REST OF SOUTH AMERICA ROTARY UNINTERRUPTIBLE POWER SUPPLY MARKET ANALYSIS BY INPUT VOLTAGE
FIGURE 128. REST OF SOUTH AMERICA ROTARY UNINTERRUPTIBLE POWER SUPPLY MARKET ANALYSIS BY OUTPUT VOLTAGE
FIGURE 129. REST OF SOUTH AMERICA ROTARY UNINTERRUPTIBLE POWER SUPPLY MARKET ANALYSIS BY TECHNOLOGY
FIGURE 130. REST OF SOUTH AMERICA ROTARY UNINTERRUPTIBLE POWER SUPPLY MARKET ANALYSIS BY APPLICATION
FIGURE 131. REST OF SOUTH AMERICA ROTARY UNINTERRUPTIBLE POWER SUPPLY MARKET ANALYSIS BY REGIONAL
FIGURE 132. MEA ROTARY UNINTERRUPTIBLE POWER SUPPLY MARKET ANALYSIS
FIGURE 133. GCC COUNTRIES ROTARY UNINTERRUPTIBLE POWER SUPPLY MARKET ANALYSIS BY CAPACITY
FIGURE 134. GCC COUNTRIES ROTARY UNINTERRUPTIBLE POWER SUPPLY MARKET ANALYSIS BY INPUT VOLTAGE
FIGURE 135. GCC COUNTRIES ROTARY UNINTERRUPTIBLE POWER SUPPLY MARKET ANALYSIS BY OUTPUT VOLTAGE
FIGURE 136. GCC COUNTRIES ROTARY UNINTERRUPTIBLE POWER SUPPLY MARKET ANALYSIS BY TECHNOLOGY
FIGURE 137. GCC COUNTRIES ROTARY UNINTERRUPTIBLE POWER SUPPLY MARKET ANALYSIS BY APPLICATION
FIGURE 138. GCC COUNTRIES ROTARY UNINTERRUPTIBLE POWER SUPPLY MARKET ANALYSIS BY REGIONAL
FIGURE 139. SOUTH AFRICA ROTARY UNINTERRUPTIBLE POWER SUPPLY MARKET ANALYSIS BY CAPACITY
FIGURE 140. SOUTH AFRICA ROTARY UNINTERRUPTIBLE POWER SUPPLY MARKET ANALYSIS BY INPUT VOLTAGE
FIGURE 141. SOUTH AFRICA ROTARY UNINTERRUPTIBLE POWER SUPPLY MARKET ANALYSIS BY OUTPUT VOLTAGE
FIGURE 142. SOUTH AFRICA ROTARY UNINTERRUPTIBLE POWER SUPPLY MARKET ANALYSIS BY TECHNOLOGY
FIGURE 143. SOUTH AFRICA ROTARY UNINTERRUPTIBLE POWER SUPPLY MARKET ANALYSIS BY APPLICATION
FIGURE 144. SOUTH AFRICA ROTARY UNINTERRUPTIBLE POWER SUPPLY MARKET ANALYSIS BY REGIONAL
FIGURE 145. REST OF MEA ROTARY UNINTERRUPTIBLE POWER SUPPLY MARKET ANALYSIS BY CAPACITY
FIGURE 146. REST OF MEA ROTARY UNINTERRUPTIBLE POWER SUPPLY MARKET ANALYSIS BY INPUT VOLTAGE
FIGURE 147. REST OF MEA ROTARY UNINTERRUPTIBLE POWER SUPPLY MARKET ANALYSIS BY OUTPUT VOLTAGE
FIGURE 148. REST OF MEA ROTARY UNINTERRUPTIBLE POWER SUPPLY MARKET ANALYSIS BY TECHNOLOGY
FIGURE 149. REST OF MEA ROTARY UNINTERRUPTIBLE POWER SUPPLY MARKET ANALYSIS BY APPLICATION
FIGURE 150. REST OF MEA ROTARY UNINTERRUPTIBLE POWER SUPPLY MARKET ANALYSIS BY REGIONAL
FIGURE 151. KEY BUYING CRITERIA OF ROTARY UNINTERRUPTIBLE POWER SUPPLY MARKET
FIGURE 152. RESEARCH PROCESS OF MRFR
FIGURE 153. DRO ANALYSIS OF ROTARY UNINTERRUPTIBLE POWER SUPPLY MARKET
FIGURE 154. DRIVERS IMPACT ANALYSIS: ROTARY UNINTERRUPTIBLE POWER SUPPLY MARKET
FIGURE 155. RESTRAINTS IMPACT ANALYSIS: ROTARY UNINTERRUPTIBLE POWER SUPPLY MARKET
FIGURE 156. SUPPLY / VALUE CHAIN: ROTARY UNINTERRUPTIBLE POWER SUPPLY MARKET
FIGURE 157. ROTARY UNINTERRUPTIBLE POWER SUPPLY MARKET, BY CAPACITY, 2024 (% SHARE)
FIGURE 158. ROTARY UNINTERRUPTIBLE POWER SUPPLY MARKET, BY CAPACITY, 2019 TO 2032 (USD Billions)
FIGURE 159. ROTARY UNINTERRUPTIBLE POWER SUPPLY MARKET, BY INPUT VOLTAGE, 2024 (% SHARE)
FIGURE 160. ROTARY UNINTERRUPTIBLE POWER SUPPLY MARKET, BY INPUT VOLTAGE, 2019 TO 2032 (USD Billions)
FIGURE 161. ROTARY UNINTERRUPTIBLE POWER SUPPLY MARKET, BY OUTPUT VOLTAGE, 2024 (% SHARE)
FIGURE 162. ROTARY UNINTERRUPTIBLE POWER SUPPLY MARKET, BY OUTPUT VOLTAGE, 2019 TO 2032 (USD Billions)
FIGURE 163. ROTARY UNINTERRUPTIBLE POWER SUPPLY MARKET, BY TECHNOLOGY, 2024 (% SHARE)
FIGURE 164. ROTARY UNINTERRUPTIBLE POWER SUPPLY MARKET, BY TECHNOLOGY, 2019 TO 2032 (USD Billions)
FIGURE 165. ROTARY UNINTERRUPTIBLE POWER SUPPLY MARKET, BY APPLICATION, 2024 (% SHARE)
FIGURE 166. ROTARY UNINTERRUPTIBLE POWER SUPPLY MARKET, BY APPLICATION, 2019 TO 2032 (USD Billions)
FIGURE 167. ROTARY UNINTERRUPTIBLE POWER SUPPLY MARKET, BY REGIONAL, 2024 (% SHARE)
FIGURE 168. ROTARY UNINTERRUPTIBLE POWER SUPPLY MARKET, BY REGIONAL, 2019 TO 2032 (USD Billions)
FIGURE 169. BENCHMARKING OF MAJOR COMPETITORS
Research Process

Data Library Research are conducted by industry experts who offer insight on industry structure, market segmentations technology assessment and competitive landscape (CL), and penetration, as well as on emerging trends. Their analysis is based on primary interviews (~ 80%) and secondary research (~ 20%) as well as years of professional expertise in their respective industries. Adding to this, by analysing historical trends and current market positions, our analysts predict where the market will be headed for the next five years. Furthermore, the varying trends of segment & categories geographically presented are also studied and the estimated based on the primary & secondary research.

In this particular report from the supply side Data Library Research has conducted primary surveys (interviews) with the key level executives (VP, CEO’s, Marketing Director, Business Development Manager and SOFT) of the companies that active & prominent as well as the midsized organization

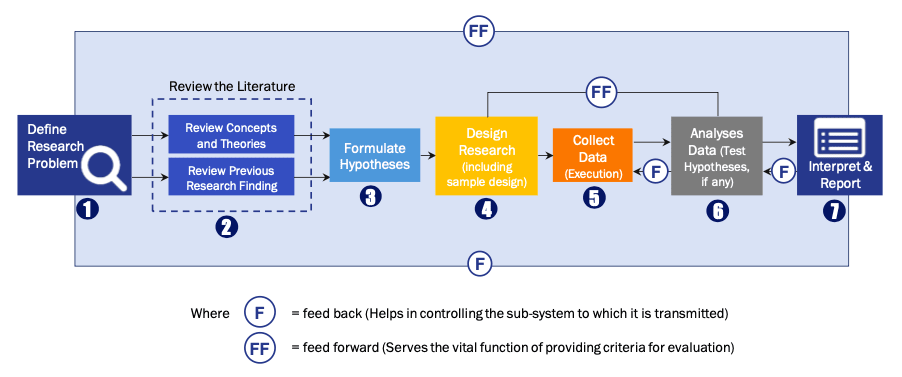
FIGURE 1: DLR RESEARH PROCESS

research-methodology1

Primary Research

Extensive primary research was conducted to gain a deeper insight of the market and industry performance. The analysis is based on both primary and secondary research as well as years of professional expertise in the respective industries.

In addition to analysing current and historical trends, our analysts predict where the market is headed over the next five years.

It varies by segment for these categories geographically presented in the list of market tables. Speaking about this particular report we have conducted primary surveys (interviews) with the key level executives (VP, CEO’s, Marketing Director, Business Development Manager and many more) of the major players active in the market.

Secondary Research

Secondary research was mainly used to collect and identify information useful for the extensive, technical, market-oriented, and Friend’s study of the Global Extra Neutral Alcohol. It was also used to obtain key information about major players, market classification and segmentation according to the industry trends, geographical markets, and developments related to the market and technology perspectives. For this study, analysts have gathered information from various credible sources, such as annual reports, sec filings, journals, white papers, SOFT presentations, and company web sites.

Market Size Estimation

Both, top-down and bottom-up approaches were used to estimate and validate the size of the Global market and to estimate the size of various other dependent submarkets in the overall Extra Neutral Alcohol. The key players in the market were identified through secondary research and their market contributions in the respective geographies were determined through primary and secondary research.

Forecast Model

research-methodology2

Happy to Assist You

If you have a question?

[email protected]

IND : +91 955 279 0357

Browse Related Reports